
Abstract
Purpose
To investigate the effect of differences in linear energy transfer (LET) and thus the relative biological effectiveness (RBE) between passively scattered proton therapy (PS) and pencil-beam scanning intensity-modulated proton therapy (IMPT).
Methods
IMPT treatment plans were generated for six ependymoma patients, originally treated with PS, using the original plan’s computed tomography image sets and beam directions, and its dose-volume values as optimization constraints. Two beam spot sizes and both single-field optimization (SFO) and multi-field optimization (MFO) techniques were used for each patient. Three-dimensional variable-RBE-weighted dose distributions were computed, using Monte Carlo calculated dose and LET distributions, and a linear dose and LET-based RBE model, and were compared between the two delivery methods.
Results
Increased target dose coverage and decreased mean and maximum dose to the OARs was achieved with IMPT compared to PS, for constant RBE value of 1.1. Nevertheless, the maximum variable-RBE-weighted dose to the brainstem, was increased up to 6% for the IMPT plans compared to the corresponding PS plans.
Conclusions
IMPT can be dosimetrically superior to PS for ependymoma patients. However, caution should be exercised so that the increased dose conformity is not counteracted by an increase in radiobiological effect in adjacent critical structures.
Introduction
Pencil-beam scanning (PBS) treatment technique in proton radiation therapy offers the potential to achieve better physical dose conformity compared to passive scattering (PS) [Citation1,Citation2], without the need for patient-specific apertures and dose compensators. Furthermore, PBS in combination with inverse optimization techniques allows for intensity-modulated proton therapy (IMPT) [Citation2]. As such, many proton treatment centers are transitioning from PS to PBS treatment techniques.
In current clinical practice, it is assumed that the two delivery techniques are radiobiologically equivalent and a constant clinical relative biologically effectiveness (RBE) value of 1.1 is used throughout the whole treatment fields for both treatment options. However, it is well-known that the RBE value depends on both dose and LET distributions in a treatment field [Citation3]. Recent studies have shown that different treatment planning techniques may lead to different LET distributions [Citation4,Citation5] and these can potentially affect the RBE-weighted dose, when accounting for variable RBE based on available dose- and LET-based RBE models [Citation5,Citation6].
In patients treated for infratentorial ependymoma, sensitive organs at risk (OARs), such as the brainstem and spinal cord are located at very close proximity, usually anteriorly and adjacent to, if not within, the target volume. Nevertheless, the ideal proton beam arrangement for sparing the cochlea, neuroendocrine structures and temporal lobes consists of posterior–anterior and oblique posterior–lateral fields, placing the distal end of the treatment fields towards or within the brainstem and/or spinal cord, which has been associated with elevated LET and RBE values in the brainstem [Citation7]. Prescribed doses for ependymoma treatment approach tolerance for these critical structures and even a small increase in biological effects could lead to an increased risk of injury with potential life-altering complications for a patient. Under these considerations, the purpose of this study is to compare the three-dimensional (3D) LET distributions between PS and PBS proton therapy delivery techniques and study the potential effect in RBE-weighted dose distribution for ependymoma patients.
Methods
Patient cohort
Six patients, previously treated with PS proton therapy for ependymoma were selected. The XiO treatment planning system (TPS; Computerized Medical Systems Inc., now by ELEKTA, Stockholnm, Sweden) was used for PS treatment planning and delivery of the original plans. All patients had similar anatomy: their target volume located in very close proximity posteriorly to the brainstem, with their clinical target volume (CTV) extending within the brainstem. Five out of six patients received 54 Gy(RBE) to the CTV and one received 50.4 Gy(RBE) to the CTV and 55.8 Gy(RBE) to the gross tumor volume (GTV), all in fractions of 1.8 Gy(RBE).
Re-planning patient treatment for IMPT-PBS
IMPT plans were generated for all patients utilizing an in-house multi-criteria optimization (MCO) system in combination with the TPS ASTROID (v1.3) [Citation8]. Using the original beam directions as in the PS plans additional plans were generated for two pencil-beam spot sizes, of 3 mm and 6 mm at isocenter, averaged over the energy range, and for both single-field optimization (SFO) and multi-field (MFO) IMPT planning techniques, for a total of four IMPT plans per patient, assuming a constant RBE of 1.1. SFO optimization technique allows for 3D modulation of the beam but still results in a uniform dose distribution along the depth of each beam. MFO technique allows for full-intensity modulation and non-uniform dose distribution along the path of each beam [Citation9]. For the larger spot size, the original apertures were also used to ensure that the lateral penumbra would be at least as good as the original plans. To verify that the physical dose distribution of each IMPT plan was equivalent or superior to the corresponding original PS plan, the mean, minimum and maximum dose values for all organs listed in the patient’s original planning report were used as dosimetric constrains for the initial inverse optimization setup. The IMPT plans were then further optimized via MCO navigation to minimize unnecessary dose to OARs while maintaining the same or better target coverage than the PS plans. The target volumes, the brainstem, spinal cord and cochleae were considered in the optimization process, verifying that their physical dose values (mean, minimum and maximum) obtained by IMPT planning were as good or better than the original PS plans.
To include range and setup uncertainties in IMPT treatment planning, since they are not accounted automatically by the optimization algorithm utilized by ASTROID TPS, the CTV used by the original PS plan was expanded uniformly to a planning target volume (PTV) by 3 mm and used as the target for the optimization. The 3 mm expansion was considered as an approximation for the 3.5% of beam range +1 mm, which is used clinically in our institution for PS planning [Citation10], and the beam ranges typical for our patient cohort.
Monte Carlo physical dose, LET and RBE-weighted dose calculation
For every patient, the original planning CT image set, all contoured structures and beam geometry were imported into the TOPAS (TOol for PArticle Simulation) (v2.0.4) Monte Carlo (MC) system [Citation11] for all five treatment plans. For every PBS beam, the optimized fluence map was also imported into TOPAS. Using the clinical dose calculation grid, 3D dose-to-water and corresponding dose-averaged LET (LETd) distributions were scored on a voxel-by-voxel basis [Citation4].
3D variable RBE and RBE-weighted dose distributions were calculated using an LET-based RBE model [Citation6], which assumes a linear relationship between LET and RBE for a given dose, with the slope depending on the α/β ratio of the tissue. We chose the α/β value for target, brainstem, spinal cord and cochleae to be 10, 2.1, 2 and 3 Gy, respectively [Citation12].
Analysis and dose comparisons
For a fair comparison, all MC-calculated dose distributions were normalized to the same target V100% (target volume receiving 100% of the prescription dose) as the corresponding original PS plan. All dose comparisons are based on the normalized MC-calculated physical dose distributions, which were also used along with the corresponding LET distribution for each plan to calculate the variable RBE-weighted dose distribution and dose volume histograms (DVHs). Target D95, minimum and mean dose were used as dosimetric indices along with the mean, maximum and D1cc for the OARs. Dose difference between the highest 5% volume (D05) and D95 was also calculated as an index of dose uniformity for the target. The relative differences in dosimetric indices between IMPT and PS plans for a constant RBE were compared to the same differences when assuming variable RBE distributions to assess whether the potential dosimentric benefit achieved by IMPT planning is maintained when LET and RBE variations are considered.
Results
Re-planning patient treatment with IMPT-PBS
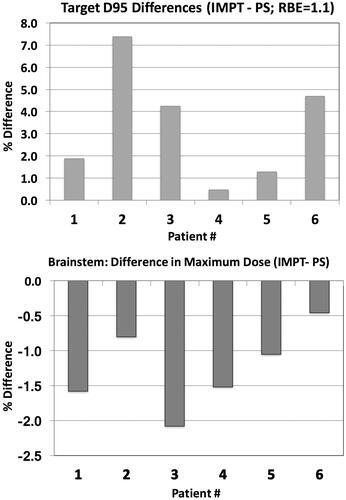
shows the 2D dose distributions for the PS and an IMPT plan for a representative case and the corresponding DVHs for the target and brainstem structures, assuming a constant RBE value of 1.1. The relative difference in physical target dose coverage (D95) and brainstem sparing (maximum dose) for the IMPT optimized plans, using 3 mm average spot size, with reference to the original PS plans, is presented in for all six patients. Thus, if no LET/RBE variations are considered, PBS delivery can achieve better dose conformity, providing simultaneously increased target coverage and brainstem sparing for all six cases. This was true for all the OARs considered in the treatment planning optimization, including but not limited to the brainstem, spinal cord and cochleae. There was increased dose uniformity for all IMPT plans, i.e., the dose variations within the target (D95–D05), averaged over all patients, decreased from 7.7 Gy(RBE) for the PS plans to 4.7 Gy(RBE) for the SFO plans and to 4.1 Gy(RBE) for the MFO plans (3 mm spot size).
Figure 1. 2D dose distribution and DVH comparison between original (PS) and IMPT plan (MFO, using 3 mm spot size).
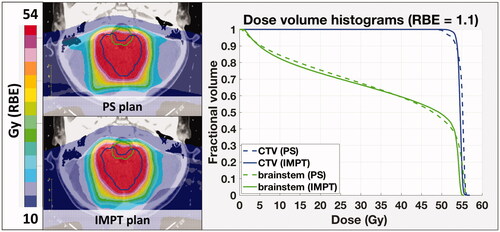
Figure 2. Difference in target coverage (D95) and brainstem maximum dose between the PS and IMPT (MFO, 3 mm) plans.
Dose comparisons accounting for LET and variableRBE-weighted dose distributions
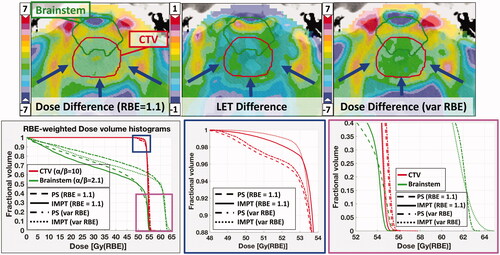
LET distribution calculations resulted in similar values within the target structures for the IMPT plans but lower overall mean and maximum LET values within the brainstem. This allowed for the most part of the brainstem RBE-weighted DVHs for the IMPT plans to remain lower than the corresponding ones for the PS plans, maintaining the trend that the physical DVHs showed. However, an increase in maximum variable-RBE-weighted dose in the brainstem was observed for most IMPT plans, with the increase being most significant when using an average spot size of 6 mm and MFO optimization technique. This effect is illustrated in which shows the comparison between PS and IMPT-PBS treatment plans in terms of absolute difference (IMPT minus PS) in 2D physical dose, LET and RBE-weighted-dose distribution within the target volume and adjacent (partially overlapping) brainstem, and DVHs for constant and variable RBE. The IMPT optimization algorithm succeeds in maintaining target coverage while reducing the brainstem volume receiving high dose, by increasing the relative weight of the pencil beams and the dose at the distal end of the CTV, laterally to the brainstem. This leads to a sharp dose drop-off and increased LET within the brainstem volume not overlapping with the CTV. This combination leads to increased variable-RBE-weighted dose in parts of the brainstem volume, presented as an increase in the brainstem maximum variable-RBE-weighted dose ().
Figure 3. Top: Difference distribution of dose (left), LET (middle), and variable RBE-weighted dose (right): IMPT-PS. Prescription dose: 54 Gy (RBE); red arrows show the beam directions. Bottom: DVH curves for constant and variable RBE (McNamara model) for the CTV and the brainstem. The blue and magenta squares zoom in to display the target coverage and maximum brainstem dose in more detail.
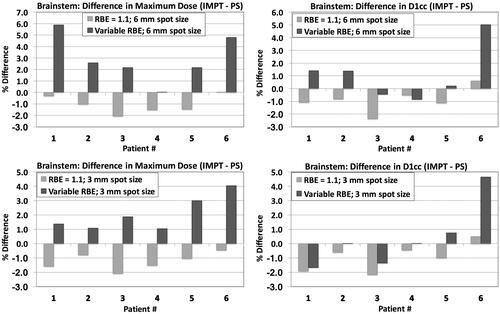
shows the difference in maximum dose between IMPT and PS delivery techniques, for the brainstem, assuming a constant RBE value of 1.1 (light colored bars) and variable RBE distribution (dark colored bars), for both spot sizes. For constant RBE value of 1.1, PBS planning shows dosimetric benefit for the brainstem, as mentioned above; both maximum dose and D1cc are decreased for five out of six cases. When accounting for the LET distribution and variable RBE we don’t observe the same dosimetric benefit as before. In most cases where the maximum brainstem dose or maximum dose to 1 cc (D1cc), for constant RBE, is decreased for the IMPT plans compared to the original PS plans, the variable RBE-weighted dose is found to be the same between the two methods or even higher for the IMPT plan. For Patient 6, this increase exceeds 4%.
Figure 4. Difference in brainstem dose indices between IMPT (MFO) and PS delivery techniques, for both spot sizes. Light colored bars: constant RBE; dark colored bars: variable RBE (McNamara model).
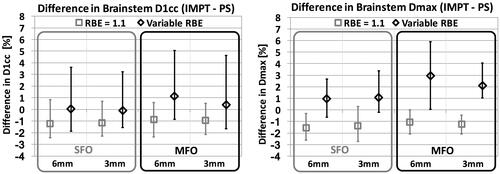
A comparison of the brainstem dose differences achieved with the PBS delivery versus the original PS plans, averaged over all six patients, is shown in , for both SFO and MFO optimization techniques and both spot sizes, for constant and variable RBE. The effect of variable RBE, inverting the dosimetric benefit in maximum brainstem dose achieved with PBS planning assuming constant RBE, is more significant for the larger spot size and IMPT optimization.
Figure 5. Average differences in brainstem D1cc and maximum dose, for both spot sizes, optimization techniques and constant and variable RBE. The error bars show the range of values among the six patients in the study (minimum and maximum differences).
Discussion
Grassberger et al. [Citation4] have previously shown that different planning techniques in proton therapy are usually accompanied by different LET distributions, even though the physical dose distributions may be almost identical. Giantsoudi et al. [Citation5] showed that even within the same treatment technique, PBS planning, variations in dose distributions among equivalently optimal plans may lead to significant variations in LET and RBE values, especially for the OARs at close proximity to the target. It has been suggested that these variations can be utilized in LET-based optimization [Citation13–15]. The clinical relevance of LET variations is however still unclear as some studies have shown no significant correlation with outcome [Citation16], whereas other have indicated that such correlation may exist [Citation17].
While clinical treatment optimization tools assuming constant RBE indicate towards improved dose conformity through PBS delivery techniques, our study suggests that associated LET and RBE variations may negate the dosimetric benefit and sparing of the adjacent OARs. The magnitude of the effect seems to be dependent on the optimization technique, with the effect being smaller for the SFO technique. Contrary to PS, PBS delivery with the SFO technique offers additional degrees of freedom for 3D beam modulation, although it still results in a mostly uniform dose distribution along the path of the beam. MFO, full-IMPT planning technique further allows for non-uniform dose distribution for the length of the field, with the potential of sharper distal dose fall-off due to a small number or even a single heavily weighted pencil beam placed close to the distal end of the field, which could result in a sharp increase in LET. Treatment planning systems normally don’t allow for individual pencil-beam manipulation by the planner but the results for both dose and LET distributions depend on the priorities in the objectives set by the planner. While maintaining the clinical constraints, optimizing towards increased coverage or sparing of a specific OAR may lead to considerably different LET and RBE distributions, indicating different clinical outcome.
While the calculation accuracy of LET values can be comparable to dose accuracy, this study’s main weakness is the reliance on an RBE model based on in vitro cell survival data, whose relevance for clinical endpoints such as toxicities in the brain is unclear. Patient variability of radio-sensitivity, α/β ratio being one of its indicative parameters, is probably as significant, as suggested by several studies [Citation3,Citation16,Citation18]. Thus, while the relative differences between plans based on RBE-weighted doses is valid, absolute values are associated with considerable uncertainties and RBE-weighted dose optimization for clinical treatment planning is not warranted. Nevertheless, our study indicates that treatment planners need to be aware of potential consequences of intensity-modulated planning techniques and that RBE effects can potentially outweigh dosimetric effects. LET-based optimization would mitigate these consequences and might thus be advisable for IMPT. In the publication by Unkelbach et al. [Citation13] it was shown that it is possible to reduce the extra biological dose attributed to the elevated LET in the OARs adjacent to the target, while maintaining their general equivalent uniform dose (gEUD) within 3%. On the same subject, Cao et al. [Citation14] showed that LET-incorporated optimization for IMPT can achieve both reduced LET values in critical organs and increased LET values in target volumes, although a tradeoff between dose and LET distributions in terms of acceptability was also noticed. A robust optimization method considering both proton range and setup uncertainties as well as high LET in the OARs suggested by An et al. [Citation15] resulted in superior plans compared to a conventional robust model.
Conclusion
Pencil-beam scanning proton radiation treatment can be dosimetrically superior to PS, as shown here for ependymoma patients. Accounting for the difference in LET distributions, though, may waive the dosimetric benefit in terms of maximum dose for the OARs, especially when they are located at or close to the distal end of the treatment fields. Even though the clinical relevance has yet to be shown, our study suggests that only LET-guided treatment planning could ensure that dosimetric benefits are maintained when changing planning techniques, especially for sites with critical structures at close proximity to the target area.
Disclosure statement
No potential conflict of interest was reported by the authors.
Additional information
Funding
Related Research Data
References
- Zhang X, Li Y, Pan X, et al. Intensity-modulated proton therapy reduces the dose to normal tissue compared with intensity-modulated radiation therapy or passive scattering proton therapy and enables individualized radical radiotherapy for extensive stage IIIB non-small-cell lung cancer: a virtual clinical study. Int J Radiat Oncol Biol Phys. 2010;77:357–366.
- Safai S, Trofimov A, Adams JA, et al. The rationale for intensity-modulated proton therapy in geometrically challenging cases. Phys Med Biol. 2013;58:6337–6353.
- Paganetti H. Relative biological effectiveness (RBE) values for proton beam therapy. Variations as a function of biological endpoint, dose, and linear energy transfer. Phys Med Biol. 2014;59:R419–R472.
- Grassberger C, Trofimov A, Lomax A, et al. Variations in linear energy transfer within clinical proton therapy fields and the potential for biological treatment planning. Int J Radiat Oncol Biol Phys. 2011;80:1559–1566.
- Giantsoudi D, Grassberger C, Craft D, et al. Linear energy transfer-guided optimization in intensity modulated proton therapy: feasibility study and clinical potential. Int J Radiat Oncol Biol Phys. 2013;87:216–222.
- McNamara AL, Schuemann J, Paganetti H. A phenomenological relative biological effectiveness (RBE) model for proton therapy based on all published in vitro cell survival data. Phys Med Biol. 2015;60:8399–8416.
- Giantsoudi D, Adams J, MacDonald SM, et al. Proton treatment techniques for posterior fossa tumors: consequences for linear energy transfer and dose-volume parameters for the brainstem and organs at risk. Int J Radiat Oncol Biol Phys. 2017;97:401–410.
- Kooy HM, Clasie BM, Lu H-M, et al. A case study in proton pencil-beam scanning delivery. Int J Radiat Oncol Biol Phys. 2010;76:624–630.
- Lomax A. Intensity modulation methods for proton radiotherapy. Phys Med Biol. 1999;44:185–205.
- Paganetti H. Range uncertainties in proton therapy and the role of Monte Carlo simulations. Phys Med Biol. 2012;57:R99–117.
- Perl J, Shin J, Schümann J, et al. TOPAS: an innovative proton Monte Carlo platform for research and clinical applications. Med Phys. 2012;39:6818–6837.
- Wigg D. Applied radiobiology and bioeffect planning. Madison, MI: Medical Physics Publishing Corporation; 2001.
- Unkelbach J, Botas P, Giantsoudi D, et al. Reoptimization of intensity modulated proton therapy plans based on linear energy transfer. Int J Radiat Oncol Biol Phys. 2016;96:1097–1106.
- Cao W, Khabazian A, Yepes PP, et al. Linear energy transfer incorporated intensity modulated proton therapy optimization. Phys Med Biol. 2017;63:015013.
- An Y, Shan J, Patel SH, et al. Robust intensity-modulated proton therapy to reduce high linear energy transfer in organs at risk. Med Phys. 2017;44:6138–6147.
- Giantsoudi D, Sethi RV, Yeap BY, et al. Incidence of CNS injury for a Cohort of 111 patients treated with proton therapy for medulloblastoma: LET and RBE associations for areas of injury. Int J Radiat Oncol Biol Phys. 2016;95:287–296.
- Peeler CR, Mirkovic D, Titt U, et al. Clinical evidence of variable proton biological effectiveness in pediatric patients treated for ependymoma. Radiother Oncol. 2016;121:395–401.
- Sethi RV, Giantsoudi D, Raiford M, et al. Patterns of failure after proton therapy in medulloblastoma; linear energy transfer distributions and relative biological effectiveness associations for relapses. Int J Radiat Oncol Biol Phys. 2014;88:655–663.