
Abstract
Background: The prognostication of metastatic renal cell carcinoma (mRCC) is based on Memorial Sloan Kettering Cancer Center (MSKCC) and International Metastatic Renal Cell Carcinoma Database Consortium (IMDC) risk classifications. Research has shown that hyponatremia is associated with worse prognosis in cancer. We analyzed the association of hyponatremia and outcome in everolimus-treated mRCC patients.
Patients and methods: Baseline and on-treatment (≤12 weeks) sodium in 233 mRCC patients was analyzed using Kaplan–Meier, Cox regression and logistic regression. Baseline sodium was correlated with baseline thrombocyte and neutrophil values.
Results: 65 (28%) and 41 (18%) patients had sodium < lower limit of normal (LLN) at baseline and on-treatment, respectively. Baseline sodium < LLN was associated with shorter overall survival (OS) (6.1 vs. 10.3 months; p < .001) and progression-free survival (PFS) (2.8 vs. 3.5 months; p = .04). On-treatment sodium < LLN was associated with shorter OS (5.4 vs. 9.9 months; p < .001) and PFS (2.8 vs. 4.0 months; p < .001). In multivariate analyses adjusted for IMDC factors, baseline and on-treatment sodium < LLN were significantly associated with shorter OS (adjusted HR 1.46 (95% CI 1.04–2.05); p = .02; adjusted HR 1.80 (95% CI 1.23–2.61); p = .002; respectively). On-treatment sodium < LLN was significantly associated with progressive disease (OR 0.23 (95% CI 0.10–0.56); p = .001). A landmark analysis demonstrated that on-treatment hyponatremia was significantly associated with shorter OS and PFS (p = .01 and p = .03, respectively). On-treatment normalization of hyponatremia was associated with improved OS (unadjusted HR 0.61 (95% CI 0.35–0.98); p = .04), as compared to patients with sustained hyponatremia throughout follow-up.
Conclusions: Hyponatremia associates with poor outcome in mRCC patients treated with everolimus. On-treatment normalization of hyponatremia to normal sodium values associates with favorable outcome.
Introduction
Metastatic renal cell carcinoma (mRCC) is a heterogenous disease with a variable disease course. Two prognostic models have been developed, the Memorial Sloan Kettering Cancer Center (MSKCC) risk classification [Citation1] and the International Metastatic Renal Cell Carcinoma (IMDC) risk classification [Citation2]. However, baseline prognosis can be adjusted by on-treatment prognostic biomarkers [Citation3–5].
Hyponatremia is a common electrolyte disorder. Hyponatremia is associated with poor outcome in several medical conditions, such as liver cirrhosis [Citation6], congestive heart failure [Citation7,Citation8] and systemic infections [Citation9,Citation10]. In non-cancer populations, the diagnosis of hyponatremia was associated with increased risk of a subsequent cancer diagnosis, either in the primary care setting [Citation11], or in hospitalized patients with a first-time hyponatremia diagnosis [Citation12]. In cancer patients, hyponatremia has been associated with poor overall survival (OS) in hepatocellular carcinoma [Citation13], gastric cancer [Citation14] lung cancers [Citation15,Citation16], and gastrointestinal stromal tumors [Citation17] among others. For hospitalized cancer patients, hyponatremia was an independent risk factor of mortality [Citation18].
In localized renal cell carcinoma (RCC), pre-nephrectomy serum sodium levels below median values were associated with poor disease free and OS [Citation19]. In mRCC, baseline hyponatremia was independently associated with poor outcome in patients treated with cytokines [Citation20] or tyrosine kinase inhibitors (TKIs) [Citation21–23], whereas no clear evidence exists in patients treated with mammalian target of rapamycin (mTOR) inhibitors. The mechanisms behind hyponatremia are not entirely understood; an association of chronic inflammation and hyponatremia through elevated interleukin-6 levels has been suggested [Citation22].
Everolimus is a mTOR inhibitor that regulates cell growth, proliferation, survival and angiogenesis [Citation24]. It is standard of care for mRCC patients, whose disease progresses after initial vascular endothelial growth factor (VEGF) therapy, and it can be used either alone, or in combination with lenvatinib. Other treatment options after prior anti-VEGF therapy include nivolumab, cabozantinib and axitinib [Citation25]. The aim of this study was to evaluate baseline and on-treatment sodium as prognostic biomarkers in mRCC patients treated with everolimus.
Patients and methods
We identified 233 mRCC patients treated with everolimus at Helsinki University Central Hospital, Finland (N = 85), and Aarhus University Hospital, Denmark (N = 148). Data were collected from hospital case records using a uniform data collection template; patient characteristics, treatments, adverse events, hospitalizations and outcome data.
Response to treatment was assessed by computed tomography (CT) at 8–12 week intervals. Treatment efficacy was reported according to Response Evaluation Criteria in Solid Tumors v. 1.1 (RECIST v 1.1) [Citation26]. Laboratory values were standardized against institutional upper limit of normal (ULN) and lower limit of normal (LLN) values, when appropriate. Sodium, neutrophil and thrombocyte values were collected at baseline and the highest sodium ≤12 weeks of treatment initiation was additionally recorded. If a normonatremic value was recorded within this time period, the patient was categorized as ‘on-treatment sodium ≥ LLN’.
Statistics
Median follow-up time for patients alive was assessed using Schemper’s method. The association of hyponatremia and clinical variables was assessed using the Mann–Whitney U-test for continuous data and the Chi-squared test for categorical data. Spearman’s correlation was used to evaluate the associations of baseline sodium and baseline neutrophils or thrombocytes as continuous variables. OS was defined as time from everolimus treatment initiation to death, whatever the cause, and progression-free survival (PFS) was defined as time from everolimus initiation to the first event (tumor progression or death from any cause). Clinical benefit rate (CBR) was defined as partial response (PR) and stable disease (SD) as overall best response according to RECIST 1.1. The Kaplan–Meier method was used to estimate the median survival times with 95% confidence intervals for both OS and PFS, censoring the patients who were alive or had no disease progression at the last follow-up visit.
Univariate Cox proportional hazard model was used to assess the association between clinical variables and OS and PFS. Multivariate analyses for OS and PFS were performed using Cox proportional hazard models adjusted for IMDC risk classification and factors not included in the IMDC classification that were significantly associated with outcome in univariate analyses (at p < .1). The results were expressed as HRs with 95% CI. The proportional hazards assumption was assessed graphically, obtaining plots of (log(−logS(t)) versus time and Schoenfeld residuals versus time.
A multivariate logistic regression model was used to investigate the effects of clinicopathological factors significantly associated with the CBR in univariate analyses. The results were expressed as ORs with 95% CI.
To control for potential time bias when investigating on-treatment sodium values, a landmark survival analysis was applied, with the landmark set at 12 weeks after date of initiation of everolimus treatment. Per the landmark method, the analysis included patients who had no events before the landmark time point. PFS and OS were defined as the time from the landmark to progression or death from any cause, and sodium values were assessed before the landmark time point.
All statistical tests were two-sided and p < .05 were considered as statistically significant. Analyses were performed using IBM SPSS Statistics for Windows (version 23.0; IBM Corp., Armonk, NY, USA).
Results
Patient characteristics
The study population consisted of 233 patients with mRCC. A total of 111 patients (48%) received everolimus as second line treatment, 83 patients (36%) as third line, and the remaining 39 patients (17%) as fourth or later treatment line. Median follow-up time of patients alive was 37.1 months and median time on everolimus treatment was 2.8 months (range 0.1–46.3 months). About 151 (65%) patients stopped treatment due to progression and 69 (30%) patients without progression (48 due to adverse events, 21 for other reasons). The remaining 13 patients (6%) continued treatment at the time of data cutoff.
Overall survival and progression-free survival for the whole patient cohort were 8.7 months (95% CI 7.2–10.2 months) and 3.3 months (95% CI 2.9–3.7 months), respectively. The CBR was 43% (99 patients), comprising PR (3%) and SD (40%); 131 (57%) patients had progressive disease (PD) as their best response. For three patients, there was no CT-scan performed before data cutoff to evaluate response to treatment.
Among the 233 patients, 65 (30%) had sodium < LLN at baseline. Baseline patient characteristics overall and by sodium status are summarized in . Baseline sodium < LLN was significantly associated with elevated baseline neutrophils > ULN (p = .002) and IMDC poor risk classification (p = .01) (). A similar tendency was noted between baseline sodium < LLN and elevated thrombocytes > ULN (p = .08). When evaluated as continuous variables, baseline sodium correlated inversely with baseline neutrophils (Spearman’s r = −0.23; p = .001) and baseline thrombocytes (Spearman’s r = −0.25; p < .001). No relationship between number of previous treatment lines and baseline sodium values was noted. Within 12 weeks of treatment initiation, 41 (18%) patients had sodium < LLN. Of the 65 patients with baseline sodium < LLN, 35 (58%) had reversal to values ≥ LLN during therapy.
Table 1. Baseline patient characteristics by sodium status.
Sodium and outcome
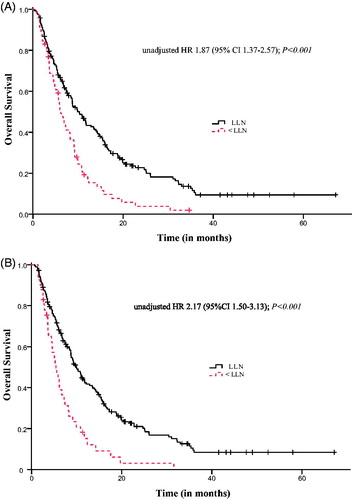
In univariate analyses, patients with baseline sodium < LLN compared to patients with baseline sodium ≥ LLN had significantly shorter OS (6.1 months (95% CI 4.8–7.5) vs. 10.3 months (95% CI 8.1–12.5); p < .001) and shorter PFS (2.8 months (95% CI 2.7–3.0) vs. 3.5 months (95% CI 2.7–4.4); p = .04). The CBR among patients with baseline sodium < LLN was 38% vs. 45% among patients with sodium ≥ LLN (p = .29).
Patients with sodium < LLN vs. sodium ≥ LLN within 12 weeks of treatment initiation had significantly shorter OS (5.4 months (95% CI 3.8–7.0) vs. 9.9 months (95% CI 8.3–11.5); p < .001) and shorter PFS (2.8 months (95% CI 2.6–3.0) vs. 4.0 months (95% CI 2.9–5.1); p < .001). The CBR for patients with sodium < LLN during treatment was 18% vs. 50% among patients with sodium ≥ LLN (p < .001). Response rates according to different clinicopathological factors are shown in Table S1. Kaplan–Meier survival curves for baseline and on-treatment hyponatremia and OS are depicted in .
Figure 1. Overall survival for (A) baseline sodium and (B) on-treatment sodium.
Univariate analyses additionally identified Karnofsky performance status, baseline hemoglobin, baseline neutrophils, number of previous treatment lines and IMDC risk classification as factor significantly associated with OS. Age, Karnofsky performance status, baseline hemoglobin, baseline neutrophils and IMDC risk classification were shown to be significantly associated with PFS. Results from univariate analyses are depicted in Table S2.
Multivariate analyses
Due to strong correlation of baseline sodium and sodium during treatment (Cramer’s V = 0.67), two separate Cox regression models were built to evaluate the independent association of both baseline sodium and on-treatment sodium with outcome. In addition to sodium < LLN, IMDC risk classification and factors not included in the IMDC classification that were significantly associated with outcome in univariate analyses (at p < .1) were entered in the model. Results from multivariate analyses are depicted in . Baseline sodium < LLN was independently associated with OS (adjusted HR 1.46 (95% CI 1.04–2.05); p = .02). On treatment sodium < LLN was independently associated with both OS (adjusted HR 1.80 (95% CI 1.23–2.61); p = .002) and PFS (adjusted HR 1.71 (95% CI 1.19–2.46); p = .004).
Table 2. Multivariate survival analyses with (A) baseline sodium and (B) on-treatment sodium.
A multivariate logistic regression analysis was performed to ascertain the adjusted effects of factors significantly associated with the CBR in univariate analyses. In a model adjusted for Karnofsky performance status, albumin corrected calcium and baseline neutrophils, patients with sodium < LLN during treatment were almost five times more likely to have PD as their best response as compared to patients with sodium ≥ LLN (OR 0.23 (95% CI 0.10–0.56); p = .001).
Landmark analysis
After excluding patients who progressed or died before the landmark time point, 131 patients were included in the landmark analysis. In the analysis, on-treatment sodium < LLN (N = 16, 12%) was associated with shorter OS (5.4 vs. 12.4 months; p = .01) and PFS (0.8 vs. 3.2 months; p = .03) as compared to patients with on-treatment sodium ≥ LLN.
Subgroup analysis
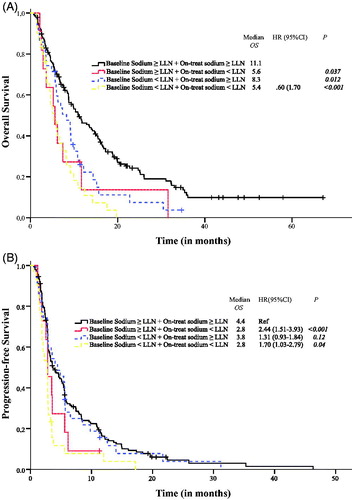
To evaluate the relationship of baseline and on-treatment sodium in further detail, we performed a subgroup analysis among patients with and without baseline and on-treatment hyponatremia. Results from the subgroup analysis are depicted in . Sustained sodium values at < LLN were significantly associated with poor OS and PFS as compared to patients with normal sodium values throughout treatment. A shift from baseline sodium ≥ LLN to on-treatment < LLN was associated with shorter OS as compared to patients with normal sodium values both at baseline and during treatment.
Figure 2. Subgroup analysis among patients with and without baseline hyponatremia and on-treatment hyponatremia or normal sodium; (A) association with overall survival (OS) and (B) association with progression free survival (PFS). LLN: lower limit of normal.
Discussion
To the best of our knowledge, this is the first study to demonstrate the prognostic impact of sodium in mRCC patients treated with a mTOR inhibitor. We demonstrate that baseline sodium < LLN was independently associated with shorter OS, and on-treatment sodium < LLN with shorter OS and PFS. Patients with on-treatment hyponatremia were almost five times more likely to have PD as their best response, as compared to patients with normal sodium. Sodium was also a dynamic biomarker; a shift from baseline sodium ≥ LLN to < LLN during treatment was associated with modest OS and PFS, whereas on-treatment normalization of hyponatremia was associated with improved OS. These results demonstrate that in addition to IMDC risk criteria, baseline and on-treatment sodium values could be used to improve prognostication of mRCC patients. As the study was conducted only among mRCC patients on everolimus therapy, no definitive conclusions on whether hyponatremia could be predictive in this setting can be drawn. We demonstrate that on-treatment sodium values were significantly associated with the CBR and that the reversal of hyponatremia to normal sodium values during treatment was associated with longer OS. In essence, hyponatremia is a negative prognostic factor and this information may be incorporated in the clinical decision making, in an era with a variety of treatment options [Citation25]. Normalization of baseline hyponatremia to normal sodium has also been associated with improved OS in mRCC patients treated with interleukin-2 or TKIs [Citation3], and in lung cancer patients [Citation27]. Our results implicate sodium as a prognostic biomarker in everolimus treated mRCC patients. Assessment of serum sodium is easy, cheap, reliable, and reproducible. Other recent mTOR biomarkers include everolimus-induced pneumonitis predictive of everolimus efficacy [Citation28], and deterioration in IMDC prognostic category during first-line TKI, as rationale for selecting everolimus as second line therapy [Citation29].
In mRCC, the negative prognostic and predictive impact of hyponatremia has been demonstrated in patients treated with cytokines [Citation20] and targeted therapies [Citation21–23]. One study comprised a modest number (3%) of patients treated with mTOR therapies [Citation23]. Our data, obtained in a large mTOR-inhibitor treated mRCC cohort, confirm that hyponatremia independently associates with worse outcomes, thereby extending and underscoring the negative impact of hyponatremia in mRCC patients, irrespective of therapy. Assessment of hyponatremia in patients treated with check-point inhibitors is warranted.
Mechanisms underlying the development of hyponatremia in RCC patients are presently unclear. Inappropriate secretion of antidiuretic hormone (ADH) is frequently seen in lung cancer [Citation30] and head and neck cancer [Citation31], and may play a role in RCC. Other possibilities include renal dysfunction, poor adrenal gland function, existing comorbidities, concomitant medications (such as diuretics and steroids), cancer therapy and/or its adverse effects [Citation32–37]. One intriguing hypothesis is also the possible association of chronic inflammation and hyponatremia but more research with inflammation markers is needed in this area.
Potential limitations of our study are the retrospective nature and that the cohort represents a heterogeneous group of patients including different histological variants of RCC. Data were lacking regarding concomitant medication, comorbidities, and renal and adrenal gland function.
We conclude that the present data identifies sodium, a readily available and inexpensive laboratory parameter, as a prognostic biomarker in a large mRCC cohort treated with everolimus. Additionally, the association of on-treatment sodium values and outcome suggests that monitoring sodium values during treatment may be of use in clinical decision making. The association of baseline neutrophilia/thrombocytosis and hyponatremia are intriguing findings, supporting previous evidence of chronic inflammation as a driver of disease progression and metastasis. Additional studies are warranted, to further evaluate this association.
Supplemental Material
Download Zip (24.8 KB)Disclosure statement
This research did not receive any specific grant from funding agencies in the public, commercial, or not-for-profit sectors. P. Penttilä has received honoraria from Novartis. P. Bono has received research funding from Novartis and honoraria from Pfizer, Novartis, Orion Pharma, BMS and MSD. K. Peltola has received honoraria from BMS, Pfizer, Roche, Orion, Merck and Eli Lilly. F. Donskov has received research funding from Pfizer, GSK and Novartis.
Related Research Data
References
- Motzer RJ, Escudier B, Bukowski R, et al. Prognostic factors for survival in 1059 patients treated with sunitinib for metastatic renal cell carcinoma. Br J Cancer. 2013;108:2470–2477.
- Heng DY, Xie W, Regan MM, et al. Prognostic factors for overall survival in patients with metastatic renal cell carcinoma treated with vascular endothelial growth factor-targeted agents: results from a large, multicenter study. J Clin Oncol. 2009;27:5794–5799.
- Soerensen AV, Geertsen PF, Christensen IJ, et al. A five-factor biomarker profile obtained week 4-12 of treatment for improved prognostication in metastatic renal cell carcinoma: results from DARENCA study 2. Acta Oncol. 2016;55:341–348.
- Donskov F, Michaelson MD, Puzanov I, et al. Sunitinib-associated hypertension and neutropenia as efficacy biomarkers in metastatic renal cell carcinoma patients. Br J Cancer. 2015;113:1571–1580.
- Rautiola J, Donskov F, Peltola K, et al. Sunitinib-induced hypertension, neutropaenia and thrombocytopaenia as predictors of good prognosis in patients with metastatic renal cell carcinoma. BJU Int. 2016;117:110–117.
- Luca A, Angermayr B, Bertolini G, et al. An integrated MELD model including serum sodium and age improves the prediction of early mortality in patients with cirrhosis. Liver Transpl. 2007;13:1174–1180.
- Rossi J, Bayram M, Udelson JE, et al. Improvement in hyponatremia during hospitalization for worsening heart failure is associated with improved outcomes: insights from the Acute and Chronic Therapeutic Impact of a Vasopressin Antagonist in Chronic Heart Failure (ACTIV in CHF) trial. Acute Card Care 2007;9:82–86.
- Rusinaru D, Tribouilloy C, Berry C, et al. Relationship of serum sodium concentration to mortality in a wide spectrum of heart failure patients with preserved and with reduced ejection fraction: an individual patient data meta-analysis(dagger): Meta-Analysis Global Group in Chronic heart failure (MAGGIC). Eur J Heart Fail 2012;14:1139–1146.
- Nair V, Niederman MS, Masani N, et al. Hyponatremia in community-acquired pneumonia. Am J Nephrol. 2007;27:184–190.
- Chao YN, Chiu NC, Huang FY. Clinical features and prognostic factors in childhood pneumococcal meningitis. J Microbiol Immunol Infect. 2008;41:48–53.
- Selmer C, Madsen JC, Torp-Pedersen C, et al. Hyponatremia, all-cause mortality, and risk of cancer diagnoses in the primary care setting: a large population study. Eur J Int Med. 2016;36:36–43.
- Holland-Bill L, Christiansen CF, Farkas DK, et al. Diagnosis of hyponatremia and increased risk of a subsequent cancer diagnosis: results from a nationwide population-based cohort study. Acta Oncol. 2018;57:522–527.
- Huo TI, Lin HC, Hsia CY, et al. The MELD-Na is an independent short- and long-term prognostic predictor for hepatocellular carcinoma: a prospective survey. Digest Liver Dis. 2008;40:882–889.
- Kim HS, Yi SY, Jun HJ, et al. Clinical outcome of gastric cancer patients with bone marrow metastases. Oncology. 2007;73:192–197.
- Gandhi L, Johnson BE. Paraneoplastic syndromes associated with small cell lung cancer. J Natl Compr Canc Netw. 2006;4:631–638.
- Hermes A, Waschki B, Reck M. Hyponatremia as prognostic factor in small cell lung cancer-a retrospective single institution analysis. Respir Med. 2012;106:900–904.
- Aggerholm-Pedersen N, Rasmussen P, Dybdahl H, et al. Serum natrium determines outcome of treatment of advanced GIST with imatinib: a retrospective study of 80 patients from a single institution. ISRN Oncol. 2011;2011:523915.
- Abu Zeinah GF, Al-Kindi SG, Hassan AA, et al. Hyponatraemia in cancer: association with type of cancer and mortality. Eur J Cancer Care (Engl). 2015;24:224–231.
- Vasudev NS, Brown JE, Brown SR, et al. Prognostic factors in renal cell carcinoma: association of preoperative sodium concentration with survival. Clin Cancer Res. 2008;14:1775–1781.
- Jeppesen AN, Jensen HK, Donskov F, et al. Hyponatremia as a prognostic and predictive factor in metastatic renal cell carcinoma. Br J Cancer. 2010;102:867–872.
- Furukawa J, Miyake H, Kusuda Y, et al. Hyponatremia as a powerful prognostic predictor for Japanese patients with clear cell renal cell carcinoma treated with a tyrosine kinase inhibitor. Int J Clin Oncol. 2015;20:351–357.
- Kawashima A, Tsujimura A, Takayama H, et al. Impact of hyponatremia on survival of patients with metastatic renal cell carcinoma treated with molecular targeted therapy. Int J Urol. 2012;19:1050–1057.
- Schutz FA, Xie W, Donskov F, et al. The impact of low serum sodium on treatment outcome of targeted therapy in metastatic renal cell carcinoma: results from the International Metastatic Renal Cell Cancer Database Consortium. Eur Urol. 2014;65:723–730.
- Brugarolas J. Renal-cell carcinoma-molecular pathways and therapies. N Engl J Med. 2007;356:185–187.
- Escudier B, Porta C, Schmidinger M, et al. Renal cell carcinoma: ESMO Clinical Practice Guidelines for diagnosis, treatment and follow-up. Ann Oncol. 2016;27:v58–v68.
- Eisenhauer EA, Therasse P, Bogaerts J, et al. New response evaluation criteria in solid tumours: revised RECIST guideline (version 1.1). Eur J Cancer. 2009;45:228–247.
- Berardi R, Santoni M, Newsom-Davis T, et al. Hyponatremia normalization as an independent prognostic factor in patients with advanced non-small cell lung cancer treated with first-line therapy. Oncotarget. 2017;8:23871–23879.
- Penttila P, Donskov F, Rautiola J, et al. Everolimus-induced pneumonitis associates with favourable outcome in patients with metastatic renal cell carcinoma. Eur J Cancer. 2017;81:9–16.
- Davis ID, Xie W, Pezaro C, et al. Efficacy of second-line targeted therapy for renal cell carcinoma according to change from baseline in international metastatic renal cell carcinoma database consortium prognostic category. Eur Urol. 2017;71:970–978.
- SØRensen JB, Andersen MK, Hansen HH. Syndrome of inappropriate secretion of antidiuretic hormone (SIADH) in malignant disease. J Intern Med. 1995;238:97–110.
- Talmi YP, Wolf GT, Hoffman HT, et al. Elevated arginine vasopressin levels in squamous cell cancer of the head and neck. Laryngoscope. 1996;106:317–321.
- Goel A, Kalra OP. Hyponatremia in older individuals. J Assoc Physicians India. 2010;58:663–664.
- Bichet D, Szatalowicz V, Chaimovitz C, et al. Role of vasopressin in abnormal water excretion in cirrhotic patients. Ann Intern Med. 1982;96:413–417.
- Hamdi T, Latta S, Jallad B, et al. Cisplatin-induced renal salt wasting syndrome. South Med J. 2010;103:793–799.
- Sahay M, Sahay R. Hyponatremia: a practical approach. Ind J Endocrinol Metab. 2014;18:760–771.
- Spital A. Diuretic-induced hyponatremia. Am J Nephrol. 1999;19:447–452.
- Oren RM. Hyponatremia in congestive heart failure. Am J Cardiol. 2005;95:2b–7b.