
Abstract
Background: Radiomic features retrieved from standard CT-images have shown prognostic power in several tumor sites. In this study, we investigated the prognostic value of pretreatment CT radiomic features to predict overall survival of esophageal cancer patients after chemoradiotherapy.
Material and methods: Two datasets of independent centers were analyzed, consisting of esophageal cancer patients treated with concurrent chemotherapy (Carboplatin/Paclitaxel) and 41.4Gy radiotherapy, followed by surgery if feasible. In total, 1049 radiomic features were calculated from the primary tumor volume. Recursive feature elimination was performed to select the 40 most relevant predictors. Using these 40 features and six clinical variables as input, two random forest (RF) models predicting 3-year overall survival were developed.
Results: In total 165 patients from center 1 and 74 patients from center 2 were used. The radiomics-based RF model yielded an area under the curve (AUC) of 0.69 (95%CI 0.61–0.77), with the top-5 most important features for 3-year survival describing tumor heterogeneity after wavelet filtering. In the validation dataset, the RF model yielded an AUC of 0.61 (95%CI 0.47–0.75). Kaplan Meier plots were significantly different between risk groups in the training dataset (p = .027) and borderline significant in the validation dataset (p = .053). The clinical RF model yielded AUCs of 0.63 (95%CI 0.54–0.71) and 0.62 (95%CI 0.49–0.76) in the training and validation dataset, respectively. Risk groups did not reach a significant correlation with pathological response in the primary tumor.
Conclusions: A RF model predicting 3-year overall survival based on pretreatment CT radiomic features was developed and validated in two independent datasets of esophageal cancer patients. The radiomics model had better prognostic power compared to the model using standard clinical variables.
Introduction
Neo-adjuvant chemoradiotherapy (nCRT) followed by surgical resection is increasingly being considered as the first-line treatment for patients diagnosed with esophageal cancer [Citation1,Citation2]. One of the larger trials in which nCRT followed by surgery was compared to surgery alone is the ‘Dutch ChemoRadiotherapy for Oesophageal cancer followed by Surgery Study’ (CROSS) [Citation3,Citation4]. Given the significantly better overall and disease-free survival rates in the nCRT arm, the CROSS regimen is currently considered the standard treatment for locally advanced esophageal cancer in Europe [Citation5]. Due to the large proportion of patients with a pathological complete response (up to ∼30%), that is, no residual cancer after nCRT, there is increasing interest in the so-called ‘surgery-as-needed’ approach [Citation6]. In this personalized approach [Citation7,Citation8], surgery is only offered to those patients that would potentially benefit. Also other modifications to the standard CROSS-treatment, for instance additional radiotherapy or chemotherapy, to increase the probability of complete response, might be interesting for certain patient subgroups. To facilitate such a personalized strategy and adapt treatment already in an early stage, solid predictive and prognostic models, incorporated in clinical decision support systems (CDSS), could play an important role [Citation8,Citation9].
In addition to the common clinical factors, quantitative imaging biomarkers might be an interesting source of information for clinical prediction models. These so-called radiomic features can potentially identify a prognostic phenotype which exists in multiple cancer types [Citation10–13]. Also in esophageal cancer, several studies demonstrated the potential prognostic value of CT textural features. For instance, Ganeshan et al. [Citation14] reported a correlation between CT texture analysis and adverse biological features as tumor metabolism and clinical stage. Yip et al. showed that tumor heterogeneity reduces during neo-adjuvant chemotherapy [Citation15] and that post-treatment textural parameters were associated with survival [Citation16]. However, these studies only included a limited number of patients and textural features, and lacked external datasets to validate their findings.
The main purpose of the current study was to further explore the prognostic value of pretreatment 3D textural analysis in CT images of esophageal cancer patients. We hypothesized that CT radiomics features contain prognostic information in addition to the conventional baseline clinical variables gender, age, histology and cTNM-stage, as well as the tumor regression grade (TRG) after neo-adjuvant treatment. To test this hypothesis, we trained and externally validated two prognostic models to predict 3-year overall survival after CROSS treatment based on either radiomics or clinical variables.
Material and methods
Patients
Esophageal cancer patients who underwent nCRT at the Academic Medical Center (AMC dataset) or Maastro Clinic (Maastro dataset) between 2010 and 2016 were included in this retrospective study. Examination before treatment included (PET/)CT scanning, endoscopic ultrasonography (EUS) and histopathological examination of biopsy samples. All patients were treated with the CROSS regimen [Citation3,Citation4]. The regimen consists of 41.4Gy radiotherapy in 23 fractions, together with five concurrent cycles of carboplatin (targeted at an area under the curve [AUC] of 2 mg per milliliter per minute) and paclitaxel (50 mg per square meter of body-surface area) chemotherapy. Surgical resection typically was attempted 6 to 10 weeks after completion of the nCRT, depending on the patient’s condition and the absence of metastatic disease. Patients without surgical resection of the esophagus were excluded from analysis. This study was approved by the Institutional Review Board.
Image acquisition
The CT-scans acquired for radiotherapy planning purposes were used for image analysis. The AMC-patients were scanned on a General Electric LightSpeed RT16 (General Electric Healthcare, Milwaukee, WI, USA), Philips PQ5000 or Philips Gemini TF (Philips Healthcare, Best, The Netherlands) scanner, using a peak-voltage of 120 kVp and a slice thickness of 2.5–5 mm. The CT-scans in the Maastro dataset were acquired on a Siemens SOMATOM Sensation Open CT or Siemens Biograph 40 PET/CT scanner (Siemens, Erlangen, Germany) using 120 kVp and a slice thickness of 1–3 mm. Intra-venous contrast enhancement was optional and used for most of the patients. To minimize the variability between the datasets, scans were resampled to voxels of 1 × 1 × 3 mm3 using cubic interpolation [Citation17].
Quantitative image analysis
The primary gross tumor volumes used for radiotherapy planning were used as region of interest (ROI) for the quantitative image analysis. Patients with more than one primary tumor location were not included. Within the ROI, in total 1049 radiomics features were extracted using an in-house developed radiomics toolbox. The total feature space was composed of 19 first-order gray-level statistics features describing the tumor intensity, 23 geometric features describing the tumor shape and size, 95 textural features describing the spatial distribution of voxel intensities and 912 textural and statistics features extracted after three-dimensional wavelet transformation of the images.
A wavelet transformation filters the original 3D image in each direction using a high-pass and low-pass filter, yielding eight decompositions. The high-pass decompositions describe local changes in intensity (i.e., details) in the original image. The low-pass decompositions provide an approximation of the original image without high frequency details. A detailed description is available in the supplementary information of Aerts et al. [Citation11].
The textural features were derived from the gray-level co-occurrence (GLCM, 26 features) [Citation18], gray-level distance-zone (GLDZM, 16 features) [Citation19], gray-level run-length (GLRLM, 16 features) [Citation20], gray-level size-zone (GLSZM, 16 features) [Citation21], neighboring gray-level dependence (NGLDM, 16 features) [Citation22] and neighborhood gray-tone difference (NGTDM, 5 features) [Citation23] matrices. Mathematical definitions of all features are available in the supplementary appendix of Lambin et al. [Citation24].
Statistical analysis
Statistical analysis was performed in R-3.3.2 (R: A Language and Environment for Statistical Computing, 2016, Vienna, Austria). First, a 10-fold cross-validated recursive feature elimination based on tree bagging was performed on the AMC dataset using the ‘classification and regression training’ (caret) package [Citation25]. This resulted in a ranking of the most important predictors for 3-year overall survival. Next, the 40 most important radiomics features were used as input for a random forest (RF) model with 500 trees and a node size of 5, using the ‘randomForest’ package [Citation26]. A second RF model was developed using the clinical variables gender, age, histology and cTNM-stage. Both models were trained on the AMC data and validated on the Maastro data. Patients were divided in high and low risk groups based on the prediction by the RF model. If the predicted probability on 3-year overall survival was more than 50%, patients were classified as ‘low-risk’. Finally, the correlation between the RF models and TRG [Citation27] of the primary tumor was investigated.
Results
In total, 165 AMC and 74 Maastro patients were eligible for analysis. The majority of the patients was male (80%), had a cT3-stage (76%), adenocarcinoma histology (81%) and tumor located in the distal esophagus or cardia (88%). Patient characteristics were similar in both datasets, except for the cN-stages and cM-stages. The Maastro dataset contained a higher percentage of N3 patients (14% vs. 3%), whereas the AMC dataset contained more M1a and Mx patients (20% vs. 1%). All patient characteristics are summarized in . At 3-year follow-up time, 67 AMC patients and 25 Maastro patients were still alive. The median overall survival time of the cohorts was 24.1 (95% CI: 19.1–33.0) and 17.4 (95% CI: 12.7–29.3) months, respectively.
Table 1. Patient characteristics.
The top-40 features ranked by the recursive feature elimination comprised 33 textural features, 4 statistics features and 3 shape features. Twenty-eight of these features were extracted after wavelet filtering. Full feature names and the corresponding ranking is available in Supplementary Table S1.
The first radiomics-based RF model trained on the AMC dataset (n = 165) yielded an AUC of 0.69 (95% CI 0.61–0.77) in predicting 3-year overall survival. In the Maastro dataset (n = 74) used for validation, the model yielded a lower AUC of 0.61 (95% CI 0.47–0.75). The receiver operating characteristic curve is shown in . The top-5 features with the highest importance in the final model were: ‘Wavelet LHL GLCM Inverse Variance’, ‘Wavelet LLH GLDZM Low Intensity Large Distance Emphasis’, ‘Wavelet HHL GLRLM Run Length Non-Uniformity’, ‘Wavelet HHH GLCM Correlation’, and ‘Wavelet HHL NGLDM Dependence Non-Uniformity’. All these features, calculated after wavelet decomposition of the CT images, are a measure for tumor heterogeneity. The importance ranking of the features in the final RF model is available in Supplementary Table S1.
Figure 1. ROC-curves for the AMC cohort (training) and Maastro cohort (validation) for the random forest models based on (a) 40 radiomic features and (b) 6 clinical variables.
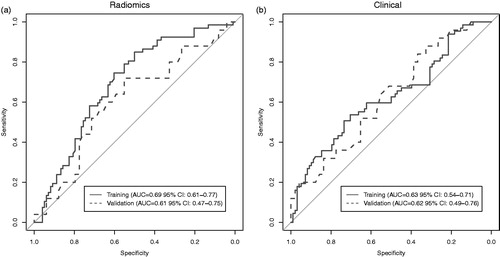
The second RF model containing only clinical variables, yielded an AUC of 0.63 (95% CI 0.54–0.71) in the training dataset and 0.62 (95% CI 0.49–0.76) in the validation dataset. In this model, ‘age’ had the highest importance with a mean decrease in Gini impurity criteria of 15.5, whereas ‘gender’ had the lowest importance (mean decrease 1.5). The corresponding ROC-curves are shown in .
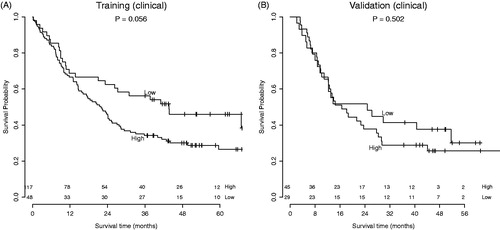
Patients were divided in high and low risk groups using the predicted risk of the RF model. Using the radiomics-based model, there was a clear split between risk groups for overall survival in both the training and validation dataset. This split was statistically significant in the training dataset (p = .027) and borderline significant in the validation dataset (p = .053). In the model based on clinical variables, borderline significance between risk groups was observed in the training dataset (p = .056), but this trend was not visible in the validation dataset (p = .502). The corresponding Kaplan Meier curves are shown in and .
Figure 2. Survival curves of the (a) AMC cohort (training) and (b) Maastro cohort (validation). Division in risk groups was based on the predictions by the random forest model with radiomics features.
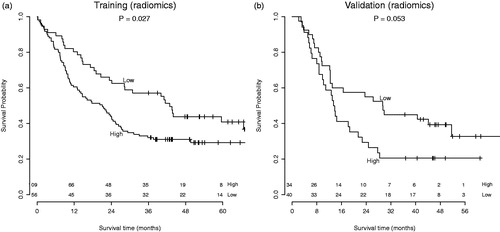
Figure 3. Survival curves of the (a) AMC cohort (training) and (b) Maastro cohort (validation). Division in risk groups was based on the predictions by the random forest model with clinical variables.
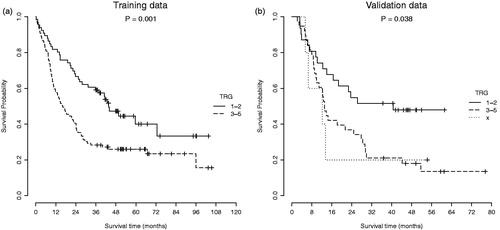
In both the training and validation datasets, patients with a complete (TRG 1) or major (TRG 2) pathological response in the primary tumor had a significantly better overall survival than patients with moderate or no response (TRG 3–5), as illustrated in . This pathological response did not correlate with all risk groups identified by the RF models. When comparing the high-risk and low-risk groups identified by the radiomics RF model, the low-risk group had a higher fraction of patients with a complete or major pathological response. However, this difference was not significant in both the training (p = .123) and validation (p = .086) dataset. The clinical RF model showed a more diverse correlation with pathological response. Low-risk patients had a more favorable pathological response compared to high-risk patients in the training dataset (p = .042), but in the validation dataset a contradictory trend was visible, although not significant (p = .292). Contingency tables with absolute numbers for these correlations, as well as Kaplan Meier curves for individual TRGs, are available in the Supplementary Appendix (Tables S2 and S3, and Figure S1).
Figure 4. Survival curves of the (a) AMC cohort (training) and (b) Maastro cohort (validation). Division in risk groups was based on the pathological response in the primary tumor.
Discussion
The CROSS-regimen is currently the standard treatment for esophageal cancer patients with curative intent. To further personalize this treatment, for example, only offer surgery to patients that potentially benefit, solid prognostic models are essential. In this study, we further explored the potential of pretreatment CT radiomics features to predict overall survival in esophageal cancer patients.
Two independent datasets of in total 239 patients were analyzed. Recursive feature elimination resulted in a subset of 40 radiomic predictors that mainly consisted of wavelet textural features and a few statistics and shape features. In the final RF model trained on only these radiomic features, the first 17 most important features were all wavelet features describing tumor heterogeneity. Although wavelet textural features might be less intuitive to interpret than shape (e.g., volume, axis length) and histogram (e.g., energy, mean) features, these results indicate that more complex tumor heterogeneity parameters can be an important prognostic factor for overall survival. This is in line with previous radiomics studies, in which CT imaging features describing tumor heterogeneity also were shown to have prognostic value in lung [Citation11,Citation13], head-and-neck [Citation12] and esophageal cancer [Citation14–16].
The radiomics-based RF model yielded a significant AUC of 0.69 (95% CI 0.61–0.77) in the training dataset from AMC, and an AUC of 0.61 (95% CI 0.47–0.75) in the validation dataset from Maastro. Even though the 95% confidence interval contains 0.5 in the validation dataset, the risk groups based on the RF model demonstrate different survival curves, with a borderline significance (p = .053). In contrast, the second RF model based on clinical variables yielded an AUC of 0.63 (95% CI 0.54–0.71) in the training dataset and 0.62 (95% CI 0.49–0.76) in the validation dataset and did not demonstrate a significant difference between high and low-risk patients in terms of overall survival. From these results could be concluded that pretreatment CT radiomics features might contain additional prognostic information over clinical variables, which enables stratification into high-risk and low-risk patients. A similar result was observed previously by Aerts et al. [Citation11]. The prognostic performance of TNM-stage and tumor volume was lower than the performance of a radiomics-based model in both lung and head-and-neck cancer validation datasets.
In this specific study, the limited performance and validation of the clinical model might be explained by the selection criteria used. All patients included have undergone esophagectomy after nCRT, with comparable clinical parameters and baseline characteristics. Hence, based on their pretreatment clinical status, all patients were stratified into a similar stage and referred for the same treatment with curative intent. However, in the training dataset more patients with cM1a stage were included, whereas the average cN-stage in the validation dataset was slightly higher. Also the median overall survival rate of the Maastro patients was lower than the AMC patients. These differences in datasets might be caused by slightly different local treatment procedures or the difference in follow-up time. To have a better split in risk groups based on clinical parameters only, it could be useful to include patients with different, non-curative treatments as well.
Another limitation of the clinical RF model is the limited number of input variables used. As the main purpose of our study was to further explore the potential prognostic information captured in baseline CT-scans, the clinical analysis was mainly based on existing knowledge. In a study by Toxopeus et al. [Citation28], 11 clinical variables were considered to be potentially prognostic for pathological complete response after nCRT, which in turn is associated with better overall survival [Citation29,Citation30]. The final clinical nomogram trained in 381 esophageal cancer patients yielded a C-index of 0.64 after correction for optimism, based on only gender, T-stage, tumor type and differentiation grade. These variables were used as basis for our clinical RF model, although differentiation grade had to be excluded due to limited availability. In another study by Cao et al. [Citation31], a clinical nomogram based on 4109 esophageal cancer patients was developed to predict overall survival after esophagectomy. Their final nomogram included nine clinical variables and yielded a concordance-index (C-index), which is a similar measure as the AUC, of 0.72 in the training and 0.70 in the validation cohort. This is comparable to the performances observed in our radiomics RF model, which suggests that both imaging and clinical biomarkers contain valuable prognostic information in esophageal cancer patients.
As major pathological response is known to be associated with better overall survival [Citation29], it was not surprising that a similar trend was observed on our study. Interestingly, this pathological response was not significantly correlated with the risk-groups identified by the radiomics RF model, even though both the RF model and TRG were able to split survival curves in significantly different groups. The clinical RF model was significantly correlated to TRG in the training dataset. Why the latter was not observed in the validation dataset is difficult to clarify. Potentially the slight difference in baseline characteristics and local treatment guidelines might be one of the cause, as already mentioned above. Nevertheless, these results suggest that the radiomics features might contain useful prognostic information in addition to conventional clinical parameters.
The large confidence intervals observed in this study can have several causes. First, at 3-year follow-up time only 74 Maastro patients were available for analysis. Other patients that initially were available for analysis were either lost in follow-up or treated less than 3-year ago. The limited number of patients obviously increased the uncertainty margins. Furthermore, image acquisition and reconstruction settings were not homogeneous within and between the datasets, which is inherent to the retrospective design of the study. It is previously shown that this can have significant influence on the radiomics features extracted [Citation32,Citation33]. To minimize this influence, all scans were resampled to the same voxel size prior to analysis. However, more consistent imaging protocols or correction factors should be considered in future studies.
To move towards a more personalized treatment approach, medical experts should be able to consider multiple factors to select the best possible treatment for an individual patient. These factors include biology, pathology, proteomics [Citation34], genomics [Citation35] and imaging biomarkers [Citation36]. CDSS help to put all these factors into perspective based on prediction models and are developed to aid in decision making [Citation8,Citation9]. However, the current prediction models yielding a C-index or AUC no higher than 0.72 are not yet accurate enough. For instance, the radiomics-based model in this paper yielded an AUC of 0.69 in the training dataset, resulting in a specificity of 76% when using a cutoff value of 50% to divide the patients in risk groups. This means that 76% of the patients that did not survive 3-years after treatment were identified as ‘high-risk’ by the RF model. Consequently, 24% of these patients were not identified, which is not acceptable for treatment adaptation in clinical practice. To further improve model performance, the prognostic value of a combination of clinical and CT radiomic imaging features should be investigated in a large multicenter cohort study.
In addition to the limitations which are inherent to the retrospective design of this study, two important other aspects might have influenced our results. First, the primary tumor volumes used for feature extraction were manually delineated. Although these delineations were used for radiotherapy planning and were verified by a second radiation oncologist, previous studies have shown that semi-automatic tumor segmentation reduced inter-observer variability and therefore is more suitable for radiomics studies [Citation37,Citation38]. Second, we created a prognostic model for 3-year overall survival, which is not the only interesting outcome variable. For instance, postoperative mortality or complications, and pathological response after nCRT [Citation29,Citation30] might be other variables of interest for future studies.
In conclusion, we have developed and externally validated a RF model using pretreatment CT radiomics features to predict 3-year overall survival in esophageal cancer. In contrast to the RF model with only clinical variables, the radiomics-based model contained additional prognostic information to stratify patients into statistically significant risk-groups. To further improve the performance of the model, larger datasets and complementary clinical variables should be considered.
Supplemental Material
Download PDF (199.4 KB)Disclosure statement
Ralph Leijenaar is Chief Technology Officer of OncoRadiomics. Ralph Leijenaar and Philippe Lambin are co-inventors of several radiomics patents.
Additional information
Funding
Related Research Data
References
- Sjoquist KM, Burmeister BH, Smithers BM. Survival after neoadjuvant chemotherapy or chemoradiotherapy for resectable oesophageal carcinoma: an updated meta-analysis. Lancet Oncol. 2011;12:681–692.
- Mukherjee S, Nicholas C, Gwynne S, et al. NEOSCOPE: a randomised phase II study of induction chemotherapy followed by oxaliplatin/capecitabine or carboplatin/paclitaxel based pre-operative chemoradiation for resectable oesophageal adenocarcinoma. Eur J Cancer. 2017;74:38–46.
- van Hagen P, Hulshof MCCM, van Lanschot JJB, et al. Preoperative chemoradiotherapy for esophageal or junctional cancer. N Engl J Med. 2012;366:2074–2084.
- Shapiro J, van Lanschot JJB, Hulshof MCCM, et al. Neoadjuvant chemoradiotherapy plus surgery versus surgery alone for oesophageal or junctional cancer (CROSS): long-term results of a randomised controlled trial. Lancet Oncol. 2015;16:1090–1098.
- Lordick F, Mariette C, Haustermans K, et al. Oesophageal cancer: ESMO Clinical Practice Guidelines for diagnosis, treatment and follow-up. Ann Oncol. 2016;27:v50–v57.
- Noordman BJ, Shapiro J, Spaander MC, et al. Accuracy of detecting residual disease after CROSS neoadjuvant chemoradiotherapy for esophageal cancer (preSANO Trial): rationale and protocol. JMIR Res Protoc. 2015;4:e79.
- Lambin P, Zindler J, Vanneste B, et al. Modern clinical research: how rapid learning health care and cohort multiple randomised clinical trials complement traditional evidence based medicine. Acta Oncol. 2015;54:1289–1300.
- Lambin P, Zindler J, Vanneste BGL, et al. Decision support systems for personalized and participative radiation oncology. Adv Drug Deliv Rev. 2017;109:131–153.
- Lambin P, van Stiphout RGPM, Starmans MHW, et al. Predicting outcomes in radiation oncology - multifactorial decision support systems. Nat Rev Clin Oncol. 2013;10:27–40.
- Lambin P, Rios-Velazquez E, Leijenaar R, et al. Radiomics: extracting more information from medical images using advanced feature analysis. Eur J Cancer. 2012;48:441–446.
- Aerts HJWL, Velazquez ER, Leijenaar RTH, et al. Decoding tumour phenotype by noninvasive imaging using a quantitative radiomics approach. Nat Commun. 2014;5:4006.
- Leijenaar RTH, Carvalho S, Hoebers FJP, et al. External validation of a prognostic CT-based radiomic signature in oropharyngeal squamous cell carcinoma. Acta Oncol. 2015;54:1423–1429.
- Coroller TP, Grossmann P, Hou Y, et al. CT-based radiomic signature predicts distant metastasis in lung adenocarcinoma. Radiother Oncol. 2015;114:345–350.
- Ganeshan B, Skogen K, Pressney I, et al. Tumour heterogeneity in oesophageal cancer assessed by CT texture analysis: preliminary evidence of an association with tumour metabolism, stage, and survival. Clin Radiol. 2012;67:157–164.
- Yip C, Davnall F, Kozarski R, et al. Assessment of changes in tumor heterogeneity following neoadjuvant chemotherapy in primary esophageal cancer. Dis Esophagus. 2015;28:172–179.
- Yip C, Landau D, Kozarski R, et al. Primary esophageal cancer: heterogeneity as potential prognostic biomarker in patients treated with definitive chemotherapy and radiation therapy. Radiology 2014;270:141–148.
- Larue RTHM, van Timmeren JE, de Jong EEC, et al. Influence of grey level discretization on radiomic feature stability for different CT scanners, tube currents and slice thicknesses: a comprehensive phantom study. Acta Oncol. 2017;56:1544–1553.
- Haralick RM, Shanmugam K, Dinstein I. Textural features for image classification. IEEE Trans Syst Man Cybern. 1973;SMC-3:610–621.
- Thibault G, Angulo J, Meyer F. Advanced statistical matrices for texture characterization: application to cell classification. IEEE Trans Biomed Eng. 2014;61:630–637.
- Galloway MM. Texture analysis using gray level run lengths. Comput Graph Image Process. 1975;4:172–179.
- Thibault G, Fertil B, Navarro C. Texture indexes and gray level size zone matrix application to cell nuclei classification. 10th International Conference on Pattern Recognition and Information Processing; Minsk, Belarus; 2009; p. 140–145.
- Sun C, Wee WG. Neighboring grey level dependence matrix for texture classification. Comput Graph Image Process. 1983;23:341–352.
- Amadasun M, King R. Textural features corresponding to textural properties. IEEE Trans Syst Man Cybern. 1989;19:1264–1274.
- Lambin P, Leijenaar RTH, Deist TM, et al. Radiomics: the bridge between medical imaging and personalized medicine. Nat Rev Clin Oncol. 2017;14:749–762.
- Kuhn M. Building predictive models in R using the caret package. J Stat Soft. 2008;28: 1–26.
- Liaw A, Wiener M. Classification and regression by randomForest. R News. 2002;2:18–22.
- Mandard A-M, Dalibard F, Mandard J-C, et al. Pathologic assessment of tumor regression after preoperative chemoradiotherapy of eophageal carcinoma. Cancer. 1994;73:2680–2686.
- Toxopeus ELA, Nieboer D, Shapiro J, et al. Nomogram for predicting pathologically complete response after neoadjuvant chemoradiotherapy for oesophageal cancer. Radiother Oncol. 2015;115:392–398.
- Tomasello G, Petrelli F, Ghidini M, et al. Tumor regression grade and survival after neoadjuvant treatment in gastro-esophageal cancer: a meta-analysis of 17 published studies. Eur J Surg Oncol. 2017;43:1607–1616.
- Chao Y-K, Chuang W-Y, Chang H-K, et al. Prognosis of patients with esophageal squamous cell carcinoma who achieve major histopathological response after neoadjuvant chemoradiotherapy. Eur J Surg Oncol. 2017;43:234–239.
- Cao J, Yuan P, Wang L, et al. Clinical nomogram for predicting survival of esophageal cancer patients after esophagectomy. Sci Rep. 2016;6:26684.
- Mackin D, Fave X, Zhang L, et al. Measuring computed tomography scanner variability of radiomics features. Invest Radiol. 2015;50:757–765.
- Shafiq-ul-Hassan M, Zhang GG, Latifi K, et al. Intrinsic dependencies of CT radiomic features on voxel size and number of gray levels. Med Phys. 2017;44:1050–1062.
- Huang Z, Ma L, Huang C, et al. Proteomic profiling of human plasma for cancer biomarker discovery. Proteomics. 2017;17:1600240.
- The Cancer Genome Atlas Research Network. Integrated genomic characterization of oesophageal carcinoma. Nature. 2017;541:169–175.
- O’Connor JPB, Aboagye EO, Adams JE, et al. Imaging biomarker roadmap for cancer studies. Nat Rev Clin Oncol. 2017;14:169–186.
- Parmar C, Rios Velazquez E, Leijenaar R, et al. Robust radiomics feature quantification using semiautomatic volumetric segmentation. PLoS One. 2014;9:e102107.
- Leijenaar RTH, Carvalho S, Velazquez ER, et al. Stability of FDG-PET radiomics features: an integrated analysis of test-retest and inter-observer variability. Acta Oncol. 2013;52:1391–1397.