
Abstract
Background: Deep inspiration breath hold (DIBH) for radiotherapy of left-sided breast cancer patients can effectively move the heart away from the target and reduce the heart dose compared to treatments in free breathing. This study aims to investigate the positional reproducibility of heart edge (HE) and thoracic wall (TW) during repeated DIBHs.
Material and methods: At three occasions, 11 left-sided breast cancer patients were CT imaged during 6 minutes of repeated DIBHs with 60 cine CT series. The series were evenly distributed over three bed positions and for each bed position, the heart edge associated maximum heart distance (MHD) and thoracic wall-associated maximum lung distance (MLD) from a reference line were retrospectively analyzed. The high temporal resolution of the CT series enabled intrinsic heart movements to be resolved from breath hold variations. A body surface laser scanning system continuously extracted the thorax height and displayed it in a pair of goggles for patient feedback. To check for ‘fake-breathing’ movements, e.g. that the patient lifts its back from the couch to reach DIBH, the couch-to-spine distance was also measured in all CT series.
Results: The analysis was done for 1432 cine CTs captured during 292 breath holds. The DIBH moved the heart on average 15 mm in medial direction compared with free breathing. For the three bed positions studied, the mean value of the max range, across all patients, was between 11–13 mm for the MHD and 4–8 mm for the MLD. The MHD variation due to breath hold variation was twice as large as the MHD variation due to intrinsic heart movement. The couch-to-spine distance varied less than 3 mm for all fractions, i.e., no fake-breathing was discovered.
Conclusions: The heart edge and thoracic wall reproducibility was high in relation to the medial heart displacement induced by the DIBH.
Introduction
The aim in radiotherapy is to deliver a sufficient dose to the target volumes to inhibit cancer cell division while keeping the dose to the surrounding normal tissue as low as possible. For left-sided breast cancer patients, the closest organs-at-risk are the lung and the heart, and in particular the coronary arteries of the heart.
A link between dose and cardiovascular disease has been found in some studies [Citation1–3]. However, the link is ambiguous [Citation4] and Demirci et al. [Citation5] concluded that a follow-up time of more than 10 years is needed to see the increased incidence. Nevertheless, although the seriousness of heart exposure may not ever reach full clarity, good practice should aim at reducing the heart dose as far as reasonable.
For left-sided breast cancer radiotherapy, deep inspiration breath hold (DIBH) treatments can reduce the dose to the heart in a simple and effective way by increasing the distance between the heart and the treated breast. Since treatment delivery time is longer than the breath-hold time, the treatment is distributed over several DIBH periods with free-breathing in between. The breathing motion, and related breath hold levels, can be measured in several ways, e.g. through monitoring tidal volume with a spirometer [Citation6], monitoring a light reflecting box on the chest [Citation7], or patient contour monitoring by a surface scanning system [Citation8,Citation9]. In all methods, a patient-specific gating window must be defined prior or during the acquisition of the planning CT to give a reference for reproduction of the breath hold position.
Many treatment planning studies [Citation10–13] have shown a substantial heart dose reduction for left-sided breast cancer patients if the treatment is given in DIBH compared with free breathing. However, these studies were based on a single setup with a single breath hold and did not consider that the DIBH treatment normally is given in several breath-holds per fraction over several fractions. A few studies [Citation14,Citation15] have been done to investigate the inter-fractional variation, however none repeated the breath hold level more than once per occasion or measured the intrinsic heart movement.
There is a hypothetical risk that the variation in organ position might be higher for repeated DIBHs compared with free breathing, since the organ movement is greater in the preceding forced deep inspiration compared with the autonomic ventilation process in free breathing. Hence, this study aims to analyze and quantify the positional variations in Heart Edge (HE) and Thoracic wall (TW) for patients treated in DIBH.
Material and methods
Patient selection and imaging
Eleven patients with left-sided breast cancer were enrolled after ethical permission and informed consent. The mean age (range) of the included patients was 58 years (42–83 years). The patients were CT scanned (Philips Brilliance® CT Big Bore 16 slice, Philips, Andover, MA) at three occasions; in connection to the capture of the treatment planning CT (CT1), in the middle (CT2) and at the end of the treatment period (CT3).
Body surface laser scanning system
Concurrent to each CT acquisition, a body surface laser scanning (BSLS) system (Sentinel®, C-rad AB, Sweden) [Citation9] monitored the patient contour to track breathing motions. A research version of the BSLS software was used to track the vertical position (amplitude) of a thoracic point at a frequency of 3 Hz. To calculate the breathing amplitude of the thoracic point, the system illuminated the patient contour by a laser line at three discrete positions at the caudal edge of sternum (). The detection region was defined by a circle with radius of 2 cm and the amplitude data were automatically calculated by the BSLS software. The amplitude data were time stamped and stored in the BSLS computer for retrospective evaluation together with CT beam on-off status.
Figure 1. The patients wore video Googles for feedback. The height of a green bar visualized the amplitude of the thoracic point, a blue line visualized the baseline, i.e., the expiration phase in free breathing and a yellow rectangle visualized the gating window within which the top edge of the bar should be located during DIBH. The amplitude of the surface point was time stamped and stored in the BSLS computer together with CT beam-on events. Audial instructions were automatically given every 15 s from the BSLS system via loudspeakers.
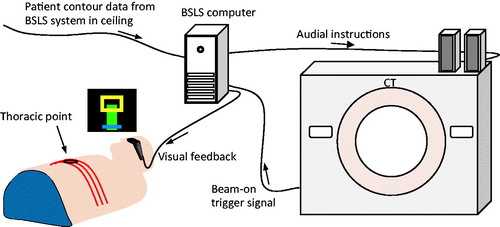
During the imaging sessions, the amplitude of the thoracic point was fed back to the patient as a green bar shown in video goggles worn by the patient (). The patients were instructed to keep the top of the bar within a yellow rectangle (gating window) during DIBH. A blue horizontal line at the bottom of the screen was used to illustrate the baseline, i.e., the amplitude level of the expiration phase for free breathing. However, the baseline was not actively used in the study. The BSLS software played prerecorded audial (voice) instructions through loudspeakers every 15th second to initiate breath hold and free breathing periods. The time between instructions was the same for all patients.
Patient setup
Respiratory training was performed in the CT room with the patient positioned in treatment position with their arms raised above their heads. Prior to the image acquisition, a four-step preparation session was performed. First, skin tattoos were created at the first imaging session (CT1) to facilitate re-alignment of the patient by use of room lasers. Second, the normal breathing baseline and amplitude were determined without any visual or audial feedback. Third, the patients were instructed to perform two to three DIBHs without feedback, with some seconds of free breathing in between, to set a comfortable breath hold level in relation to baseline (DIBH level). Fourth, the patient tested the audial and visual guidance for two-three minutes before the CT-image acquisitions started. In general, the DIBH level was set to be at least four times higher than the normal breathing amplitude. The chosen level was held constant throughout the imaging sessions and the gating window was set to be 3 mm for all patients except patients 4 and 5 who needed 4 mm.
CT imaging
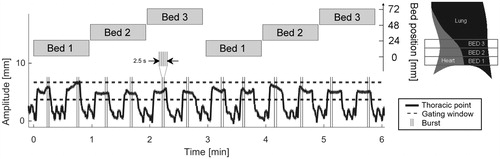
At each session, we acquired 60 cine CT series distributed over 6 min (12 DIBHs), i.e., the approximate time for a gated treatment delivery (). An imaging protocol originally intended for biopsy was used for each DIBH to acquire five (burst) consecutive high temporal cine CT series (each 16 × 1.5 mm slices) of the HE and TW regions. To overcome the limited CT beam width (24 mm), the images were acquired at three adjacent bed positions to cover 72 mm. The Bed 1 positions were at the diaphragm of the left lung and the Bed 2 and Bed 3 positions were located more cranially, i.e., typically where the heart is closest to the treatment fields. The start times for the bursts were randomized over the DIBH periods. The CT’s rotation time is 0.5 s (0.3 s exposure time followed by 0.2 s of delay time), hence each burst was acquired during 2.5 s. We used five exposures per burst to balance the probability of capturing all cardiac phases versus the constancy of the breath hold level during each burst. More explicit, too few exposures would underestimate the intrinsic heart movement and too many would compromise the assumption of constant breath hold level during each burst. Thus, the high temporal resolution and high acquisition frequency within each burst enabled the intrinsic heart movement to be separated from the breath hold variation.
Figure 2. Typical data acquisition pattern during one setup (patient 2, CT2). The amplitude of the thoracic surface point (black) is shown together with start and stop times for the 12 bursts (gray vertical lines). Each burst contained five exposures and the start time of each burst was randomly chosen within each DIBH period. Three different couch (bed) positions were imaged.
The CT series were acquired as 16 × 1.5 mm slices and typically, the middle slice was used for evaluation (frame). However, the evaluated slice number changed for CT2 and CT3 to compensate for cranial-caudal setup errors determined by manual spine registration.
Patient coordinate system
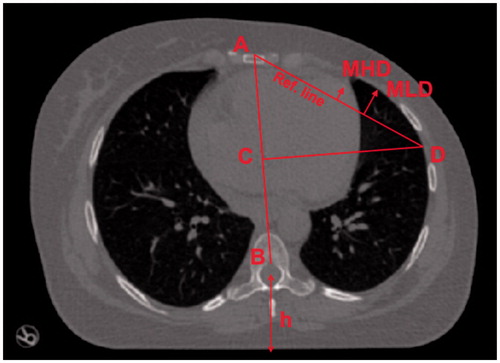
Since patient setup errors are beyond the scope of this work, the HE and TW are segmented and expressed in an anatomy related patient coordinate system influenced by Qi et al. [Citation16]. For each patient and bed position, see , the following was done to create the patient coordinate system: in the first frame in CT1, a line was drawn between the anterior part of medulla (B) and sternum (A). This line defines the anterior-posterior axis. In the same frame, a new line was drawn perpendicular to the AB line, starting at the center of the AB line (C), traversing the lung, and ending at the lateral edge of the left lung (D). The line between A and D was designated as the reference line. The reference line is roughly parallel to the actual treatment beam edges. To adjust for the setup error in CT2 and CT3 in relation to CT1, the B points were aligned (from CT2 to CT1 and from CT3 to CT1) and the coordinate systems rotated around B so that the AB-lines coincide (the length of the AB-line were never changed). One person defined the patient coordinate system and the potential systematic error introduced is regarded negligible.
Figure 3. For each bed position, a point B at the anterior part of the medulla was set as origin for an anatomical coordinate system. A corresponding point A at the anterior part of the sternum was defined to yield the anterior–posterior axis AB. Starting from the center of AB at C, a second line was constructed perpendicular to AB reaching the lateral edge of the left lung at D. The line AD was used as reference for scoring MHD (maximum heart distance) and MLD (maximum lung distance). The reference line is roughly parallel to the treatment beam edges motivating its use as reference for distance measurements. The spine-to-couch distance h was measured to quantify the number of cases when the patient lifted the back more than 3 mm, i.e., made ‘fake-breaths’.
Data analysis
The study contains three types of data analysis. First, the maximum heart distance [Citation16,Citation17] (MHD) and maximum lung distance (MLD) from the reference line was measured and analyzed per frame and bed position (). Second, gray-scale maps were created to visualize the cumulative positional distribution of the HE over time, from the reference line and outward towards the treated high dose region. Hence, these maps represent the relative number of times the heart covered a specific pixel. Third, the frequency of lifting the back from the CT couch was quantified, a.k.a. ‘fake-breathing’ [Citation18]. A fake breath was considered to occur if the distance between the couch top and the midpoint of the spinal cord () differed more than 3 mm in relation to first frame per CT session and bed.
In the first of the three data analysis methods, the variance and the range of the two measured values, MHD and MLD, were divided into three sub-groups; within-burst, between-burst, and total. More specifically, the within-burst variation describes the variation of the measured values around each burst mean; the between-burst variation describes the variation of burst means around the mean over all measured values for the patient (patient mean); and the total variation is the variation of the measured values around the patient mean (Appendix A).
The between-burst MHD variation is dependent on breath hold level variations and can potentially be reduced through measures implemented into the clinical workflow, e.g., patient practice, enhanced feedback tools, etc. On the contrary, the within-burst MHD variation is not possible to remove, since it comes solely from intrinsic heart movements (under the assumption that ECG triggered treatment delivery is not an option). A non-parametric Levene’s test [Citation18] (p < 0.05) was performed to test the equality of variances, i.e., to determine whether the between-burst variance was significantly different from the within-burst variance. The variances are put in relation to the average of the HE medial displacement, estimated from the anterior–posterior surview of the DIBH and a free breathing CT.
Due to technical issues with the used research version of the BSLS software, CT1 for patient 1 and CT3 for patient 4 were omitted. Patients 8 and 9 dropped out of the study after CT1 due to health issues. Furthermore, the thoracic point was placed on the left breast instead of on the caudal edge of sternum for patient 11 since the belly obscured part of the surface from the surface scanning system.
Results
Most of the acquired image and surface data (89%) could be used for analysis and quantification of the HE and TW positional variation. The rest of the acquired data (11%) were excluded, since the respiratory signal, used for patient feedback, was accidentally outside the gating window during acquisition. Thus, the results are based on 1432 CT exposures over 292 breath holds for 27 CT occasions. The medial displacement of the heart induced by the DIBH method was on average 15 mm (range 8–23 mm) compared to the free breathing. The mean DIBH level was 12 mm (range 5–24 mm).
The between-burst variation was significantly larger than the within-burst variation of both MHD and MLD for all bed positions (p< .05). This means that the major positional variations of both HE and TW stems from repeated breath holds and a minor contribution from intrinsic heart movement and non-stable TW position during breath hold. In , the variations in MHD and MLD are expressed in terms of one standard deviation together with the 95% confidence intervals (CI) in columns 1–3 and as the mean of the maximum range together with one standard deviation (1 SD) in columns 4–6.
Table 1. The variability of two measures; the maximum heart distance (MHD) and maximum lung distance (MLD), both in terms of pooled standard deviation across patients (pooled SD and 95% confidence interval, CI) and the mean value of all patients’ max range (range and standard deviation, SD).
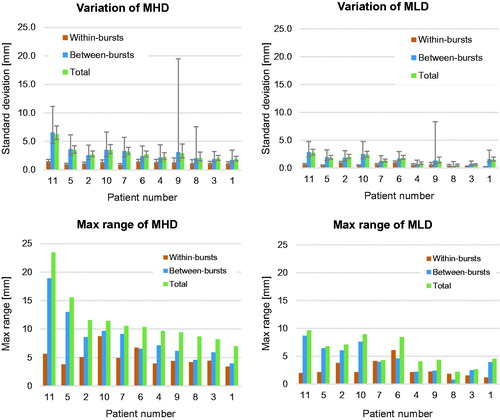
On the individual level, the variation of MHD and MLD was very similar across all bed positions and patients. The standard deviations and max range of MHD and MLD in Bed 2 are shown in .
Figure 4. Standard deviations (upper two panels) and max range (lower two panels) for MHD and MLD are given per patient. All data are for bed 2. Beds 1 and 3 had similar distributions. The patients are sorted according to descending Total MHD max range.
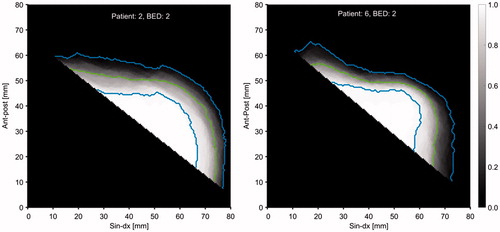
The cumulated HE distribution, laterally from the reference line, is visualized for patient 2 in and for patient 6 in . Patient 2 has larger HE variation compared to patient 6, especially in the anterior part where the radiosensitive [Citation1–3,Citation5]. Left Anterior Descending (LAD) coronary artery is located. The green line shows the 50% level, i.e., the boundary where the heart spends 50% of the time and the blue lines give the 5% and 95% levels.
Figure 5. Merged axial view of the HE distribution for all CT scans at bed 2 for patient 2 (left) and bed 2 for patient 6 (right). The gray scale gives the relative number of times the heart covered a specific pixel. The green lines give the 50% levels and the blue lines give the 5% and 95% levels.
The distance between the couch top and the midpoint of the spinal cord did not vary more than 3 mm during a CT session for any of the 1610 acquired frames (frames captured both when respiratory signal was within the gating window and when respiratory signal was outside the gating window), i.e., no ‘fake-breathing’ [Citation19] was detected.
Discussion
In this work, we investigated the reproducibility in HE and TW position during repeated DIBHs. A combination of more effort put into the patient practice procedure and better guidance aids might increase the reproducibility. However, the variation in the HE associated MHD was already small in relation to the medial heart displacement introduced by the DIBH. Furthermore, the small variation in MLD shows that the thoracic point constitutes a robust surrogate to the target volume. This is in line with the results presented by Betgen et al. [Citation20] where they studied 19 patients with 2D-flouroscopy and portal imaging.
By binning our MHD values to mimic 4DCT data, our results can be compared to the results presented by Qi et al. [Citation16], who studied the maximum MHD displacement from the mid-exhalation phase in 4DCT images acquired during free breathing. We conclude that MHD variation during DIBH is very similar in magnitude ( mm,
mm, and
mm) compared with the MHD variation during in free breathing (
mm,
mm, and
mm) for the caudal, middle, and cranial bed position, respectively.
Our MLD results were in line with the results presented by Lutz et al. [Citation21]. They imaged the chest wall of 58 left-sided breast cancer patients with continuously portal imaging every third treatment fraction and found an intra-field motion of 0.5 mm and inter-fractional setup error of 1.7 mm. Similar to our study, the breathing signal was visualized in a pair of goggles, to support breath hold level reproducibility. However, instead of a surface point, they used a marker box placed on the abdomen of the patient. Their intra-field motion (0.5 mm) can be compared with our within-burst MLD variation (0.5–0.6 mm) and their inter-fractional setup error (1.7 mm) can be compared with our between-burst MLD variation (1.3–2.1 mm). Although, we did not capture the extremes as they presented (up to 16.3 mm).
In Conroy et al. [Citation17], portal cine images were used to track both the heart position in terms of MHD and chest wall position. In contrast with our study, they did not present the variation in MHD, only the mean difference between planned and measured MHD. Nevertheless, the chest wall variation during a breath hold (96.8% less than 3 mm) was similar to our results.
Patient 11 was the only patient that demonstrated slightly inflated MHD variations. This might be due to the use of the special thoracic point position for this patient (left breast). Furthermore, patient 9 got large between-bursts confidence intervals, because she accidently kept her thoracic point height outside the gating window during one burst and then dropped out of the study after CT1 due to health issues, hence only three data points could be used for the between-burst determination. The same effect was seen for patient 8 which only had four data points for between-burst determination due to study dropout.
There were some spatial uncertainties regarding the monitored thoracic point but they were assumed to not affect the results. The monitored surface point had fixed room coordinates, which means that a small patient setup error in CT 2 and CT 3 caused a small positional change in the monitored point on the patient surface. However, this was considered negligible since the patient surface is rather flat around the measured positions. Furthermore, to keep a constant height between the baseline and the center of the gating-window from setup to setup, the DIBH level was adjusted in 4 of the 27 CT occasions (1–3 mm) for CT2 or CT3 (patients 1, 3, 7, and 11).
We did not study how the variations in HE and TW affects the treatment dose. However, based on the results presented by Qi et al., who extracted the correlation between heart mean dose and MHD distance, we can estimate the heart mean dose variation to be less than 1% of a typical prescription dose for a 3 mm MHD variation.
In the current research version of the surface scanning software, the feedback bar visualization updated slower than in the clinical used software. This can partly explain why some of the CT acquisitions (11%) were outside of the gating window. The patients might have adapted their breathing to the slowly updating feedback bar, so that the bar stayed within the gating window according to the audial instructions, but in reality, they entered it too early and left it too early. Nevertheless, the stored data in the log files were stored at 3 Hz and did not suffer from any of these delays.
We conclude that HE and TW reproducibility was high in relation to the medial heart displacement induced by the DIBH.
Ethical approval
The local ethics committee accepted the study on 13 May 2008 (D-no. SEK 08:23).
Supplemental Material
Download MS Word (62.9 KB)Disclosure statement
The research was partly sponsored by C-rad AB, Uppsala, Sweden.
Additional information
Funding
Related Research Data
References
- Darby SC, Ewertz M, McGale P, et al. Risk of ischemic heart disease in women after radiotherapy for breast cancer. N Engl J Med. 2013;368:987–998.
- Nilsson G, Holmberg L, Garmo H, et al. Distribution of coronary artery stenosis after radiation for breast cancer. J Clin Oncol. 2012;30:380–386.
- Correa CR, Litt HI, Hwang WT, et al. Coronary artery findings after left-sided compared with right-sided radiation treatment for early-stage breast cancer. JCO. 2007;25:3031–3037.
- Henson KE, McGale P, Taylor C, et al. Radiation-related mortality from heart disease and lung cancer more than 20 years after radiotherapy for breast cancer. Br J Cancer. 2013;108:179–182.
- Demirci S, Nam J, Hubbs JL, et al. Radiation-induced cardiac toxicity after therapy for breast cancer: interaction between treatment era and follow-up duration. Int. J Radiat Oncol Biol Phys. 2009;73:980–987.
- Wong JW, Sharpe MB, Jaffray DA, et al. The use of active breathing control (ABC) to reduce margin for breathing motion. Int J Radiat Oncol Biol Phys. 1999;44:911–919.
- Pedersen AN, Korreman S, Nystrom H, et al. Breathing adapted radiotherapy of breast cancer: reduction of cardiac and pulmonary doses using voluntary inspiration breath-hold. Radiother Oncol. 2004;72:53–60.
- Bert C, Metheany KG, Doppke K, et al. A phantom evaluation of a stereo-vision surface imaging system for radiotherapy patient setup. Med Phys. 2005;32:2753–2762.
- Brahme A, Nyman P, Skatt B. 4D laser camera for accurate patient positioning, collision avoidance, image fusion and adaptive approaches during diagnostic and therapeutic procedures. Med Phys. 2008;35:1670–1681.
- Wang X, Pan T, Pinnix C, et al. Cardiac motion during deep-inspiration breath-hold: implications for breast cancer radiotherapy. Int J Radiat Oncol Biol Phys. 2012;82:708–714.
- Hjelstuen MH, Mjaaland I, Vikstrom J, et al. Radiation during deep inspiration allows loco-regional treatment of left breast and axillary-, supraclavicular- and internal mammary lymph nodes without compromising target coverage or dose restrictions to organs at risk. Acta Oncol. 2012;51:333–344.
- Bedi C, Kron T, Willis D, et al. Comparison of radiotherapy treatment plans for left-sided breast cancer patients based on three- and four-dimensional computed tomography imaging. Clin Oncol (R Coll Radiol). 2011;23:601–607.
- Stranzl H, Zurl B. Postoperative irradiation of left-sided breast cancer patients and cardiac toxicity. Does deep inspiration breath-hold (DIBH) technique protect the heart? Strahlenther Onkol. 2008;184:354–358.
- Jagsi R, Moran JM, Kessler ML, et al. Respiratory motion of the heart and positional reproducibility under active breathing control. Int J Radiat Oncol Biol Phys. 2007;68:253–258.
- McIntosh A, Shoushtari AN, Benedict SH, et al. Quantifying the reproducibility of heart position during treatment and corresponding delivered heart dose in voluntary deep inhalation breath hold for left breast cancer patients treated with external beam radiotherapy. Int J Radiat Oncol Biol Phys. 2011;81:e569–e576.
- Qi XS, Hu A, Wang K, et al. Respiration induced heart motion and indications of gated delivery for left-sided breast irradiation. Int J Radiat Oncol Biol Phys. 2012;82:1605–1611.
- Conroy L, Yeung R, Watt E, et al. Evaluation of target and cardiac position during visually monitored deep inspiration breath-hold for breast radiotherapy. J Appl Clin Med Phys. 2016;17:25.
- Nordstokke DW, Zumbo BD. A new nonparametric Levene test for equal variances. Psicológica. 2010;31:401–430.
- Maria Duvaldt AH, Samuel F, et al. Analysis of Respiratory Gating in Radiation Therapy. http://www.sjukhusfysiker.se/sites/default/files/documents/nationellt_mote_2014_abstractbok.pdf. 2014 [cited 2014Nov 12].
- Betgen A, Alderliesten T, Sonke JJ, et al. Assessment of set-up variability during deep inspiration breath hold radiotherapy for breast cancer patients by 3D-surface imaging. Radiother Oncol. 2013;106:225–230.
- Lutz CM, Poulsen PR, Fledelius W, et al. Setup error and motion during deep inspiration breath-hold breast radiotherapy measured with continuous portal imaging. Acta Oncol. 2016;55:193–200.
Appendix A
A patient´s is assumed vary due to two independent effects: breath hold variations and intrinsic heart movements. By this assumption, the sum of breath hold associated heart edge displacements,
, and the intrinsic heart movement associated heart edge displacements,
equals the total heart edge displacement from a patient’s
mean for all occasions. Since each burst is acquired during a short period of time (2.5 s),
is the major contributor to the
variation within a burst. Each burst mean equals
and is the sum of all effects that influence the heart position except intrinsic heart movements, i.e., different combinations of diaphragm and thorax expansions. Both
and
are orthogonal to the reference line (AD-line) and both can be positive or negative.
To achieve a high precision estimate of the general heart edge variance in the population, the mean of the heart edge variance over all patients was calculated and reported as the pooled standard deviation. For a single bed position, the , measured in frame
at burst
for patient
, is denoted as
, where
runs over the bursts belonging to the bed position of interest. The mean
for burst
and patient
, i.e.
, is given by
(1)
where
is the number of frames containing data for patient
in burst
. The mean
for patient
is then given by
(2)
where
represents the total number of bursts for patient
. Normally,
equals 12 (four bursts per bed position in three CT sessions) and
equals 5 although exceptions occur. The number of frames for all patients equals
, where
patients.
With this notation, we can express the estimate of the total variance of for a bed position including all patients through
(3)
As we assume this variation in to be composed of the independent variations of
and
(4)
where
(5)
is within-burst associated pooled standard deviation of
, and
(6)
is the between-burst associated pooled standard deviation of
. In a similar manner, the
was calculated for the thoracic wall.