
 ?Mathematical formulae have been encoded as MathML and are displayed in this HTML version using MathJax in order to improve their display. Uncheck the box to turn MathJax off. This feature requires Javascript. Click on a formula to zoom.
Abstract
Purpose: We evaluated the feasibility of using an automatic segmentation tool to delineate cardiac substructures from noncontrast computed tomography (CT) images for cardiac dosimetry and toxicity analyses for patients with nonsmall cell lung cancer (NSCLC) after radiotherapy.
Material and methods: We used an in-house developed multi-atlas segmentation tool to delineate 11cardiac substructures, including the whole heart, four heart chambers, and six greater vessels, automatically from the averaged 4D-CT planning images of 49 patients with NSCLC. Two experienced radiation oncologists edited the auto-segmented contours. Times for automatic segmentation and modification were recorded. The modified contours were compared with the auto-segmented contours in terms of Dice similarity coefficient (DSC) and mean surface distance (MSD) to evaluate the extent of modification. Differences in dose–volume histogram (DVH) characteristics were also evaluated for the modified versus auto-segmented contours.
Results: The mean automatic segmentation time for all 11 structures was 7–9 min. For the 49 patients, the mean DSC values (±SD) ranged from .73 ± .08 to .95 ± .04, and the mean MSD values ranged from 1.3 ± .6 mm to 2.9 ± 5.1 mm. Overall, the modifications were small; the largest modifications were in the pulmonary vein and the inferior vena cava. The heart V30 (volume receiving dose ≥30 Gy) and the mean dose to the whole heart and the four heart chambers were not different for the modified versus the auto-segmented contours based on the statistically significant condition of p < .05. Also, the maximum dose to the great vessels was no different except for the pulmonary vein.
Conclusions: Automatic segmentation of cardiac substructures did not require substantial modifications. Dosimetric evaluation showed no significant difference between the auto-segmented and modified contours for most structures, which suggests that the auto-segmented contours can be used to study cardiac dose–responses in clinical practice.
Introduction
Modern radiotherapy techniques such as intensity-modulated radiation therapy (IMRT) and combinations of those techniques with chemotherapy have greatly increased overall survival times for patients with nonsmall cell lung cancer (NSCLC) [Citation1,Citation2]. However, these improvements come with increased risks of radiation-induced cardiac toxicity and mortality [Citation3,Citation4]. A recent phase III study showed that some dosimetric parameters in heart dose volume histogram are important predictors of survival in NSCLC [Citation5]. Another study found that heart dose could explain part of the decline in overall survival and quality of life for patients with NSCLC [Citation6]. Although heart dose is an important factor in overall survival, to date substantial variability in heart contouring has called for a secondary analysis of heart dose volume effects using recontoured consistent heart structures including pericardium, atria, and ventricles [Citation5]. A large number of patients including heart delineations are needed to make sensible estimates of heart toxicity, which is typically only possible using auto-delineation since the time needed to delineate all parts of the heart for a large amount of patients would be extreme. In addition, heart exposure is associated with a broad spectrum of cardiac toxicity depending on the extent of damage to various heart substructures [Citation4]. Determining the relationship between heart dose and cardiac toxicity requires ways of consistently and accurately generating contours for cardiac substructures.
A few studies have been reported on the use of automatic segmentation of cardiac substructures [Citation7,Citation8]. In our previous study, we used a set of cardiac atlases with multi-atlas segmentation to automatically contour 11 cardiac substructures. We performed a full validation of the segmentation approach and showed that automatic-segmentation contouring was within one standard deviation of the variability of manual contouring by experts [Citation9]. Even though, auto-segmented contours could still need modification by clinical specialists to conform to the corresponding anatomy; however, whether modification is needed when auto-segmented contours are used for dosimetric analysis is unknown. Here we evaluated the extent of the modification needed for auto-segmented cardiac substructures and whether those modifications would influence dosimetric variables in clinical practice.
Material and methods
Patient data
The appropriate institutional review board approved this study. Forty-nine patients with locally advanced, inoperable NSCLC who had been treated with IMRT or passive scattering proton beam therapy to a dose of 74 Gy in 37 fractions in a randomized clinical trial were retrospectively selected, and their treatment plans, including simulation CT scans and dose distribution, were extracted from an institutional database. All simulations were done with 4D-CT at a resolution of 1 mm × 1 mm × 2.5 mm. The averaged 4D-CT scans were used for automatic segmentation of cardiac substructures. Patients with collapsed lungs owing to extensive disease were excluded, and only those patients receiving substantial heart dose were included.
Multi-atlas segmentation
We used in-house developed software, the multi-atlas contouring service (MACS), for multi-atlas segmentation [Citation9]. The MACS performs segmentation in the following steps. First, deformable image registration for each atlas and the image to be segmented was done with a dual-force Demons registration algorithm [Citation10]. The resultant individual deformation vector fields were then used to deform the contours in each atlas to obtain individual segmentations of a structure [Citation11]. Finally, a modified simultaneous truth and performance level estimation (STAPLE) algorithm with a built-in tissue appearance model [Citation12,Citation13] was used to combine individual segmentations. This contour fusion minimizes variations among segmentations obtained from different atlases and generates a fusion contour that approximates the true segmentation.
A total of 12 cardiac atlases were used for MACS, for the following 11 cardiac substructures: the whole heart, the 4 heart chambers including left atrium (LA), left ventricle (LV), right atrium (RA), and right ventricle (RV), and the 6 great vessels (the ascending aorta [AA], descending aorta [DA], superior vena cava [SVC], inferior vena cava [IVC], pulmonary artery [PA], and pulmonary vein [PV]). The MACS was used to delineate the 11 cardiac substructures automatically for the 49 NSCLC patients. The auto-segmented contours were then modified jointly by two experienced radiation oncologists who followed the contouring guidelines from RTOG 1106 [Citation14] and a published consensus guideline on cardiac atlas contouring [Citation15].
Geometric evaluation
To quantitatively evaluate the geometric agreement between the modified and auto-segmented contours, we calculated the Dice similarity coefficient (DSC) and the mean surface distance (MSD). For two contours A and B, the DSC quantifies the percentage volume that overlaps between the two contours [Citation16]:
where
and
represent the volumes of the structures and
is the volume of intersection. The DSC has a value between 0 and 1, with 1 indicating perfect agreement and 0 indicating no overlap. The MSD is the average distance between corresponding points on the surfaces of volumes A and B and is defined as [Citation17]:
where
and
represent points on the surfaces of volumes A and B, and
is the Euclidean distance between points
and
. A smaller MSD indicates better agreement between A and B.
Dosimetric evaluation
Dose–volume histograms (DVHs) were generated for both the auto-segmented and modified contours for each cardiac substructure. Representative metrics evaluated included the mean dose (Dmean) to the heart and its four chambers; the heart V30 (heart volume receiving dose ≥30 Gy); and the maximum dose (Dmax) to all six great vessels. We performed hypothesis testing to identify statistically significant differences between auto-segmented contours and modified contours in terms of dosimetric variables. We used paired Student’s t tests for normally distributed data and Wilcoxon signed rank tests for non-normally distributed data. All analyses were done with SPSS version 17.0 (SPSS, Chicago, IL). p values of <.05 was considered to indicate statistically significant differences.
Subjective evaluation
The MACS has been used in our routine clinic to automatically delineate the cardiac substructures since May 2016. To further validate its clinical usability, we randomly selected 20 thoracic patients planned between May 2016 and March 2017 with auto-segmented contours of cardiac substructures. A thoracic radiation oncologist reviewed and rated the auto-segmented contours using a four-point scale: 0, terrible – starting from scratch preferred; 1, fair – major edits needed; 2, good – minor edits needed; and 3, perfect. A score with 2 or 3 is considered as clinically acceptable.
Results
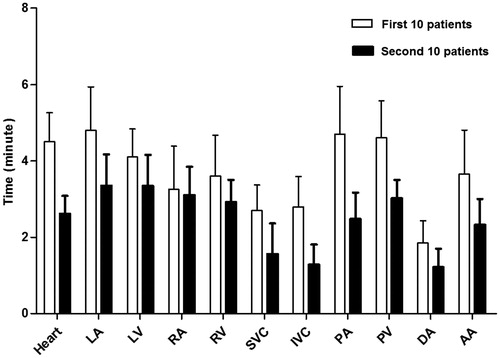
The mean time for the MACS to automatically delineate the 11 cardiac substructures was 10 min per patient. The time (mean ± SD) to modify the contours of all 11 cardiac substructures was 40.2 ± 4.24 min for the first 10 patients and 27.2 ± 3.50 min for the second 10 patients (); in order to record the time for modifying each structure, the radiation oncologists were specifically instructed to modify one structure at a time for these 20 patients. By comparison, contouring from scratch would take several hours. The time needed to modify the contours of the various structures declined as the radiation oncologists who were doing the modifying became more familiar with using the contour editing software.
Figure 1. Average time needed to modify contours of 11 cardiac substructures per patient for the first 10 patients (clear bars) and for the second 10 patients (solid bars). Error bars represent one standard deviation. LA: left atrium; LV: left ventricle; RA: right atrium; RV: right ventricle; SVC: superior vena cava; IVC: inferior vena cava; PA: pulmonary artery; PV: pulmonary vein; DA: descending aorta; AA: ascending aorta.
Examples of the extent of overlap between auto-segmented and modified structures for two patients are illustrated in , and the DVH comparisons for the same two patients are shown in . shows the best geometric overlap of all patients; in contrast, shows the worst geometric overlap, particularly for PA and PV. Overall, the dosimetric difference was small for both cases. Most of the difference was observed at the junction of two structures, as exemplified by that between IVC/SVC and RA in .
Figure 2. Comparison of auto-segmented contours (solid lines) and modified contours (colorwash) for patients (a) and (b) in the axial, sagittal and coronal views. LA: left atrium; LV: left ventricle; RA: right atrium; RV: right ventricle; SVC: superior vena cava; IVC: inferior vena cava; PA: pulmonary artery; PV: pulmonary vein; DA: descending aorta; AA: ascending aorta.
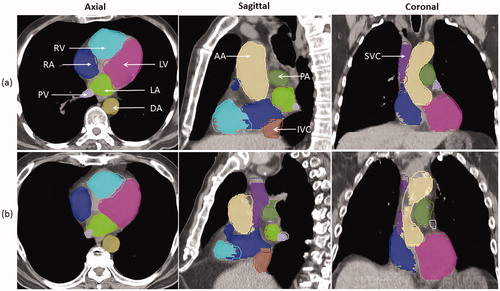
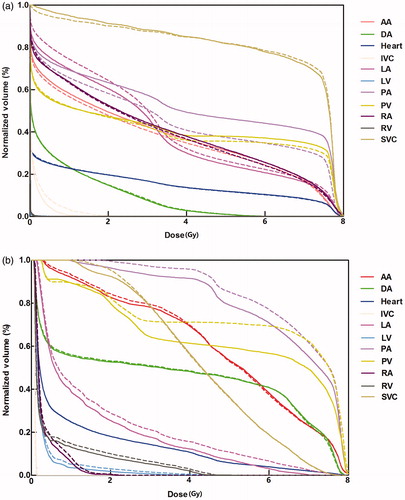
Figure 3. Dose-volume histogram analyses of modified contours (solid lines) are compared with auto-segmented contours (dotted lines) for the two patients (a) and (b) shown in Figure 2. Both patients were treated with passive scattering proton beam therapy. LA: left atrium; LV: left ventricle; RA, right atrium; RV: right ventricle; SVC: superior vena cava; IVC: inferior vena cava; PA: pulmonary artery; PV: pulmonary vein; DA: descending aorta; AA: ascending aorta.
Geometric overlap between the modified and the auto-segmented contours for the 49 patients, quantified in terms of DSC and MSD, are shown in . Of the 11 structures, the average DSC values ranged from 0.73 ± 0.08 to 0.95 ± 0.04, and the average MSD values ranged from 1.3 ± 0.6 to 2.9 ± 5.1 mm for all 49 patients. Overall, the mean DSC for all of these structures was >0.7, indicating that no substantial modification were needed for the auto-segmented contours. However, we indeed observed some outliers. There were three patients showing large differences between modified and auto-segmented contours for one or more cardiac substructures. We reported the range of DSC and MSD for data within the 95% confidence interval of MSD in by excluding the outliers. Among the 11 structures, the pulmonary vein and inferior vena cava had lower DSC values (0.73 ± 0.08 and 0.78 ± 0.15), and higher MSD values (2.0±.7 mm and 2.9 ± 5.1 mm), than other structures, suggesting that contours for these two structures needed more modification than did the contours for the other structures.
Table 1. Comparison of modified contours versus auto-segmented contours of 11 cardiac substructures.
Finally, to investigate whether the auto-segmented contours could be used to study the cardiac dose–response directly in clinical practice, we evaluated dosimetric differences between the modified and auto-segmented contours for the 49 patients. The DVH of the 11 cardiac substructures were calculated from the original dose distribution on the clinical treatment plan. Dosimetric variables are compared in . For all patients, the heart V30 and mean dose to the entire heart and the four heart chambers did not show statistically significant difference for modified versus auto-segmented contours. The maximum dose to the great vessels also did not show statistically significant difference for the modified versus auto-segmented contours, except for the pulmonary vein (modified 78.11 ± 13.24 Gy, auto-segmented 76.44 ± 14.23 Gy, p = .01).
Table 2. Dosimetric comparability of modified contours versus auto-segmented contours.
The MACS was used in our routine clinic to automatically delineate the cardiac substructures for about 750 patients between May 2016 and March 2017. Clinicians reviewed and edited the auto-segmented contours if necessary and used them for treatment planning and evaluation. The physician rating of the auto-segmented contours for selected 20 thoracic patients was shown in the Supplementary Table S1. Of these rating scores, 95% of the auto-segmented contours received a score of 2 or 3 and only one was scored 0. It shows that most of the auto-segmented contours were clinically acceptable and could be used for subsequent treatment planning and dosimetric analysis.
Discussion
The risk of radiation-related cardiac toxicity is an important issue in radiotherapy for breast cancer, Hodgkin lymphoma, and lung cancer, among others. However, little has been reported on the relationship between cardiac toxicity and radiation dose–volumes for heart, and even less for the specific cardiac substructures. This probably reflects the inability to delineate those structures efficiently on treatment planning images. In addition, substantial variability in heart contouring has been reported in NSCLC [Citation5] and could affect the validity of dosimetric analyses of cardiac toxicity. In this study, two radiation oncologists jointly modified contours in order to reduce the impact from inter-observer variability. A previous study [Citation9] suggested that variability in automatic segmentation was at least comparable to inter-observer variability in manual delineation of cardiac substructures, suggesting that automatic segmentation might be useful for cardiac dose–volume analysis. In this study, we further evaluated the dosimetric implications of automatic segmentation and found that modification of the auto-segmented contours had little effect on the dose–volume response, which suggests that using automatic segmentation may be feasible for dose–volume response studies.
We found good agreement between the modified and auto-segmented contours, implying that no substantial modifications were needed for the auto-segmented contours. Among the contoured structures we evaluated, the pulmonary vein and inferior vena cava showed less agreement than others, mainly because of their relatively small volumes and indistinguishable anatomical boundaries on the CT images, and thus modifications are likely to be needed for these types of structures. Other studies have shown similar findings [Citation18,Citation19]. In addition, auto-segmenting these structures has several specific challenges. First, the junction between the inferior vena cava and the right atrium is difficult to contour because of the lack of distinct contrast between them; in our study, modifications had be made to correct part of the inferior vena cava to be the right atrium. Second, the complex anatomic shape of the pulmonary vein makes automatic segmentation difficult. Third, we noticed that pulmonary veins were susceptible to tumor invasion for some patients, which can cause segmentation errors. Therefore, one would expect more modifications for these two structures.
Geometric evaluations are generally not directly interpretable in clinical settings. Rather, the dose–volume response is often compared with clinical outcomes in analyses of radiation-induced toxicity [Citation20]. Traditionally, the parameters of mean dose and the volume receiving a certain amount of dose are used to evaluate the heart and chamber doses, and the parameter of maximum dose is used to evaluate the dose to the great vessels. We found no statistically significant differences between the modified and the auto-segmented contours, except for the pulmonary vein (p = .01). This finding implies that small geometric differences between auto-segmented and modified contours have negligible effects on dosimetry. On the other hand, previous studies have found the whole heart; heart chambers including endocardium, myocardium, and epicardium; and coronary arteries to be the most important substructures related to radiation-induced cardiac toxicity, but the pulmonary vein did not show direct correlation with cardiac toxicity [Citation4,Citation21]. Thus, our results presumably suggest that auto-segmented contours can be used directly for studying cardiac dose–response, although the pulmonary artery or pulmonary vein may need some minor modifications for some individuals. Indeed, this auto-segmentation tool can be used to quickly evaluate dose–volume response for patients undergoing radiotherapy and would be desirable for quality assurance in multi-institutional trials or large population-based dosimetric studies.
Our study had some limitations. First, our automatic segmentation did not include coronary arteries. Coronary arteries have complex anatomic shapes and very small volumes. Their location relative to nearby structures on the CT images varies from patient to patient, which creates difficulties for atlas-based automatic segmentation such as the MACS used in our study. In addition, coronary arteries are essentially invisible on the conventional CT images, which creates difficulties even for clinical experts to correctly identify them and manually edit the contours. Coronary angiography CT can visualize the coronary arteries and has been used to evaluate dose response for patients with breast cancer [Citation22]. Delineation of coronary arteries may require fusing the angiographic image to CT images and then creating an atlas from the fused images for automatic segmentation. Another shortcoming of the current study was that the contours were delineated on the averaged 4DCT image, and so the automatic segmentation essentially did not account for cardiac or respiratory motion. Rather, the delineated contours represent the most likely location of each structure instead of the exact anatomic boundary. However, treatment delivery involves cardiac and respiratory motion; the radiation dose during each treatment fraction is delivered during many cardiac or respiratory cycles, and thus the dose is “blurred” by the movement during treatment delivery. For this reason, averaged 4DCT images are preferred for dose calculation, and the cardiac structures should be delineated on those averaged CT images as well. Third, the cardiac substructure contours were modified by radiation oncologists only. It is possible to further improve the modified contours if a radiologist is involved in this study. Finally, even though our results did not show statistically significant differences in dosimetric variables between the modified and auto-segmented contours, the individual difference could still be large for some patients. In order to evaluate their clinical acceptability the individual numbers should be compared to those that could impact the clinical decision for the individual treatment plan. In addition, we cannot know whether small systematic (nonsignificant) differences would translate to no differences in actual toxicity outcomes. Further study of outcomes, with longer follow-up, is necessary. In addition, we only measured a few dosimetric variables that were representative metrics in evaluating the cardiac dose. New dosimetric variables may be found useful in the future. However, the feasibility of directly using automatic segmentation for cardiac dose response study should be reevaluated for the new dosimetric variables.
Conclusions
To conclude, automatic segmentation of cardiac substructures did not require substantial modifications, and dosimetric evaluation showed no statistically significant differences between the auto-segmented and modified contours except for the pulmonary vein. These findings suggest that using auto-segmented contours to study cardiac dose–response is feasible in current clinical practice, though reevaluation may need for new dosimetric variables in future cardiac dose response studies.
Supplemental Material
Download MS Word (15.4 KB)Acknowledgments
The authors would like to thank Christine Wogan from the Department of Radiation Oncology Research for reviewing the manuscript.
Disclosure statement
No potential conflict of interest was reported by the authors.
Additional information
Funding
Related Research Data
References
- Jegadeesh N, Liu Y, Gillespie T, et al. Evaluating intensity-modulated radiation therapy in locally advanced non-small-cell lung cancer: results from the National Cancer Data Base. Clin Lung Cancer. 2016;17:398–405.
- Sura S, Gupta V, Yorke E, et al. Intensity-modulated radiation therapy (IMRT) for inoperable non-small cell lung cancer: the Memorial Sloan-Kettering Cancer Center (MSKCC) experience. Radiother Oncol. 2008;87:17–23.
- Hardy D, Liu CC, Cormier JN, et al. Cardiac toxicity in association with chemotherapy and radiation therapy in a large cohort of older patients with non-small-cell lung cancer. Ann Oncol. 2010;21:1825–1833.
- Darby SC, Cutter DJ, Boerma M, et al. Radiation-related heart disease: current knowledge and future prospects. Int J Radiat Oncol Biol Phys. 2010;76:656–665.
- Bradley JD, Paulus R, Komaki R, et al. Standard-dose versus high-dose conformal radiotherapy with concurrent and consolidation carboplatin plus paclitaxel with or without cetuximab for patients with stage IIIA or IIIB non-small-cell lung cancer (RTOG 0617): a randomised, two-by-two factorial phase 3 study. Lancet Oncol. 2015;16:187–199.
- Movsas B, Hu C, Sloan J, et al. Quality of life analysis of a radiation dose-escalation study of patients with non-small-cell lung cancer: a secondary analysis of the radiation therapy. JAMA Oncol. 2016;2:359–367.
- Weiss E, Wijesooriya K, Ramakrishnan V, et al. Comparison of intensity-modulated radiotherapy planning based on manual and automatically generated contours using deformable image registration in four-dimensional computed tomography of lung cancer patients. Int J Radiat Oncol Biol Phys. 2008;70:572–581.
- Lorenzen EL, Ewertz M, Brink C. Automatic segmentation of the heart in radiotherapy for breast cancer. Acta Oncol. 2014;53:1366–1372.
- Zhou R, Liao Z, Pan T, et al. Cardiac atlas development and validation for automatic segmentation of cardiac substructures. Radiother Oncol. 2017;122:66–71.
- Wang H, Dong L, Lii MF, et al. Implementation and validation of a three-dimensional deformable registration algorithm for targeted prostate cancer radiotherapy. Int J Radiat Oncol Biol Phys. 2005;61:725–735.
- Yang J, Zhang Y, Zhang L, et al. Automatic segmentation of parotids from CT scans using multiple atlases. Medical Image Analysis for the Clinic: A Grand Challenge. 2010;323–330.
- Yang J, Garden A, Zhang Y, et al. WE-E-213CD-09: multi-atlas fusion using a tissue appearance model. Med Phys. 2012;39:3961.
- Yang J, Haas B, Fang R, et al. Atlas ranking and selection for automatic segmentation of the esophagus from CT scans. Phys Med Biol. 2017;62:9140–9158.
- Kong F, Quint L, Machtay M, et al. Atlases for organs at risk (OARs) in thoracic radiation therapy [cited 2018 Sep 24]. Available from: https://www.rtog.org/LinkClick.aspx?fileticket=qlz0qMZXfQs%3d&tabid=36
- Feng M, Moran JM, Koelling T, et al. Development and validation of a heart atlas to study cardiac exposure to radiation following treatment for breast cancer. Int J Radiat Oncol Biol Phys. 2011;79:10–18.
- Dice LR. Measures of the amount of ecologic association between species. Ecology. 1945;26:297–302.
- Korsager AS, Fortunati V, van der Lijn F, et al. The use of atlas registration and graph cuts for prostate segmentation in magnetic resonance images. Med Phys. 2015;42:1614–1624.
- Isambert A, Dhermain F, Bidault F, et al. Evaluation of an atlas-based automatic segmentation software for the delineation of brain organs at risk in a radiation therapy clinical context. Radiother Oncol. 2008;87:93–99.
- Anders LC, Stieler F, Siebenlist K, et al. Performance of an atlas-based autosegmentation software for delineation of target volumes for radiotherapy of breast and anorectal cancer. Radiother Oncol. 2012;102:68–73.
- Voet PW, Dirkx ML, Teguh DN, et al. Does atlas-based autosegmentation of neck levels require subsequent manual contour editing to avoid risk of severe target underdosage? A dosimetric analysis. Radiother Oncol. 2011;98:373–377.
- Taunk NK, Haffty BG, Kostis JB, et al. Radiation-induced heart disease: pathologic abnormalities and putative mechanisms. Front Oncol. 2015;5:39.
- Fan L-L, Luo Y-K, Xu J-H, et al. A dosimetry study precisely outlining the heart substructure of left breast cancer patients using intensity-modulated radiation therapy. J Appl Clin Med Phys. 2014;15:265.