
 ?Mathematical formulae have been encoded as MathML and are displayed in this HTML version using MathJax in order to improve their display. Uncheck the box to turn MathJax off. This feature requires Javascript. Click on a formula to zoom.
Abstract
Background: In this study, a deep convolutional neural network (CNN)-based automatic segmentation technique was applied to multiple organs at risk (OARs) depicted in computed tomography (CT) images of lung cancer patients, and the results were compared with those generated through atlas-based automatic segmentation.
Materials and methods: An encoder-decoder U-Net neural network was produced. The trained deep CNN performed the automatic segmentation of CT images for 36 cases of lung cancer. The Dice similarity coefficient (DSC), the mean surface distance (MSD) and the 95% Hausdorff distance (95% HD) were calculated, with manual segmentation results used as the standard, and were compared with the results obtained through atlas-based segmentation.
Results: For the heart, lungs and liver, both the deep CNN-based and atlas-based techniques performed satisfactorily (average values: 0.87 < DSC < 0.95, 1.8 mm < MSD < 3.8 mm, 7.9 mm < 95% HD <11 mm). For the spinal cord and the oesophagus, the two methods had statistically significant differences. For the atlas-based technique, the average values were 0.54 < DSC < 0.71, 2.6 mm < MSD < 3.1 mm and 9.4 mm < 95% HD <12 mm. For the deep CNN-based technique, the average values were 0.71 < DSC < 0.79, 1.2 mm < MSD <2.2 mm and 4.0 mm < 95% HD < 7.9 mm.
Conclusion: Our results showed that automatic segmentation based on a deep convolutional neural network enabled us to complete automatic segmentation tasks rapidly. Deep convolutional neural networks can be satisfactorily adapted to segment OARs during radiation treatment planning for lung cancer patients.
Introduction
Lung cancer is one of the world’s most common and fatal cancers, and radiation therapy is a key treatment [Citation1,Citation2], particularly for patients who have reached advanced stages III and IV. It is often impossible to perform surgical resection because of the wide range of tumour metastases or poor patient health at the time of diagnosis [Citation3]. The success of radiation therapy relies on the accurate irradiation of the tumour region while carefully protecting normal tissues, especially in the case of stereotactic ablative body radiotherapy (SABR) [Citation4,Citation5] to avoid the complications that arise during hypofractionation therapy [Citation6–9]. Therefore, when developing a treatment plan, it is necessary to segment and adequately protect the organs at risk (OARs).
The segmentation of OARs is time-consuming and tedious. Performing a preliminary segmentation of OARs by using an automatic segmentation technique can not only shorten the time needed for manual segmentation (usually hours) to minutes but also allow doctors to spend more time on further manually improving the segmentation accuracy based on the automatic segmentation results [Citation10,Citation11]. Currently, the most commonly used automatic segmentation method in clinical routine/practice is an atlas-based technique [Citation10–12], and three commercial programs, namely, ABAS (CMS-Elekta, Stockholm, Sweden), MIM (MIMVista Corp, Cleveland, Ohio), and VelocityAI (Velocity Medical Systems, Atlanta, Georgia), employ atlas-based automatic segmentation [Citation13].
Atlas-based automatic segmentation uses a reference image as an atlas, in which the structures of interest are already segmented. The optimal transformation map between the atlas and the new test image is obtained [Citation14–16]. Auto-segmentation is then performed by mapping the atlas segmentation to the new test image based on the obtained transformation map. Two important factors affect the outcome of the atlas-based automatic segmentation. One is the choice of the deformation registration algorithm used; a robust algorithm can have a substantial effect on the result because of the presence of image noise and interference arising from contrast changes [Citation17]. The second factor is the choice of the reference atlas. When using automatic segmentation methods based on a single atlas, the choice of atlas directly affects the outcome of the automatic segmentation procedure [Citation18]. In multi-atlas automatic segmentation, multiple atlases are selected from a database to register the test image, and the registrations are scored to obtain a final result [Citation19]. This method can improve the robustness of the result, but multiple registrations require more computational time, and the structural details of the patient’s anatomy may not be presented with sufficient sensitivity [Citation16,Citation20].
Owing to the recent and rapid development of deep learning, especially the high accuracy of deep convolutional neural networks (CNNs) in computer vision, image recognition and feature extraction [Citation21,Citation22], neural networks are starting to be used for the auxiliary diagnosis of medical images and for tumour and OAR segmentation. Cha et al. developed a deep-learning convolution neural network (DL-CNN) for bladder cancer. In their study, a volume of interest (VOI) that approximately enclosed the bladder cancer tissue was manually marked in each CT scan, and 16 × 16-pixel regions of interest (ROIs) were extracted and fed into the DL-CNN [Citation23]. For OAR segmentation, Dolz et al. investigated a 3D fully CNN (FCNN) for subcortical brain structure segmentation in MRI images; this was the first study in which 3D FCNNs for subcortical structure segmentation were examined [Citation24]. Most existing CNN approaches perform 2D segmentation in a slice-by-slice fashion. Therefore, these approaches do not take full advantage of the 3D context. The oesophagus has a slender and continuous structure but also a versatile shape, and it has poor contrast with neighbouring tissues in CT scans. Fechter et al. proposed a random walk approach driven by a 3D FCNN to automatically segment the oesophagus based on CT images. Because pre- and post-processing and related parameters were specifically optimised for the oesophagus, good results were obtained [Citation25]. During radiation treatment planning (RTP) for lung cancer, different OARs have different features in CT images. Lustberg et al. first provided a clinical evaluation of atlas-based (Mirada RTx 1.6 and Workflow Box 1.4, Mirada Medical Ltd., Oxford, UK) and deep learning-based automatic contouring (Mirada DLC Expert, prototype, Mirada Medical Ltd., Oxford, UK) for RTP for lung cancer using commercial software [Citation26]. These researchers showed that the user adjustment of software-generated contours is a viable strategy for reducing the contouring time of OARs for lung radiotherapy while conforming to local clinical standards.
Inspired by the applications of these techniques, we attempted to train a 3D CNN on the common thoracic and abdominal OARs of lung cancer patients for RTP. More research focused on comparing CNN-based and traditional methods can provide more evidence on the successful application of CNNs in automatic segmentation. A preliminary comparison of the automatic segmentation performances for multiple OARs between a 3D CNN-based method and the commercial atlas-based segmentation software ABAS, which is used in our institution, is presented in this study.
Material and methods
Acquisition of data and image pre-processing
A total of 66 randomly selected chest and abdominal CT images from the lung cancer clinic at our hospital were used for training and testing; 30 cases were used for CNN training, and the other 36 cases were used for testing. Six cases out of the 36 test cases were selected randomly for training evaluation.
Images were acquired using a CT Big Bore (Philips) using the following parameters: scan voltage: 140 keV, layer thickness: 5 mm, and image size: 512 × 512. There were 81–123 slices per patient.
A structure set including the lungs, heart, spinal cord, oesophagus, and liver was considered for segmentation. All the cases (including the training and testing cases) were segmented by an experienced senior radiation oncologist specialising in the thorax region and were then peer-reviewed by two other experts.
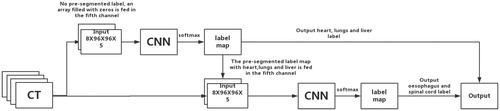
Because the CNN requires a fixed input size, pre-processing was performed for the training and test images as follows. (1) The CT images were cropped to 8 × 96 × 96-pixel (slices × columns × rows) regions of interest (ROIs). For the training data, several overlapping ROIs were randomly cropped, but there was at least one labelled pixel in each ROI. For the testing data, the outer contour of the human body was segmented using the ‘explosion-controlled region growth’ technique [Citation27]. The ROIs were cropped from the edge of the minimal adjacent cube along the outer contour of the body. (2) To highlight soft tissues, bone, and spinal cord tissue, a window-level transformation was applied in which the original image was transformed using a soft-tissue window (window width: 350, window level: 40), a bone window (window width: 1000, window level: 400), and a brain window (window width: 100, window level: 50) to generate three new images, and then, these images were integrated with the original image as an additional channel. In addition, a pre-segmented label information map was also included as an additional channel. If there was no pre-segmented label, an array filled with zeros was fed into the system (such as for the first CNN, which is described below). The final input size of the CNN was 8 × 96 × 96 × 5 (slices × columns × rows × channels).
CNN architecture
A convolutional neural network is a special type of multi-level perceptron architecture that can make a prediction about an image. In contrast to alternative machine learning-based algorithms, CNNs take spatial information into account so that neighbouring pixels are analysed together. The combination of this behaviour with the generalisation abilities of CNNs makes them superior to other approaches in a number of computer vision applications. The primary component of CNNs is the convolution layer, which performs the convolution operation on the input, passing the result to the next layer.
An encoder-decoder structure can be employed. The encoder gradually reduces the number of spatial dimensions and identifies the features of the image, while the decoder gradually repairs the details and spatial dimensions of the object and determines the boundary of the object, pixel by pixel [Citation28]. A U-Net convolutional network was first designed for biomedical image segmentation. Its architecture consists of a contracting path to capture the context and a symmetric expanding path that enables precise localisation, and thus, this type of network can be trained end-to-end using very few images [Citation29]. To incorporate the 3D contextual information of CT volume images, 3D convolutional processing was employed [Citation24]. Batch normalisation was used to accelerate deep network training by reducing the internal covariate shift [Citation30]. While very deep architectures (with many layers) perform better, they are harder to train because the gradient (the signal from the cost function to the input that is used to change the parameters of the network) vanishes through the layers. If this happens, then the parameters on the shallow layers are not modified during training, and the resulting performance is not optimal. Residual connections can be added as supplementary connections to create shortcuts among blocks of layers through which the signal passes without modification. The residual connections technique allows for the deeper neural networks to be effectively trained. Therefore, a residual convolution unit (RCU) was used to replace the direct convolutional layer [Citation31]. Our CNN was composed of eleven RCUs and one convolutional layer in total. The eleven RCUs were used for down-sampling and up-sampling. In the last layer, a 1 × 1 × 1 convolution with a softmax activation function reduces the number of feature maps to the number of labels. More architectural details are listed in .
Table 1. Architectures for the CNN used. The input data size is 8 × 96 × 96 × 5.
The spinal boundary in the middle of the vertebrae was still indecipherable in the CT images, and the oesophagus had poor soft-tissue contrast in the CT images. We proposed feeding the output label maps that were converted from probability maps after the softmax by selecting the label with the highest probability of the first CNN as additional input information for a second CNN that had the same architecture. We simply fed the output label maps of the first CNN to the fifth channel of the second CNN, and we trained it only for the spinal cord and oesophagus. Hereafter, the resulting output of the second CNN will be called CNN+. A schematic diagram of this concatenation is shown in .
Figure 1. Schematic diagram of the concatenation of the first CNN and the second CNN.
The primary code for the proposed CNN architecture and detailed architectural diagrams are provided as supplementary material and are available at GitHub (https://github.com/zhugoldman/CNN-segmentation-for-Lung-cancer-OARs). The CNN was constructed using Google’s TensorFlow package [Citation32].
CNN training
Adam optimisers were used for training both CNNs and the learning rate was 0.0001. The other parameters adopted their default values, which are provided in the original paper [Citation33]: beta_1 = 0.9, beta_2 = 0.999, and epsilon = 1e − 8. The normal initialiser, which draws samples from a truncated normal distribution centred on 0, was used as the convolution layer initialiser [Citation34]. The training batch size was 8, and the models were trained for 12 epochs.
Loss function of variable weight
The dice similarity coefficient (DSC) is commonly used to assess the degree of overlap between two structures in medical images [Citation35]. A higher level of overlap between two structures is reflected by a greater DSC. The DSC (0 ≤ DSC ≤1) is defined as follows:
(1)
(1)
where V1 is the volume of the reference structure and V2 is the volume of the compare structure. Therefore, (1 − DSC) was used as a loss function and minimised by iteratively optimising the parameters [Citation36].
The training process requires that automatic segmentation is performed simultaneously for multiple organs that vary in size. Thus, during the training process, the convergence rates vary. To conduct intensive training on organs with a low convergence rate, the (1 − DSC) value of the ith organ was multiplied by a weight (wi) such that organs with low DSC values have higher weights. Therefore, the total loss function is as follows:
(2)
(2)
At the beginning of the training, wi=1. After the completion of each training iteration, the result was evaluated, and a new weight (w’i) was calculated according to the DSC of each organ as follows:
(3)
(3)
where DSCmax is the maximum DSC across all organs.
Atlas-based automatic segmentation
The commercial atlas-based segmentation software ABAS (version: 2.01.00, CMS-Elekta, Stockholm, Sweden) was used. Automatic segmentation was performed using ABAS with single atlases of the lung cancer CT data. The images from the atlas patient were also segmented by a senior radiation oncologist specialising in the thorax region following institutional guidelines.
Comparison and evaluation of CNN-based and atlas-based automatic segmentation
The 36 test cases were segmented using the following three methods: (1) completely manual segmentation; (2) automatic segmentation using the trained CNN with the following configuration: CPU: i7- 7700 K (Intel) and GPU: GTX 1080 (NVIDIA); and (3) automatic segmentation using ABAS with the following configuration: CPU: Xeon-X5550 (Intel) and GPU: Quadro FX580 (NVIDIA). Manual segmentation was used as the standard. In accordance with the AAPM Thoracic Auto-segmentation Challenge evaluation criteria [Citation37], the DSC, the mean surface distance (MSD), and the 95% Hausdorff distance (95% HD) were employed to compare the results. More details of the formulas for the MSD and 95% HD can be found in the Supplementary file.
Comparing the performance of different observers and automatic methods
Of the 36 test cases, 12 were re-segmented by three experienced radiation oncologists. The reference standard structures were generated using ABAS (version: 2.01.00) with the simultaneous truth and performance level estimation (STAPLE) method [Citation38] based on the manual segmentations for each case. The manual, CNN-based, and atlas-based segmentations were compared with the reference standard to obtain the DSC results for the different observers and methods with respect to the previously generated ground truth.
Statistical analysis
A statistical analysis was performed on the CNN-based segmentation results and the atlas-based segmentation results via a ranked Wilcoxon test using SPSS version 24.0. p < .05 was regarded as statistically significant. The authenticity of this article has been validated by uploading the key raw data onto the Research Data Deposit public platform (www.researchdata.org.cn), under RDD approval number RDDA2017000428.
Results
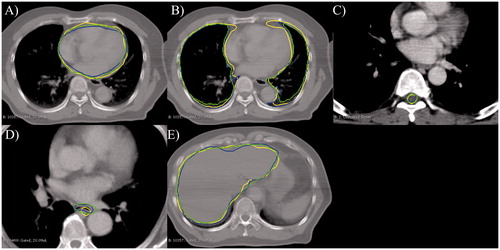
For the thoracic and abdominal CT images of 36 cases of lung cancer, each CNN-based automatic segmentation required an average of ∼0.2 minutes, whereas the atlas-based automatic segmentation required an average of ∼3 minutes. The segmentation results for one representative case are shown in .
Figure 2. Results of the automatic segmentation of normal tissues. Blue line: manual segmentation; green line: CNN-based automatic segmentation; and yellow line: ABAS-based automatic segmentation. (A) Heart, (B) lung, (C) spinal cord, (D) esophagus, and (E) liver.
shows the DSC statistics for the segmentation of the test CT images for the 36 cases. shows a detailed summary of the DSC statistics. The DSC results obtained for a CNN with the same architecture and training parameters but that employed only the original CT data as its unique input are also included. The DSC results of the three experts along with the CNN-based and atlas-based segmentation results compared with the reference standard generated with the STAPLE method are shown. According to the good agreement threshold of the DSC (DSC ≥0.7) [Citation39, Citation40], the DCNN-based automatic segmentation results and the atlas-based automatic segmentation results for the heart, liver, spinal cord and lungs were consistent with the manual segmentation results. The automatic segmentation results of the oesophagus were slightly inferior to those of the other four organs. For the oesophagus and the spinal cord, the CNN + provided better results than the CNN. For the oesophagus and the spinal cord, the DSCs of the CNN-based automatic approach were better than those of the single atlas-based approach. Regarding the results of the MSD and 95%HD, similar results were obtained. More details about the MSD and 95%HD results can be found in the Supplementary file.
Figure 3. DSCs of the CNN-based automatic segmentations and the atlas-based automatic segmentations, with manual segmentations as the standard. The black lines are the results obtained using ABAS, the red lines are the results of the CNN, and the blue lines are the results of CNN+. The *symbol indicates a significant difference (p < .05, ranked Wilcoxon test).
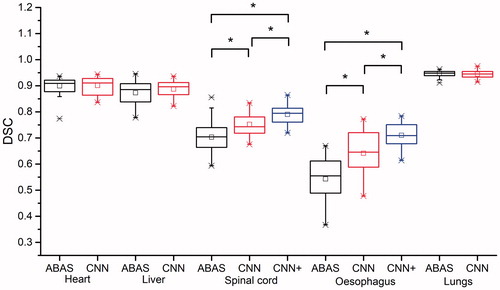
Table 2. DSCs of the experts’ manual segmentation and of automatic segmentations using the CNN-based and atlas-based approaches.
Discussion
In this study, we compared the results obtained via CNN-based and atlas-based automatic segmentation. After training, the CNNs could be used for the automatic segmentation of normal organs in the chest and abdominal CT images of lung cancer. A 3D CNN was used to facilitate object-based image segmentation using the 3D information provided by CT images. Compared with the DSC results of the first CNN obtained with only the original CT data as its unique input, the results of a pre-processing transformation with varying window widths and levels performed better (). This pre-processing effectively highlighted the edges of the soft tissue, bone and nerves, thus improving the outcome of the automatic segmentation. The DSC of the oesophagus was improved by 0.031. By adopting a loss function with variable weights for multiple training objectives, we avoided the phenomenon in which a few structures are presented extremely well while the overall loss function is too low, leading to a decreased parameter optimisation rate and affecting the results for other structures.
Markov random fields (MRFs) [Citation41] and random walks [Citation25] have been previously applied to improve CNN results. In such cases, the final label at a given position is effectively influenced by the model beliefs about the label near the given position. However, inferences during these joint segmentation methods may typically be more computationally expensive than a simple feed-forward pass through a CNN, which occurs as a result of the convolutional nature of the models and efficient GPU implementation [Citation42]. In this study, a second CNN was applied to improve the spinal cord and oesophagus results obtained from the CNN-based automatic segmentation process. Compared with the first CNN, the CNN + improved the spinal cord and oesophagus DSCs by 0.04 and 0.07, respectively.
Our results showed that the organs that could be represented via atlas-based automatic segmentation, e.g., the heart, lungs, and liver (with an average DSC ≥0.87) could also be well-represented through CNN-based segmentation, with no significant differences between the two segmentation methods, because these structures are large in size and display distinct boundaries within CT images.
For the spinal cord and the oesophagus, the CNN-based and atlas-based automatic segmentation methods differed significantly (p < .05), particularly for the oesophagus, for which the DSC was increased by 0.17 when using CNN-based segmentation. However, the atlas strategy used for comparison employed only a single atlas. Notably, the CNN is trained with more than a single patient. Such a comparison would, therefore, be unfair because for small structures, such as the oesophagus, there will still be a great deal of variability across patients. Employing only a single atlas will not cover this variability in a given population.
As for the spinal cord, owing to the presence of vertebrae as bone markers, the DSCs of the two automatic segmentation methods were both greater than 0.7, which is the commonly accepted threshold value [Citation12,Citation43–45]. However, the spinal boundary in the middle of the vertebrae () was still indecipherable on the CT image, and thus, the results for the spinal cord were not as good as those for the heart, lungs or liver and showed only a moderate level of agreement.
Because of the poor soft-tissue contrast in CT images and the indistinct boundary with surrounding soft tissues and irregular shape of the oesophagus, the DSCs of the atlas-based segmentation methods failed to exceed 0.7 for the oesophagus. Ciardo et al. used an atlas-based automatic segmentation method with different atlas libraries on CT images of breast cancer and reached a DSC <0.60 for the oesophagus [Citation10], similar to the results obtained using the atlas-based segmentation method described in this study. La Macchia et al. systematically evaluated three commercial automatic segmentation software packages (ABAS 2.0, MIM 5.1.1, and VelocityAI 2.6.2) in a study in which the results of manual segmentation on a patient undergoing adaptive radiation therapy (ART) were first used as the atlas and subsequent rescanned CT images were automatically segmented [Citation13]. Because the body structure of the same patient would inherently not change very much, this case is especially suitable for atlas-based automatic segmentation based on a priori knowledge, achieving 0.62 ≤ DSC ≤ 0.68 for the oesophagus. Yang et al. used a more complex two-phase ranking method for multi-atlas segmentation, and the DSC of the oesophagus reached 0.73. The CNN-based DSC obtained without the second CNN was 0.637 in this study. This result was similar to the results obtained using a single CNN (0.53–0.6) reported by Fechter et al. [Citation25]. By including the second CNN for improvement, the DSC reached 0.71. Fechter et al. used a CNN that was improved through a random walk algorithm for the segmentation of the oesophagus alone, and the DSC reached 0.76. Lustberg et al. reported a DSC of ∼0.7 when using commercial deep learning contouring software with data from 450 lung patients for training [Citation26]. These findings indicate that it is difficult to obtain a result that is as good as those for the heart and lungs when relying on information provided by CT images. The addition of multi-modal images, such as MRI images that provide clear resolution in soft tissue, could further improve the obtained results.
For all the test cases, the CNN was able to complete the automatic segmentation process within 0.2 minutes without any human intervention. The CNN + technique took twice as long because an additional CNN had to be trained. In this study, the atlas-based automatic segmentation method completed segmentation within an average of ∼3 minutes. Isambert et al. required 7–8 minutes to automatically segment six structures in the head using a single atlas-based ABAS automatic segmentation method [Citation11]. La Macchia et al. evaluated three automatic segmentation software packages and measured the times required to automatically segment ten structures in chest and abdominal CT images using a single atlas-based segmentation method and three software packages, namely, ABAS, MIM and VELOCITY AI, which required 8.32 minutes, 2.35 minutes and 6.47 minutes, respectively [Citation13]. Most of the time required for atlas-based automatic segmentation is consumed during the registration of the test image with the atlas image. A trained CNN can quickly accomplish the automatic segmentation task and save time when completing the OAR segmentation during the routine planning stage, leaving doctors with more time to improve the segmentation accuracy and to complete automatic segmentation for ART more quickly. During the re-planning stage, the time required for doctors to re-segment structures is substantially lower, and the efficiency of ART is increased, thereby enabling the increased use of ART.
Whether the errors of automatic tools lie in the variability among different experts was also evaluated. Two additional experienced radiation oncologists (for a total of three in this study) independently and manually re-segmented the OAR structures of 12 of the 36 test cases. The reference standard structures were generated using the STAPLE method based on the manual segmentation for each case. shows the DSCs obtained for the different expert manual segmentations, along with the DSCs obtained for the CNN-based and atlas-based automatic segmentation methods. According to these results, the DSCs obtained for the CNN-based automatic segmentation methods were close to the expert results for the heart, liver, spinal cord and lungs. However, for the oesophagus, the DSCs obtained for the CNN-based automatic segmentation methods were lower than those of the experts. Therefore, there may be room for further improvements or user adjustments may be required.
The results of the present study were obtained solely through CNN-based automatic segmentation. In future studies, the CNN will be combined with the traditional atlas-based method, especially in scenarios such as ART in which prior knowledge can be used. We expect this approach to improve our prediction results further.
Conclusions
In this study, a CNN was used to perform the automatic segmentation of multiple OARs in chest and abdominal CT images of lung cancer patients and the results of the automatic segmentation process were compared with those obtained through atlas-based segmentation. Our results showed that for the CT images of lung cancer, the encoder-decoder-style convolutional neural network was able to complete the automatic segmentation quickly and accurately. Therefore, CNNs can be satisfactorily adopted in the RTP of lung cancer patients to segment OARs.
Supplemental Material
Download MS Word (371.7 KB)Disclosure statement
No potential conflict of interest was reported by the authors.
Additional information
Funding
References
- Siegel RL, Miller KD, Jemal A. Cancer Statistics, 2017. CA Cancer J Clin. 2017;67:7–30.
- Jett JR, Schild SE, Keith RL, et al. Treatment of non-small cell lung cancer, stage IIIB: ACCP evidence-based clinical practice guidelines (2nd edition). Chest. 2007;132:266S–276S.
- Auperin A, Le Pechoux C, Rolland E, et al. Meta-analysis of concomitant versus sequential radiochemotherapy in locally advanced non-small-cell lung cancer. Jco. 2010;28:2181–2190.
- Lagerwaard FJ, Verstegen NE, Haasbeek CJ, et al. Outcomes of stereotactic ablative radiotherapy in patients with potentially operable stage I non-small cell lung cancer. Int J Radiat Oncol Biol Phys. 2012;83:348–353.
- Haasbeek CJ, Lagerwaard FJ, Slotman BJ, et al. Outcomes of stereotactic ablative radiotherapy for centrally located early-stage lung cancer. J Thorac Oncol. 2011;6:2036–2043.
- Caillet V, Keall PJ, Colvill E, et al. MLC tracking for lung SABR reduces planning target volumes and dose to organs at risk. Radiother Oncol. 2017;124:18–24.
- Stam B, Peulen H, Guckenberger M, et al. Dose to heart substructures is associated with non-cancer death after SBRT in stage I-II NSCLC patients. Radiother Oncol. 2017;123:370–375.
- Chang JY, Liu H, Balter P, et al. Clinical outcome and predictors of survival and pneumonitis after stereotactic ablative radiotherapy for stage I non-small cell lung cancer. Radiat Oncol. 2012;7:152.
- Lim JY, Leech M. Use of auto-segmentation in the delineation of target volumes and organs at risk in head and neck. Acta Oncologica. 2016;55:799–806.
- Ciardo D, Gerardi MA, Vigorito S, et al. Atlas-based segmentation in breast cancer radiotherapy: evaluation of specific and generic-purpose atlases. Breast. 2017;32:44–52.
- Isambert A, Dhermain F, Bidault F, et al. Evaluation of an atlas-based automatic segmentation software for the delineation of brain organs at risk in a radiation therapy clinical context. Radiother Oncol. 2008;87:93–99.
- Conson M, Cella L, Pacelli R, et al. Automated delineation of brain structures in patients undergoing radiotherapy for primary brain tumors: from atlas to dose-volume histograms. Radiother Oncol. 2014;112:326–331.
- La Macchia M, Fellin F, Amichetti M, et al. Systematic evaluation of three different commercial software solutions for automatic segmentation for adaptive therapy in head-and-neck, prostate and pleural cancer. Radiat Oncol. 2012;7:160.
- Thirion JP. Image matching as a diffusion process: an analogy with Maxwell's demons. Med Image Anal. 1998;2:243–260.
- Rueckert D, Sonoda LI, Hayes C, et al. Nonrigid registration using free-form deformations: application to breast MR images. IEEE Trans Med Imaging. 1999;18:712–721.
- Sharp G, Fritscher KD, Pekar V, et al. Vision 20/20: perspectives on automated image segmentation for radiotherapy. Med Phys. 2014;41:050902.
- Wells WM, 3rd, Viola P, Atsumi H, et al. Multi-modal volume registration by maximization of mutual information. Med Image Anal. 1996;1:35–51.
- Wu M, Rosano C, Lopez-Garcia P, et al. Optimum template selection for atlas-based segmentation. Neuroimage. 2007;34:1612–1618.
- Sabuncu MR, Yeo BT, Van Leemput K, et al. A generative model for image segmentation based on label fusion. IEEE Trans Med Imaging. 2010;29:1714–1729.
- Wachinger C, Fritscher K, Sharp G, et al. Contour-driven atlas-based segmentation. IEEE Trans Med Imaging. 2015;34:2492–2505.
- LeCun Y, Bengio Y, Hinton G. Deep learning. Nature. 2015;521:436–444.
- Shin HC, Roth HR, Gao M, et al. Deep convolutional neural networks for computer-aided detection: CNN architectures, dataset characteristics and transfer learning. IEEE Trans Med Imaging. 2016;35:1285–1298.
- Cha KH, Hadjiiski LM, Samala RK, et al. Bladder cancer segmentation in CT for treatment response assessment: application of deep-learning convolution neural network-a pilot study. Tomography. 2016;2:421–429.
- Dolz J, Desrosiers C, Ben Ayed I. 3D fully convolutional networks for subcortical segmentation in MRI: a large-scale study. Neuroimage. 2017;170:456–470.
- Fechter T, Adebahr S, Baltas D, et al. Esophagus segmentation in CT via 3D fully convolutional neural network and random walk. Med Phys. 2017;44(12):6341–6352.
- Lustberg T, van Soest J, Gooding M, et al. Clinical evaluation of atlas and deep learning based automatic contouring for lung cancer. Radiother Oncol. 2017;126(2):312–317.
- van Rikxoort EM, de Hoop B, Viergever MA, et al. Automatic lung segmentation from thoracic computed tomography scans using a hybrid approach with error detection. Med Phys. 2009;36:2934–2947.
- Shelhamer E, Long J, Darrell T. Fully convolutional networks for semantic segmentation. IEEE Trans Pattern Anal Mach Intell. 2017;39:640–651.
- Ronneberger O, Fischer P, Brox T. U-net: convolutional networks for biomedical image segmentation. CoRR. 2015;1505:abs/1505.04597.
- Ioffe S, Szegedy C. Batch normalization: accelerating deep network training by reducing internal covariate shift. ArXiv e-Prints. 2015;1502:abs/1502.03167.
- He K, Zhang X, Ren S, et al. Deep residual learning for image recognition. CoRR. 2015;1512:abs/1512.03385.
- Abadi Mi n, Agarwal A, Barham P, et al. TensorFlow: Large-Scale Machine Learning on Heterogeneous Systems. ArXiv e-Prints. 2016;1603:abs/1603.04467.
- Kingma DP, Ba J. Adam: a method for stochastic optimization. CoRR. 2014;1412:abs/1412.6980.
- He K, Zhang X, Ren S, et al. Delving deep into rectifiers: surpassing human-level performance on imagenet classification. ArXiv e-Prints. 2015;1502:abs/1502.01852.
- Dice LR. Measures of the amount of ecologic association between species. Ecology. 1945;26:297–302.
- Milletari F, Navab N, Ahmadi SA, editors. V-Net: Fully Convolutional Neural Networks for Volumetric Medical Image Segmentation. 2016 Fourth International Conference on 3D Vision (3DV); 2016 25–28 Oct. 2016.
- Yang J, Veeraraghavan H, Armato SG, et al. Autosegmentation for thoracic radiation treatment planning: A grand challenge at AAPM. Med Phys. 2018;45(10):4568–4581.
- Warfield SK, Zou KH, Wells WM. Simultaneous truth and performance level estimation (STAPLE): an algorithm for the validation of image segmentation. IEEE Trans Med Imaging. 2004;23:903–921.
- Zijdenbos AP, Dawant BM, Margolin RA, et al. Morphometric analysis of white matter lesions in MR images: method and validation. IEEE Trans Med Imaging. 1994;13:716–724.
- Bartko JJ. Measurement and reliability: statistical thinking considerations. Schizophr Bull. 1991;17:483–489.
- Ibragimov B, Xing L. Segmentation of organs-at-risks in head and neck CT images using convolutional neural networks. Med Phys. 2017;44:547–557.
- Havaei M, Davy A, Warde-Farley D, et al. Brain tumor segmentation with deep neural networks. Med Image Anal. 2017;35:18–31.
- Sims R, Isambert A, Gregoire V, et al. A pre-clinical assessment of an atlas-based automatic segmentation tool for the head and neck. Radiother Oncol. 2009;93:474–478.
- Gaede S, Olsthoorn J, Louie AV, et al. An evaluation of an automated 4D-CT contour propagation tool to define an internal gross tumour volume for lung cancer radiotherapy. Radiother Oncol. 2011;101:322–328.
- Dolz J, Kirişli HA, Fechter T, et al. Interactive contour delineation of organs at risk in radiotherapy: clinical evaluation on NSCLC patients. Med Phys. 2016;43:2569.