
Abstract
Background: In patients diagnosed with rectal cancer, dose escalation is currently being investigated in a large number of studies. Since there is little known on gross tumor volume (GTV) inter-fraction motion for rectal cancer, a wide variety in margins is used. Purpose of this study is to quantify GTV inter-fraction motion statistics on different timescales and to give estimates of planning target volume (PTV) margins.
Material and methods: Thirty-two patients, diagnosed with rectal cancer, were included. To investigate motion from week-to-week, 16 patients underwent a pretreatment and five weekly MRIs, prior to a radiotherapy (RT) fraction of the chemoradiotherapy treatment. To investigate motion from day-to-day, the remaining 16 patients underwent five daily MRIs before each fraction in one week of RT. GTV was delineated on all scans according to guidelines. Scans were aligned on bony anatomy with the first MRI. For both datasets separately, GTV inter-fraction motion was determined based on center-of-gravity displacement. Therefrom, systematic and random errors were determined in left/right (LR), anterior/posterior and cranial/caudal (CC) direction. PTV margin estimates were calculated and evaluated on GTV coverage.
Results: Systematic and random errors were found in the range of 2.3–4.8 mm and 1.5–3.3 mm from week-to-week, and 1.8–4.5 mm and 1.8–4.0 mm from day-to-day, respectively. On both timescales, similar motion patterns were found; the most motion was observed in CC whilst the least motion was observed in LR. On the week-to-week data more systematic and less random motion was observed compared to the day-to-day data. Overall, only slight differences in margin estimates were found. Derived PTV margin estimates were found to give adequate GTV coverage.
Conclusion: GTV inter-fraction motion, on a week-to-week and day-to-day timescale, can be accounted for using motion statistics presented in this study.
Introduction
Patients diagnosed with locally advanced rectal cancer receive neo-adjuvant chemoradiotherapy (CRT) prior to total mesorectal excision surgery. A typical example of neo-adjuvant CRT consists of 25 fractions of 2 Gy in 5 weeks combined with capecitabine, 10–12 weeks prior to surgery. The purpose of CRT is to reduce the chance for local recurrence and to downsize the tumor. After CRT, around 15% of patients have a pathological complete response (pCR) and these responders have a better long-term prognosis compared to non-responders [Citation1,Citation2]. For complete responders, surgery might be safely omitted to improve quality of life [Citation3]. The percentage of pCR can be increased by giving an additional boost dose to the gross tumor volume (GTV) [Citation4]. This is currently being investigated in a large number of clinical trials [Citation5–12]. For the studies where the boost is delivered using external beam radiotherapy (RT), the boost dose is either delivered over a period of weeks; in a simultaneous-integrated boost (SIB) during five weeks of standard CRT. Or over a period of days; within one week in a sequential boost, prior or post standard RT.
For adequate and safe boost dose delivery, an insight in the motion and deformation of the GTV is needed, either from week-to-week or from day-to-day, depending on the chosen boost strategy. This insight allows to develop position correction protocols and determines planning target volume (PTV) margins or investigates the use of adaptive strategies, thereby lowering the dose to the organs at risk (OAR) while maintaining GTV dose coverage. Unfortunately, little is known about the inter-fraction motion of the GTV, mainly due to its poor visibility on computed tomography (CT) and cone-beam CT. In contrast to CT, magnetic resonance imaging (MRI) provides excellent visibility of the GTV due to superior soft-tissue contrast [Citation13]. It is therefore a suitable candidate for motion assessment of rectal tumors [Citation14]. However up to now, no inter-fraction motion assessment was performed based on MRI for the GTV in rectal cancer.
In absence of GTV motion statistics a wide range of GTV margins are being used in ongoing boost trails, between 7 and 30 mm [Citation6–12]. Substantiated GTV margins could improve these boost treatments by ensuring coverage of the GTV by the boost dose at minimal toxicity.
Purpose of this study is to quantify GTV inter-fraction motion using MRI in rectal cancer patients, both on a day-to-day and week-to-week timescale and to give estimates of GTV-PTV margins to account for this motion.
Material and methods
Patient data
For the purpose of this study we analyzed 32 patients diagnosed with rectal cancer. Half of these patients were imaged on a week-to-week timescale; imaged weekly during five weeks of CRT. On these data tumor motion can be investigated during five weeks of treatment, similar to the time-period over which a typical SIB approach is delivered. The other half of the patients were imaged on a day-to-day timescale; imaged daily during one week of RT. On these data tumor motion can be investigated during one week, similar to most sequential boost approaches. Both the week-to-week and day-to-day datasets were analyzed separately.
For the week-to-week dataset, 16 patients were included; 15 male/1 female, TNM-stages; T2-4, N0-2, M0-1 and a mean age of 59.8 years (range: 37–73 years). These patients underwent a long-course of CRT (25 times 2 Gy in five weeks), according to standard clinical practice in our hospital. For this dataset, repeated MRI scans were performed weekly. The first MRI scan, which we consider the reference MRI (MRIref) was taken at the time of the pretreatment planning CT. Furthermore, five additional MRI scans were taken weekly, at the end of each week of treatment, prior to a RT fraction. For two patients, one of the weekly MRI scans could not be performed due to logistical reasons, resulting in a total of 94 MRIs in the week-to-week dataset.
For the day-to-day dataset, 16 patients were included; 13 male/3 female, TNM-stages T2-3, N0-1, M0-1), with a mean age of 60.4 years (range: 43–72 years). These patients underwent a short-course of RT (5 times 5 Gy in one week), according to standard clinical practice in our hospital. For this dataset, repeated MRI scans were performed daily during one week. The first MRI scan was considered the reference MRI (MRIref) and was taken at the time of the first treatment fraction. Four additional MRI scans were taken daily, prior to each treatment fraction. For four patients, one of the daily MRI scans could not be performed due to logistical reasons, resulting in a total of 76 MRIs in the day-to-day dataset.
All patients were asked to empty their bladder and drink 400 cc of water, one hour prior to each MRI scan. A total of 170 MRI scans were obtained in treatment position (supine) for analysis. For this study, the T2-weighted (T2w) scans were used. On every T2w scan, GTVs were delineated by an experienced radiation oncologist. Tumor delineation uncertainty was previously investigated in a separate study [Citation13]. All scans were acquired in, by the hospital medical ethical review board approved, studies. These studies are registered under the numbers NL31131.041.10 and NL29622.041.09 for the week-to-week and day-to-day dataset, respectively. Written informed consent was acquired from all patients prior to enrollment.
Image acquisition
MRI was performed in treatment position (supine), using a flat table-top, with the imaging plane in the transverse direction. For the week-to-week dataset, MRI was performed on a 3T MRI scanner using a 32 element coil (either an Achieva 3TX with SENSE cardiac coil or an Ingenia Wide-bore with FlexCoverage Anterior + Posterior coil, both Philips Medical Systems, Best, The Netherlands). For the Achieva system, T2w imaging was acquired on a resolution of 0.47 × 0.47 mm2, slice thickness of 3 mm and the number of slices was 50. A repetition time (TR) of 9403 ms and an echo time (TE) of 110 ms were used. For the Ingenia system, T2w imaging resolution was 0.82 × 0.82 mm2, slice thickness of 3 mm, and the number of slices was 70. The TR was 5627 ms and the TE was 110 ms.
For the day-to-day dataset, MRI was performed on a 1.5T MRI scanner using a four element body coil (Gyroscan NT Intera with SENSE body coil, Philips Medical Systems, Best, The Netherlands). T2w imaging was acquired on a resolution of 0.62 × 0.62 mm2, slice thickness of 4 mm, and the number of slices was 30. A TR of 3713 ms and TE of 120 ms were used.
Image registration
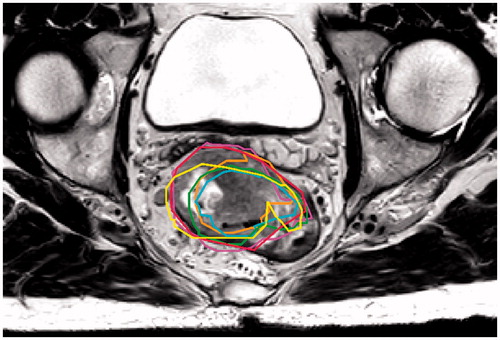
To evaluate residual target motion after online position correction on bony anatomy, all repeated MRIs were registered to the MRIref, using a rigid registration method from the Elastix toolkit [Citation15], allowing translations as well as rotations. All delineations were projected on the MRIref, as shown in . Visual inspection showed errors in bony alignment to be limited to 1 voxel. These errors were neglected for the purpose of this study.
Figure 1. An example from the week-to-week dataset where the GTV delineations of all repeated MRIs are projected on MRIref. Delineation of pretreatment scan (MRIref) is in red, the delineations of the repeated MRIs of week 1–5 are in red, purple, yellow, green, cyan and orange, respectively.
Inter-fraction motion characterization
With all repeated MRIs registered to its MRIref, relative inter-fraction displacement can be quantified. To derive motion statistics, the following analysis was performed for both the week-to-week and day-to-day dataset separately.
For all the aligned delineations, center-of-gravity (COG) was determined. Next, the distance vectors between the COG of delineated GTVs on the MRIref and all the repeated MRI scans were determined. These distance vectors were then decomposed into distances in left/right (LR), anterior/posterior (AP) and cranial/caudal (CC). Per patient, mean (µ) and standard deviation (s) of these distances were calculated over time. The group mean error (GM) and systematic error (Σ) were calculated by taking the mean and standard deviation over µ; the mean distance per patient, respectively.
The random errors (σ) were calculated by taking the root mean square over s; the standard deviation of the distances per patient [Citation16]. In this way group mean, systematic and random errors in GTV position were determined. This was done in, respectively, LR, AP and CC direction, both for the week-to-week and day-to-day data, separately. Stability of delineated GTVs was evaluated. Therefore, for both the week-to-week and day-to-day dataset, data were checked for normality and pairwise compared using a two-sided paired t-test between delineations of the MRIref and repeated MRIs. P values below .05 were considered as significant.
Margin evaluation
Estimates for PTV margin expansions were calculated for the GTV for both the week-to-week and day-to-day dataset, using the margin recipe by van Herk et al. MPTV = 2.5×Σ + 0.7×σ; with Σ the systematic and σ the random population error in mm [Citation16]. PTV margin estimates were evaluated on target coverage of the GTV for the week-to-week and day-to-day dataset separately. This was done by adding the margins to the MRIref delineation to create the PTV. We evaluated the coverage by determining the amount of repeated MRI GTV delineations that were covered by this PTV for 95% of their volume. We consider a PTV margin that results in a GTV overlap of 95%, in 90% of all cases as adequate.
Results
The average GTV (range) on the pretreatment scan was 54.0 ml (17.2–143.6 ml) for the week-to-week dataset and 12.3 ml (3.9–29.0 ml) for the first scan of the day-to-day dataset. Furthermore, significant reduction in GTV was found between the MRIref and repeated weekly MRIs in the week-to-week dataset, but not for the day-to-day dataset. A complete overview of GTVs in time can be found in .
Table 1. Average GTVs in time for the day-to-day and week-to-week timescales.
The analysis of COG displacement of the GTV after online bony anatomy position verification, showed the following patterns. The least random and systematic motion was found in LR and the most random and systematic motion was found in CC direction, both from week-to-week and from day-to-day. Overall similar patterns were found in both the week-to-week and day-to-day datasets. When comparing them, larger systematic and smaller random errors were found from week-to-week compared to day-to-day. Overall, slightly larger treatment margins are required from week-to-week compared to day-to-day. A complete overview of motion statistics and margin estimates can be found in .
Table 2. GTV motion statistics for week-to-week and day-to-day timescales, i.e., motion within five weeks of CRT and one week of RT, respectively.
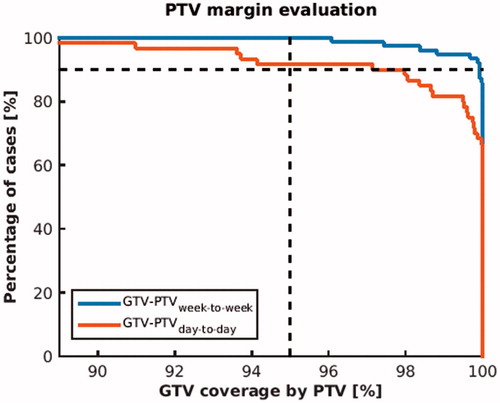
PTV margin estimates were evaluated on overlap of PTV and GTV. For both the week-to-week and day-to-day data, boost PTV margins achieved adequate target coverage, i.e., PTV overlapped more than 95% of the GTV in more than 90% of all cases. For 90% of all cases a PTV coverage of 99,9% and 97,2% was achieved, on the week-to-week and day-to-day timescale, respectively (see ).
Figure 2. Evaluation of GTV-PTV margin estimates for both the week-to-week and day-to-day timescale. GTV-PTV margins were calculated using the van Herk recipe and were evaluated on GTV overlap. For the PTV margins to be adequate, 95% target overlap in 90% of all cases was required (indicated by the dashed lines). Note that margin evaluation on target overlap is more strict than on dose coverage.
Discussion
This is the first study to investigate rectal tumor inter-fraction motion using MRI. The purpose of this study was to investigate rectal tumor inter-fraction motion on different timescales; from week-to-week and from day-to-day. These motion statistics can be used to develop tumor boost protocols with substantiated tumor margins, for both integrated boost techniques as well as sequential boost techniques prior to standard treatment.
In this study, residual errors after an online correction on bony anatomy were quantified for two different timescales. Systematic and random errors between 2.3–4.8 and 1.5–3.3 mm for the week-to-week and 1.8–4.5 and 1.8–4.0 mm for the day-to-day timescale were found, respectively. The only study that quantified tumor inter-fraction motion for rectal cancer, a CT-based week-to-week study by Brierley et al. [Citation17], reports systematic errors between 1.9 and 4.5 mm and random errors between 2.0 and 6.3 mm for different geometrical directions. Although patients in that study were scanned in prone on CT and our patients in supine position on MRI, quite similar systematic errors were found. However, they do find larger random errors, which might be explained by uncertainties in GTV assessment on CT or by the lower number of samples per patient; three in their study vs. five/six in our day-to-day/week-to-week dataset.
When comparing week-to-week and day-to-day results, we find more systematic and less random errors for the week-to-week data as compared to the day-to-day data. Therefore, slightly larger margins are needed for the week-to-week dataset; on average only 0.6 mm larger. These differences can be explained on the one hand by the difference in time-period between the two groups. Over the course of CRT radiation effects are starting to take place, which are not, or in lesser extent taking place during one week of RT. We observed no tumor regression on the day-to-day timescale during RT, whereas on the week-to-week timescale tumor regression during CRT was found. The latter was also shown by Van den Begin et al. [Citation18]. Also rectal volume tends to decrease after two to three weeks of CRT whereas this is not observed during one week of RT [Citation19,Citation20]. This could lead to increased systematic errors. Another explanation for the differences could be the large difference in tumor size. The smaller tumors in the day-to-day dataset might be more mobile which could explain the larger random errors for this group.
We derived margin estimates, based on motion statistics presented in this study, on both a week-to-week and day-to-day timescale. These margins were evaluated on tumor coverage by the PTV, which is more strict than evaluation on (total) dose. Nevertheless, high GTV coverage percentages were achieved by the PTV throughout the time of treatment. Although the PTV margins were evaluated on the same data they were derived from, we believe the evaluation proves that the derived sets of motion statistics are a good description of the motion present in the datasets. Ideally, presented motion statistics should be evaluated on a separate repeated MRI dataset.
GTV inter-fraction motion statistics, as presented in this study, can be used to derive margins for dose escalation in clinical practice. Currently, dose escalation studies use margins ranging from 7 to 30 mm. However, applying the tumor motion data from this study, tumor margins can be reduced considerably. Potentially allowing for an even higher boost dose or lowering the dose to OAR.
The day-to-day GTV motion data presented in this study is based on a situation where no tumor regression takes place. Therefore, these data are applicable to a sequential boost prior to standard CRT. Whether these data can be used for a post CRT boost, where tumor regression and other radiation induced effects take place, was not investigated.
Furthermore, the absence of a pretreatment MRI weeks prior to the repeated MRIs could have had an impact on the derived systematic errors. However, work on the evolution of these motion errors in time suggests no underestimation of systematic errors is to be expected, due to the absence of a pretreatment MRI [Citation14].
The MRIs used in this study consisted of transverse slices of 3 or 4 mm thick. This slice thickness could have had an influence on the motion found perpendicular to these slices (CC). We deem this influence to be minor due to the following reasons. Since we perform a COG-based method the effects of slice thickness partially average out. Furthermore, the used image registration can achieve a sub-voxel registration accuracy, thereby also the derived motion will have a sub-voxel accuracy, reducing the effect of slice thickness even further.
One has to keep in mind that these statistics only incorporate the residual inter-fraction motion after a set-up based on bony anatomy and intra-observer variation. Inter-observer variation [Citation13], intra-fraction motion [Citation14] and institute set-up errors are not included in these data and have to be combined to get institute PTV margins, as described by van Herk et al. [Citation16]. Also, the applicability of this margin recipe in a (hypofractionated) boost setting including a background dose should be evaluated.
Conclusion
Residual inter-fraction motion of the GTV, after daily set-up on bony anatomy, can be corrected for using motion statistics presented in this study for both pre-CRT sequential and SIB approaches.
Disclosure statement
No potential conflict of interest was reported by the authors.
References
- Wiltshire KL, Ward IG, Swallow C, et al. Preoperative radiation with concurrent chemotherapy for resectable rectal cancer: effect of dose escalation on pathologic complete response, local recurrence-free survival, disease-free survival, and overall survival. Int J Radiat Oncol Biol Phys. 2006;64:709–716.
- Maas M, Nelemans PJ, Valentini V, et al. Long-term outcome in patients with a pathological complete response after chemoradiation for rectal cancer: a pooled analysis of individual patient data. Lancet Oncol. 2010;11:835–844.
- Habr-Gama A, Perez RO, Nadalin W, et al. Operative versus nonoperative treatment for stage 0 distal rectal cancer following chemoradiation therapy. Ann Surg. 2004;CXXII:309–316.
- Appelt AL, Ploen J, Vogelius IR, et al. Radiation dose-response model for locally advanced rectal cancer after preoperative chemoradiation therapy. Int J Radiat Oncol Biol Phys. 2013;85:74–80.
- Burbach JPM, den Harder AM, Intven M, et al. Impact of radiotherapy boost on pathological complete response in patients with locally advanced rectal cancer: a systematic review and meta-analysis. Radiother Oncol. 2014;113:1–9.
- Janjan NA, Crane CN, Feig BW, et al. Prospective trial of preoperative concomitant boost radiotherapy with continuous infusion 5-fluorouracil for locally advanced rectal cancer. Int J Radiat Oncol Biol Phys. 2000;47:713–718.
- Pfeiffer P. High-dose radiotherapy and concurrent UFT plus l-leucovorin in locally advanced rectal cancer: a phase I trial. Acta Oncol (Madr). 2005;44:224–229.
- Movsas B, Diratzouian H, Hanlon A, et al. Phase II trial of preoperative chemoradiation with a hyperfractionated radiation boost in locally advanced rectal cancer. Am J Clin Oncol. 2006;29:435–441.
- Vestermark LW, Jacobsen A, Qvortrup C, et al. Long-term results of a phase II trial of high-dose radiotherapy (60 Gy) and UFT/l-leucovorin in patients with non-resectable locally advanced rectal cancer (LARC). Acta Oncol. 2008;47:428–433.
- Engineer R, Mohandas KM, Shukla PJ, et al. Escalated radiation dose alone vs. concurrent chemoradiation for locally advanced and unresectable rectal cancers: results from phase II randomized study. Int J Colorectal Dis. 2013;28:959–966.
- Mohiuddin M, Paulus R, Mitchell E, et al. Neoadjuvant chemoradiation for distal rectal cancer: 5-year updated results of a randomized phase 2 study of neoadjuvant combined modality chemoradiation for distal rectal cancer. Int J Radiat Oncol Biol Phys. 2013;86:523–528.
- Burbach JPM, Verkooijen HM, Intven M, et al. Randomized controlled trial for pre-operative dose-escalation BOOST in locally advanced rectal cancer (RECTAL BOOST study): study protocol for a randomized controlled trial. Trials. 2015;16:1–8.
- Burbach JPM, Kleijnen JJE, Reerink O, et al. Inter-observer agreement of MRI-based tumor delineation for preoperative radiotherapy boost in locally advanced rectal cancer. Radiother Oncol. 2016;118:399–407.
- Kleijnen JJE, Van Asselen B, Burbach JPM, et al. Evolution of motion uncertainty in rectal cancer: implications for adaptive radiotherapy. Phys Med Biol. 2016;61:1–11.
- Klein S, Staring M, Murphy K, et al. Elastix: a toolbox for intensity-based medical image registration. IEEE Trans Med Imaging. 2010;29:196–205.
- van Herk M, Remeijer P, Rasch C, et al. The probability of correct target dosage: dose-population histograms for deriving treatment margins in radiotherapy. Int J Radiat Oncol Biol Phys. 2000;47:1121–1135.
- Brierley JD, Dawson LA, Sampson E, et al. Rectal motion in patients receiving preoperative radiotherapy for carcinoma of the rectum. Int J Radiat Oncol Biol Phys. 2011;80:97–102.
- Van den Begin R, Kleijnen J-P, Engels B, et al. Tumor volume regression during preoperative chemoradiotherapy for rectal cancer: a prospective observational study with weekly MRI. Acta Oncol. 2018;57(6):723–727. doi:10.1080/0284186X.2017.1400689
- Nijkamp J, de Jong R, Sonke J-J, et al. Target volume shape variation during hypo-fractionated preoperative irradiation of rectal cancer patients. Radiother Oncol. 2009;92:202–209.
- Nijkamp J, de Haas-Kock DFM, Beukema JC, et al. Target volume delineation variation in radiotherapy for early stage rectal cancer in the Netherlands. Radiother Oncol. 2012;102:14–21.