
 ?Mathematical formulae have been encoded as MathML and are displayed in this HTML version using MathJax in order to improve their display. Uncheck the box to turn MathJax off. This feature requires Javascript. Click on a formula to zoom.
Abstract
Purpose/Objective: Flank irradiation for Wilms' tumor (WT) is currently performed at our institute using a cone-beam computed tomography-guided volumetric modulated arc (VMATCBCT) workflow. By adding real-time magnetic resonance imaging (MRI) guidance to the treatment, safety margins could be reduced. The study purpose was to quantify the potential reduction of the planning target volume (PTV) margin and its dosimetric impact when using an MRI-guided intensity modulated radiation therapy (IMRTMRI) workflow compared to the VMATCBCT workflow.
Material/Methods: 4D-CT, MRI and CBCT scans acquired during preparation and treatment of 15 patients, were used to estimate both geometric, motion and patient set-up systematic (∑) and random (σ) errors for VMATCBCT and IMRTMRI workflows. The mean PTV (PTVmean) expansion was calculated using the van Herk formula. Treatment plans were generated using five margin scenarios (PTVmean ± 0, 1 and 2 mm). Furthermore, the IMRTMRI plans were optimized with a 1.5T transverse magnetic field turned-on to realistically model an MRI-guided treatment. Plans were evaluated using dose-volume statistics (p<.01, Wilcoxon).
Results: Analysis of ∑ and σ errors resulted in a PTVmean of 5 mm for the VMATCBCT and 3 mm for the IMRTMRI workflows in each orthogonal direction. Target coverage was unaffected by the margin decrease with a mean V95%=100% for all margin scenarios. For the PTVmean, an average reduction of the mean dose to the organs at risk (OARs) was achieved with IMRTMRI compared to VMATCBCT: 3.4 ± 2.4% (p<.01) for the kidney, 3.4 ± 2.1% (p<.01) for the liver, 2.8 ± 3.0% (p<.01) for the spleen and 4.9 ± 3.8% (p<.01) for the pancreas, respectively.
Conclusions: Imaging data in children with WT demonstrated that the PTV margin could be reduced isotropically down to 2 mm when using the IMRTMRI compared to the VMATCBCT workflow. The former results in a dose reduction to the OARs while maintaining target coverage.
Introduction
Wilms’ tumor (WT), also known as nephroblastoma, belongs to the most frequent retroperitoneal tumors during childhood. Since the first successful protocols were launched in the seventies, reduction of the treatment intensity has become feasible for the majority of the patients, while the survival rate exceeds now 90% [Citation1,Citation2]. Nevertheless, the sub-group of patients with a higher probability for loco-regional failure (∼20%) that need irradiation at the site of the primary tumor [Citation3] are at risk for potential radiation-induced late effects such as increased risk of renal failure, scoliosis, metabolic syndrome and intestinal occlusion [Citation4–7]. In addition, studies have shown an increased risk of secondary cancer occurring within the radiation field after radiotherapy treatment [Citation8,Citation9].
Conventionally, two ventro–dorsal opposing photon fields have been used to cover the flank target volume for decades [Citation10,Citation11]. A known disadvantage of this technique is the large volume of normal tissue (NT) receiving a radiotherapy dose comparable to the tumor dose. However, highly conformal image-guided radiation therapy (IGRT) delivery techniques, such as intensity modulated radiation therapy (IMRT), volumetric modulated arc therapy (VMAT) and intensity modulated proton therapy (IMPT), enables us to deliver steep dose-gradients to the target and have therefore the potential to reduce the dose to the surrounding NT [Citation12–15]. Based on single institutional experience and international trials [Citation11,Citation16], at the department of radiotherapy of University Medical Center Utrecht (UMCU), WT patients undergoing flank irradiation are currently treated with VMAT.
To guarantee tumor bed (TB) coverage and organs at risk (OARs) sparing, safety margins are employed during treatment planning to compensate for uncertainties related to the location of these structures. Most of IGRT treatments are currently performed using online cone-beam computed tomography (CBCT) guidance [Citation17]. Despite CBCT imaging offers adequate bone contrast for patient positioning prior treatment, the exact position and deformation of the TB and OARs might go undetected due to the poor soft-tissue contrast. Magnetic resonance imaging (MRI) yields superior soft-tissue visualization allowing for the identification of organ motion and physiological changes without patient radiation burden [Citation18]. In the last few years, MRI-guided systems for real-time IGRT [Citation19–22] have been introduced into clinics with the goal of reducing treatment safety margins, due to the better soft-tissue visualization and online plan adaptation [Citation18,Citation19]. These systems seem promising in the pediatric population, for whom there is a particular concern for NT sparing to minimize the risk of radiation-induced complications.
Given the prospective advantages of MRI-guided treatments and considering the availability of an MRI-linear accelerator (MRL) system using IMRT delivery at UMCU, the aim of this study was to assess the potential benefit of using the MRI-guided IMRT (IMRTMRI) workflow instead of the clinical CBCT-guided VMAT (VMATCBCT) workflow to treat WT patients. Both the potential margin reduction of the planning target volume (PTV) and its dosimetric impact were evaluated.
Materials and methods
Patients and imaging characteristics
After institutional review board approval (WAG/mb/17/008865), data from 15 consecutive patients (mean age: 3; range 1–8 years) with WT undergoing flank irradiation between April 2015 and October 2016 at the department of radiotherapy of UMCU was included (). After induction chemotherapy, a nephrectomy was performed. During surgery, four titanium clips were placed at the superior, lateral, medial and inferior borders of the tumor.
Table 1. Patient, tumor, treatment and imaging characteristics.
For treatment preparation, post-operative 4-dimensional CT (4D-CT) and MRI scans were taken for each patient in treatment position (see Supplementary material, Figure S1). The 4D-CT scans were obtained using a 16-, 40-, or 64- channel detector scanner (Brilliance, Philips Medical Systems, Best, The Netherlands) with 3 mm slice thickness. Each respiratory cycle during free-breathing was captured as a series of ten equally spaced traces. Furthermore, the planning-CT was obtained by taking the pixel-by-pixel average of the ten phases of the 4D-CT. MRI scans (T1- (T1w) and T2-weighted (T2w)) were acquired using a 1.5T Philips Achieva MR scanner (Philips Medical Systems, Best, The Netherlands). The T1w-MRI scans were obtained using a transversal gradient echo sequence with fat saturation and 1.5 mm slice thickness. The scans were repeated following the administration of gadolinium contrast agent. The T2w-MRI scans were acquired using a turbo spin echo sequence with 0.8 mm slice thickness. The planning-CT and MRI scans were rigidly registered using an in-house software [Citation23]. Patient repositioning during treatment was performed by acquiring daily pre-treatment CBCT scans using the Elekta XVI 4.5.1 on-board CBCT imaging system (Elekta, Stockholm, Sweden) (see Supplementary material, Figure S1). Patient positioning was corrected online using the automated treatment table movement. For every other fraction, post-treatment CBCT scans were acquired for each patient as standard of care [Citation24]. All pre- and post-treatment CBCT scans were registered to the planning-CT using the automated rigid registration algorithm available clinically on the XVI software [Citation25]. A clipbox defined around the target and the vertebra volume was used to guide the registration.
Target volumes and OARs definition
The gross tumor volume (GTV) and OARs were delineated, according to the department protocol, by one radiation oncologist. The GTV was delineated using the MRI scans and consisted of the TB and the lymph nodes, if applicable. For treatment planning purposes, the GTV was rigidly copied to the planning-CT. The clinical target volume (CTV) was created by expanding the GTV by 10 mm [Citation11]. To account for the uncertainty introduced by patient breathing, an individual and direction-specific internal target volume (ITV) was defined by measuring the surgical clips center of mass (CoM) displacements between the maximum expiration and inspiration phases of the 4D-CT scans [Citation24]. OARs were contoured using the planning-CT.
PTVmean determination
Both VMATCBCT and IMRTMRI plans were optimized using the PTV concept to account for the geometric accuracy of the treatment chain, inter-fraction motion and patient set-up uncertainties. A flowchart with all the steps of the uncertainty analysis is represented in . For more details on the methodology we refer to [Citation24]. A mean PTV (PTVmean) expansion defined around the clinical ITV was calculated per workflow.
Figure 1. Stages of the uncertainty analysis and imaging modalities used for the PTVmean estimation of the two considered workflows: the clinical VMATCBCT and the prospective IMRTMRI.
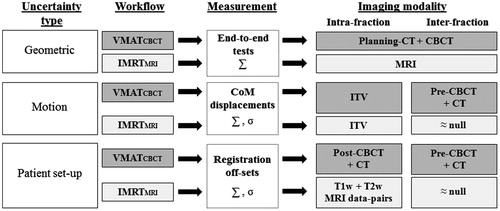
Geometric accuracy
For the VMATCBCT workflow, the overall geometric accuracy of the treatment chain, excluding patient-specific factors, was estimated by calculating the displacement of measured and planned dose profiles obtained using a phantom consisting of two Perspex slabs in which a piece of Gafchromic EBT3 film (Ashland ISP, Wayne, NJ) was inserted [Citation26]. The phantom underwent all steps of the patient treatment chain. For the IMRTMRI workflow, the overall geometric accuracy was estimated by measuring the geometric fidelity and the geometric in vivo delivery accuracy of the treatments performed on the MRL. For the geometric fidelity, the distortions of the MRI protocols were measured using a diameter spherical volume of 300 mm and a vendor provided 3D geometric quality assurance fidelity phantom (Philips Medical Systems, Best, The Netherlands) [Citation27]. The geometric in vivo delivery accuracy was validated by calculating the bony structures directional shift between the portal images of the IMRT segments and the MRI-based calculated projections [Citation19]. MRI-based projections were calculated by deformably registering the planning-CT to the MRI of the patient in treatment position. Additionally, the estimated geometric fidelity and in vivo delivery accuracy uncertainties were combined in quadrature.
Motion uncertainties
Inter-fraction motion uncertainties were related to the TB motion between treatment fractions.
For the VMATCBCT workflow, the inter-fraction uncertainty was assessed by measuring the clips CoM displacements between the pre-treatment CBCT scans and the planning-CT [Citation24].
For the IMRTMRI workflow, the inter-fraction uncertainty was assumed to be null as online daily re-planning would be available for this workflow.
Patient set-up uncertainties
Patient set-up uncertainties were related to the patient movement during and between treatment fractions.
For the VMATCBCT workflow, the intra- and inter-fraction uncertainties were calculated by measuring the clinical registration off-sets between the post-treatment and the pre-treatment CBCT scans () and the planning-CT [Citation24], respectively.
For the IMRTMRI workflow, the intra-fraction uncertainty was calculated by measuring the rigid registration off-sets between the T1w-MRI scans (pre- and post-enhanced), acquired with a mean time interval of 25 min, and the T2w-MRI and the post-enhanced T1w-MRI scans, acquired with a mean time interval of 33 min () [Citation23]. The mean time interval between the MRI scans acquisition was within the range of current clinical MRI-guided workflows using online real-time treatment adaptation [Citation28]. The inter-fraction uncertainty was assumed to be null as online daily re-planning would be available for this workflow.
Finally, systematic (∑) and random (σ) errors were calculated for each uncertainty type [Citation29,Citation30]. For the inter-fraction motion uncertainty in the VMATCBCT workflow, ∑ and σ errors were calculated for each clip. The mean ∑ and σ computed among the four clips were summed in quadrature and used for the margin estimation. For both workflows, the PTVmean was obtained using the van Herk formula (2.5∑ + 0.7σ) [Citation30].
Treatment planning
Both VMATCBCT and IMRTMRI plans were calculated on a clinical 3D treatment planning system (TPS) (Monaco, Elekta, Stockholm, Sweden) using the clinical delineations. VMATCBCT plans were based on a 10MV full-arc and IMRTMRI plans on seven 7MV flattening filter free (FFF) co-planar beams (30, 75, 135, 181, 225, 285, 330 degrees) applied to the same isocenter. For more details regarding the beam characterization of the MRL we refer to [Citation31]. For these plans, optimization was done with a 1.5T magnetic field turned-on to realistically simulate an MRL treatment [Citation19]. The total prescribed doses ranged from 14.4 to 25.2 Gy ().
To reduce the risk of asymmetric skeletal growth [Citation6], a homogeneous dose was aimed for the vertebra volume adjacent to the PTV. According to our clinical practice, both VMATCBCT and IMRTMRI plans needed to fulfill the V70-80% > 95–98% constraint on the vertebra to achieve the dose homogeneity.
For each patient and workflow, plans were generated using five ITV-PTV margin scenarios: PTVmean ± 0, 1, and 2 mm, to quantify the dosimetric differences if the employed margin would differ from the estimated PTVmean. All plans, were optimized to achieve the same level of PTV coverage: V95% > 99%.
To discard the possibility that differences in beam energy, beam configuration and delivery technique could influence the results, for both VMATCBCT and IMRTMRI plans the following scenarios were considered: (1) VMATCBCT plans optimized using the same PTV margin (PTVmean), the same beam configuration and different beam energies (6 and 10 MV); (2) IMRTMRI plans optimized using the same PTV margin (PTVmean) and the beam configuration of the clinical linac (10MV) and the MRL (7MV); (3) VMATCBCT and IMRTMRI plans optimized using the same PTV margin (3 mm), the same beam energy and beam configuration.
Dose distribution evaluation
Mean dose (Dmean) and dose-volume histogram (DVH) metrics were computed to assess ITV coverage, OARs and NT sparing.
For the ITV, D98%, Dmean, D2% and V95% were calculated. For the OARs, Dmean and D2% were computed. For the NT, the V>95%, V>2Gy, and the NT integral dose (NTID) were calculated. The NTID was defined as [Citation32]:
whereVNT is the body volume subtracting the ITV volume and ρ the body density which was assumed to be uniform (1 g/cm3).
For the statistical analysis, a Wilcoxon test (p<.01) was performed between the VMATCBCT and IMRTMRI plans optimized using the PTVmean.
Results
Calculated ∑ and σ errors for each uncertainty type are shown in . The estimated PTVmean was 5 mm for the VMATCBCT and 3 mm for the IMRTMRI workflows in each orthogonal direction.
Table 2. Calculated systematic (∑) and random (σ) errors for each uncertainty and the PTVmean for both VMATCBCT and IMRTMRI workflows.
For both workflows, the ITV coverage was unaffected by the margin decrease with a mean V95% of 100% for all scenarios (). Furthermore, Dmean of the OARs progressively decreased along with the margin (, ). The mean reduction of the OARs Dmean between the largest and the smallest margin scenarios was down to 9% for the VMATCBCT (range 0.3 – 2.4 Gy) and to 10% for the IMRTMRI (range 0.1 – 2.9 Gy) workflows. In the boxplots (), a large inter-patient variability in all margin scenarios can be observed, which was dependent on the TB location (see Supplementary material, Table S1).
Figure 2. Boxplots of the Dmean to the OARs for both VMATCBCT (in gray) and IMRTMRI (in white) workflows and all margin scenarios. Plans optimized with the PTVmean are indicated by the red box. Note that the y-axes differ in range.
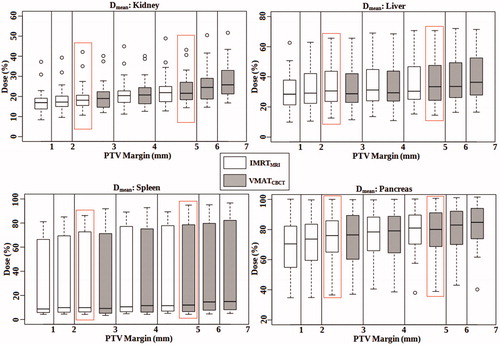
Table 3. DVH parameters and NTID results (%) per each margin scenario for both VMATCBCT and IMRTMRI workflows. Mean and standard deviation (SD) results are shown.
For the PTVmean, a mean reduction of the Dmean to the OARs (range 0.1 – 2.3 Gy) was achieved with the IMRTMRI compared to the VMATCBCT workflow: 3.4 ± 2.4% (P<.01) for the kidney, 3.4 ± 2.1% (p<.01) for the liver, 2.8 ± 3.0% (p<.01) for the spleen and 4.9 ± 3.8% (p<.01) for the pancreas, respectively.
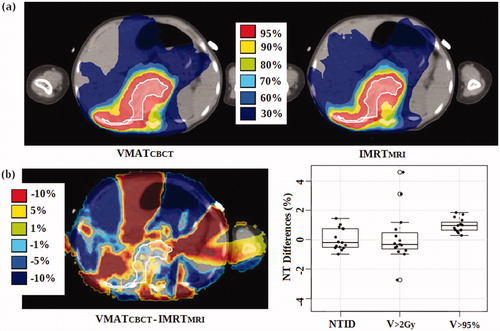
In addition, a decrease in NT dose was obtained with the margin reduction (). The mean reduction of the NTID between the largest and the smallest margin scenarios was 2.8 ± 1.3% for the VMATCBCT (range 1.4 – 6.7%) and 2.3 ± 0.9% for the IMRTMRI (range 1.1 – 4.0%) workflows. For the PTVmean, a mean reduction of 0.1 ± 0.7% (range −1.0 – 1.5%, p = .9) for the NTID, of 0.2 ± 1.8% (range −2.7 – 4.6%, p = .6) for the V>2Gy and of 1.0 ± 0.5% (range 0.3 – 1.9%, p<.01) for the V>95% was achieved with the IMRTMRI compared to the VMATCBCT workflow (). For the same PTV expansion, the VMATCBCT workflow denotes equal or even better NT sparing than the IMRTMRI, in particular for the low dose region (V>2Gy).
Figure 3. Dose comparison of a transversal planning-CT slice of one patient (a) and dose, NTID and NT volume differences (b) between the VMATCBCT and IMRTMRI workflows optimized with the PTVmean. The ITV is shaded in white (prescribed dose = 14.4 Gy).
Regarding the effect of different beam energy, beam configuration and delivery technique on the final dose distributions, significant differences were found for the NT dosimetric parameters (NTID and V>2Gy) only for scenario three (see Supplementary material, Tables S2–S4).
Discussion
The purpose of this study was to show the potential reduction of the PTV margin and its dosimetric impact on the target, OARs and NT when having available MRI-guidance in an IMRTMRI workflow compared to the clinical VMATCBCT workflow. To the authors’ knowledge this is the first study evaluating the dosimetric effect of treating pediatric patients on an MRL system.
The PTV margin was defined taking into account the geometric accuracy of the treatment chain, inter-fraction motion and patient set-up uncertainties. An isotropic reduction of 2 mm was calculated when using the IMRTMRI instead of the VMATCBCT workflow.
Potential limitations of the uncertainty analysis presented in this work are (1) the assumption of null inter-fraction uncertainties for the IMRTMRI workflow and (2) the omission of the delineation uncertainty from the PTV margin recipe for both workflows. For the IMRTMRI workflow, null inter-fraction uncertainties were assumed as with MRL systems accurate online soft-tissue tracking and re-planning accounting for the daily anatomy is possible. Nevertheless, the authors are aware that the assumption of null inter-fraction uncertainties might be optimistic as errors resulting from the daily plan adjustments, with online re-optimization, or the estimation of Hounsfield units (HUs) from the MRI data, for the dose calculation purposes, might still occur. To minimize the online re-optimization uncertainties, a new TPS generation is being developed at the department of radiotherapy of UMCU to compensate for intra- and inter-fraction patient anatomical changes in a fast online re-planning application [Citation33–Citation35]. For the conversion of MRI intensity values to HUs, there are currently two methods reported in literature: (1) using the planning-CT deformably registered to the MRI [Citation19,Citation28,Citation36] or (2) using the so-called synthetic or pseudo CTs [Citation37,Citation38]. For these two approaches, dosimetric inaccuracies were reported to be on average 0.4% [Citation19] and −0.6% [Citation38]. A future investigation will focus on estimating uncertainties in calculating doses on synthetic CTs for the same patient category. Furthermore, as mentioned previously, the systematic target delineation uncertainty was not included in the PTV margin calculation in this study. Estimating inter-observer delineation variability for pediatric cases is even more difficult than for adults as a result of the small number of patients treated in each center, the broad spectrum of pediatric tumors, the lack of common guidelines and the individual patient’s specific needs [Citation39,Citation40]. Thus, for the assessment of the exact PTV expansion, an estimation of the delineation uncertainty and a larger patient cohort would be necessary for both workflows. In addition, for the IMRTMRI workflow patient data obtained from clinical MRI-guided treatments would be required to estimate the magnitude of the inter-fraction uncertainties. Acquiring patient imaging data on a device which is not clinical yet is however not feasible for children due to the stringent ethical regulations associated to this patient group. Trying to overcome these limitations, treatment planning was performed for five different margin scenarios in order to investigate the dosimetric differences between plans optimized with a smaller or larger PTV expansion (to ± 2 mm) than the estimated PTVmean. For both workflows, mean differences between the largest and the smallest margin scenario were only up to 10% for the OARs Dmean and 3% for the NTID.
Additionally, instead of using an ITV, a better OAR and NT sparing might be achieved for the IMRTMRI workflow when including intra-fraction information, measured using 4D-MRI scans, into the online re-planning application. In literature, it was previously showed that with an online re-planning framework more conformal dose distributions were generated when compared to a treatment plan optimized using a safety margin [Citation35]. When using the IMRTMRI workflow, as the TB is discernable on MRI for this patient group, uncertainties related to the estimation of the breathing motion by using surgical clips as surrogates would be eliminated.
In this study, we established that the ITV coverage was unaffected and the OARs Dmean and NTID progressively decreased along with a stepwise margin reduction. For the PTVmean, significant differences in dosimetry were denoted between the two workflows. A decrease down to 16% on the Dmean to the OARs was found for the IMRTMRI workflow. Moreover, a large inter-patient variability in all margin scenarios was denoted, especially for the liver and spleen, which might indicate that some patients would benefit more from the IMRTMRI workflow than others depending on the TB location. However, as a better sparing of the unique remaining kidney and pancreas are two of the more essential concerns during radiotherapy of WT patients due to the risk of developing renal complications and metabolic syndrome [Citation5,Citation7], compromising the doses to the remaining organs can be allowed. Besides the magnitude of the safety margin, beam energy, beam configuration and the chosen delivery technique might also impact the quality of the final dose distribution. This hypothesis was tested by optimizing both VMATCBCT and IMRTMRI plans for different planning scenarios. Despite the MRL system has geometric accuracy levels that are twice as large when compared to clinical linacs, significant differences were only found for the NT in scenario three. Thus, NT doses are affected by the delivery technique chosen and not by the beam energy and configuration. As VMAT requires less monitor units and shorter treatment delivery times than IMRT, a similar or even better NT sparing is expected with VMAT. In the future, improvements on the OARs and NT sparing might be achieved by implementing a VMAT delivery on the MRL systems.
In this study, the reduction of the PTV margin and consequently the significant decrease of both OARs doses and NT volume receiving dose values comparable to the tumor dose (V>95%), has been demonstrated when using the IMRTMRI instead of the clinical VMATCBCT workflow. Assuming that children are at particular risk of developing radiation-induced late effects as they are more sensitive to radiation than adults, the IMRTMRI workflow would be more dosimetrically favorable than the current clinical VMATCBCT workflow. However, as with any new technology, cost is a potential limiting factor for the use of the MRL and the authors are well aware that it is not widely available for clinical use yet.
Ideally, a comprehensive assessment of follow-up chronic toxicity in pediatric patients is required to take advantage of all the state-of-the-art radiotherapy delivery techniques such as VMATCBCT, IMRTMRI and IMPT. With IMPT with pencil beam scanning there is hope of reducing both radiation-induced late effects and the chances of developing secondary cancer as a result of the unique dose-deposition pattern characterized by the minimal/zero exit dose [Citation14,Citation15,Citation41]. A future dosimetric investigation will focus on the potential benefits of treating pediatric patients with IMPT over the IMRTMRI and the VMATCBCT workflows.
Conclusions
To the author’s knowledge this is the first study evaluating the effect of treating pediatric patients with MRI-guided routines when compared to the clinical VMATCBCT workflow. Imaging data collected during radiotherapy demonstrated that with the IMRTMRI workflow the PTV margin could be reduced isotropically down to 2 mm. Furthermore, the IMRTMRI workflow reduces the doses to the OARs and NT while maintaining target coverage when compared to VMATCBCT treatments.
Supplemental Material
Download PDF (451.5 KB)Disclosure statement
No potential conflict of interest was reported by the authors.
Related Research Data
References
- Pastore G, Znaor A, Spreafico F. Malignant renal tumours incidence and survival in European children (1978-1997): report from the Automated Childhood Cancer Information System project. Eur J Cancer. 2006;42:2103–2114.
- Pritchard-Jones K, Bergeron C, de Camargo B, et al. Omission of doxorubicin from the treatment of stage II-III, intermediate-risk Wilms’ tumour (SIOP WT 2011): an open-label, non-inferiority, randomised controlled trial. Lancet. 2015;386:1156–1164.
- Jereb B, Burgers JM, Tournade MF, et al. Radiotherapy in the SIOP (International Society of Pediatric Oncology) nephroblastoma studies: a review. Med Pediatr Oncol. 1994;22:221–227.
- Sasso G, Greco N, Murino P, et al. Late toxicity in Wilms tumor patients treated with radiotherapy at 15 years of median follow-up. J Pediatr Hematol Oncol. 2010;32:264–267.
- Ritchey ML, Green DM, Thomas PRM, et al. Renal failure in Wilms' tumor patients: a report from the National Wilms' Tumor Study Group. Med Pediatr Oncol. 1996;26:75–80.
- Rate WR, Butler MS, Robertson WW, et al. Late orthopedic effects in children with Wilms' tumor treated with abdominal irradiation. Med Pediatr Oncol. 1991;19:265–268.
- van Waas M, Neggers S, Raat H, et al. Abdominal Radiotherapy: a major determinant of metabolic syndrome in nephroblastoma and neuroblastoma survivors. PLoS One 2012;7:522–537.
- Taylor AJ, Winter DL, Pritchard-Jones K, et al. Second primary neoplasms in survivors of Wilms’ tumour- A population-based cohort study from the British Childhood Cancer Survivor Study. Int J Cancer. 2008;122:2085–2093.
- Breslow NE, Lange JM, Friedman DL, et al. Secondary malignant neoplasms after Wilms tumor: an international collaborative study. Int J Cancer. 2010;127:657–666.
- Gross RE, Neuhauser EBD. Treatment of mixed tumors of the kidney in childhood. Pediatrics 1950;6:843–852.
- De Kraker J, Graf N, Pritchard-Jones K, et al. Nephroblastoma clinical trial and study SIOP 2001, Protocol. Siop RTSG 2001.
- Bosarge CL, Ewing MM, DesRosiers CM, et al. A dosimetric comparison of whole-lung treatment techniques in the pediatric population. Medical Dosimetry. 2016;41:126–130.
- Shaffer R, Vollans E, Vellani R, et al. A radiotherapy planning study of rapid arc, intensity modulated radiotherapy, three-dimensional conformal radiotherapy, and parallel opposed beams in the treatment of pediatric retroperitoneal tumors. Pediatr Blood Cancer. 2011;56:16–23.
- Hillbrand M, Georg D, Gadner H, et al. Abdominal cancer during early childhood: A dosimetric comparison of proton beams to standard and advanced photon radiotherapy. Radiother Oncol. 2008;89:141–149.
- Vogel J, Lin H, Both S, et al. Pencil beam scanning proton therapy for treatment of retroperitoneum after nephrectomy for Wilms tumor: a dosimetric comparison study. Pediatr Blood Cancer. 2017;64:39–45.
- van den Heuvel-Eibrink MM, Hol JA, Pritchard-Jones K, et al. Position paper: rationale for the treatment of Wilms tumour in the UMBRELLA SIOP-RTSG 2016 protocol. Nat Rev Urol. 2017;14:743–752.
- Jaffray DA, Siewerdsen JH, Wong JW, et al. Flat-panel cone-beam computed tomography for image-guided radiation therapy. Int J Radiat Oncol Biol Phys. 2002;53:1337–1349.
- Lagendijk JJW, Raaymakers BW, Van den Berg CAT, et al. MR guidance in radiotherapy. Phys Med Biol. 2014;59:349–369.
- Raaymakers BW, Jürgenliemk-Schulz IM, Bol GH, et al. First patients treated with a 1.5T MRI-Linac: clinical proof of concept of a high-precision, high-field MRI guided radiotherapy treatment. Phys Med Biol. 2017;62:41–50.
- Mutic S, Dempsey JF. The ViewRay system: magnetic resonance-guided and controlled radiotherapy. Semin Radiat Oncol. 2014;24:196–199.
- Fallone BG. The rotating biplanar linac-magnetic resonance imaging system. Semin Radiat Oncol. 2014;24:200. 2;
- Keall PJ, Barton M, Crozier S, et al. Linac Program, including contributors from Ingham Institute, Illawarra Cancer Care Centre, Liverpool Hospital, Stanford University, Universities of Newcastle, Queensland, Sydney, Western Sydney, and Wollongong. The Australian magnetic resonance imaging-linac program. Semin Radiat Oncol. 2014;24:203–206.
- Bol GH, Kotte AN, van der Heide UA, et al. Simultaneous multi-modality ROI delineation in clinical practice. Comput Methods Programs Biomed. 2009;96:133–140.
- Guerreiro F, Seravalli E, Janssens GO, et al. Intra- and inter-fraction uncertainties during IGRT for Wilms’ tumor. Acta Oncol. 2018;19:1–9.
- Elekta AB. Elekta Synergy clinical user manual XVI R5.0. Stockholm: Elekta; 2013.
- Wopereis A, Ishakoglu I, Seravalli E, et al. A cost-effective and fast end-to-end test for treatment accuracy evaluation. Radiother Oncol. 2015;119:910–911. [Abstract]
- Tijssen RHN, Crijns SPM, Bluemink SS, et al. Comprehensive MRI Acceptance Testing & Commissioning of a 1.5T MR-Linac: Guidelines and Initial Results. Radiother Oncol 2017;123:130–131. [Abstract]
- Fischer-Valuck BW, Henke L, Green O, et al. Two-and-a-half-year clinical experience with the world's first magnetic resonance image guided radiation therapy system. Adv Radiat Oncol. 2017;2:485–493.
- van Herk M. Errors and margins in radiotherapy. Semin Radiat Oncol. 2004;14:52–64.
- van Herk M, Remeijer P, Rasch C, et al. The probability of correct target dosage: dose-population histograms for deriving treatment margins in radiotherapy. Int J Radiat Oncol Biol Phys. 2000;47:1121–1135.
- Woodings SJ, Bluemink JJ, de Vries JHW, et al. Beam characterisation of the 1.5 T MRI-linac . Phys Med Biol. 2018;63:085015.
- D'Souza WD, Rosen II. Nontumor integral dose variation in conventional radiotherapy treatment planning. Med Phys. 2003;30:2065–2071.
- Kontaxis C, Bol GH, Lagendijk JJW, et al. A new methodology for inter- and intrafraction plan adaptation for the MR-linac. Phys Med Biol. 2015;60:7485–7497.
- Kontaxis C, Bol GH, Lagendijk JJW, et al. Towards adaptive IMRT sequencing for the MR-linac. Phys Med Biol. 2015;60:2493–2509.
- Kontaxis C, Bol GH, Lagendijk JJW, et al. Towards fast online intrafraction replanning for free-breathing stereotactic body radiation therapy with the MR-linac. Phys Med Biol. 2017;62:7233–7248.
- Acharya S, Fischer-Valuck BW, Kashani R, et al. Online magnetic resonance image guided adaptive radiation therapy: first clinical applications. Int J Radiat Oncol Biol Phys. 2016;94:394–403.
- Tenhunen M, Korhonen J, Kapanen M, et al. MRI-only based radiation therapy of prostate cancer: workflow and early clinical experience. Acta Oncol. 2018;28:1–6.
- Koivula L, Kapanen M, Seppälä T, et al. Intensity-based dual model method for generation of synthetic CT images from standard T2-weighted MR images - generalized technique for four different MR scanners. Radiother Oncol. 2017;125:411–419.
- Coles CE, Hoole ACF, Harden SV, et al. Quantitative assessment of inter-clinician variability of target volume delineation for medulloblastoma: quality assurance for the SIOP PNET 4 trial protocol. Radiother Oncol. 2003;69:189–194.
- Padovani L, Huchet A, Claude L, et al. Inter-clinician variability in making decisions in pediatric treatment: A balance between efficacy and late effects. Radiother Oncol. 2009;93:372–376.
- Hall EJ, Phil D. Intensity-modulated radiation therapy, protons and the risk of secondary cancer. Int J Radiat Oncol Biol Phys. 2006;65:1–7.