
 ?Mathematical formulae have been encoded as MathML and are displayed in this HTML version using MathJax in order to improve their display. Uncheck the box to turn MathJax off. This feature requires Javascript. Click on a formula to zoom.
Abstract
Background: There is significant evidence that DCE-MRI may have the potential to provide clinically useful biomarkers of the outcome of locally advanced cervical carcinoma. However, there is no consensus on how to analyze DCE-MRI data to arrive at the most powerful biomarkers. The purpose of this study was to analyze DCE-MRI data of cervical cancer patients by using the Brix pharmacokinetic model and to compare the biomarkers derived from the Brix analysis with biomarkers determined by non-model-based analysis [i.e., low-enhancing tumor volume (LETV) and tumor volume with increasing signal (TVIS)] of the same patient cohort.
Material and methods: DCE-MRI recordings of 80 patients (FIGO stage IB–IVA) treated with concurrent cisplatin-based chemoradiotherapy were analyzed voxel-by-voxel, and frequency distributions of the three parameters of the Brix model (ABrix, kep, and kel) were determined. Moreover, risk volumes were calculated from the Brix parameters and termed RV-ABrix, RV-kep, and RV-kel, where the RVs represent the tumor volume with voxel values below a threshold value determined by ROC analysis. Disease-free survival (DFS) and overall survival (OS) were used as measures of treatment outcome.
Results: Significant associations between the median value or any other percentile value of ABrix, kep, or kel and treatment outcome were not found. However, RV-ABrix, RV-kep, and RV-kel correlated with DFS and OS. Multivariate analysis revealed that the prognostic power of RV-ABrix, RV-kep, and RV-kel was independent of well-established clinical prognostic factors. RV-ABrix, RV-kep, and RV-kel correlated with each other as well as with LETV and TVIS.
Conclusion: Strong biomarkers of the outcome of locally advanced cervical carcinoma can be provided by subjecting DCE-MRI series to pharmacokinetic analysis using the Brix model. The prognostic power of these biomarkers is not necessarily superior to that of biomarkers identified by non-model-based analyses.
Introduction
Locally advanced cancer of the uterine cervix is generally treated with aggressive concurrent cisplatin-based chemoradiotherapy. This treatment results in a 5-year survival rate of 65‒70% and a high incidence of severe treatment-induced complications, including hematological and gastrointestinal toxicities [Citation1–3]. There is significant evidence that treatment failure is associated with low oxygen tension and extensive hypoxia in the primary tumor [Citation4–6]. Novel biomarkers are needed to improve the outcome of cervical carcinoma, and these biomarkers should mirror the biological properties of the tumor tissue that cause treatment failure [Citation7]. Furthermore, they should be assessed with a method that is acceptable to most patients and, in addition, fits in easily with well-established diagnostic examinations. Dynamic contrast-enhanced magnetic resonance imaging (DCE-MRI) is such a method. This method is noninvasive, allows repeated examinations, and has the advantage that the entire tumor volume can be analyzed. Preclinical and clinical investigations have suggested that DCE-MRI may provide information on the blood supply and oxygenation of cervical carcinomas [Citation8–11]. Furthermore, there is some evidence that the outcome of cervical cancer may be associated with parameters derived from DCE-MRI recordings [Citation12–18]. However, a robust DCE-MRI method for predicting the outcome of cervical carcinoma has not been developed thus far.
By subjecting DCE-MRI data of locally advanced cervical cancer to non-model-based analysis, we have identified two parameters that are strong prognostic factors for disease-free survival (DFS) and overall survival (OS): low-enhancing tumor volume (LETV) [Citation19] and tumor volume with increasing signal (TVIS) [Citation20]. In these studies, signal intensity was measured in individual tumor voxels and plotted versus time after contrast agent administration. LETV was derived from the early phase of the signal intensity-versus-time curves (SITCs), and this parameter represents the tumor volume that shows low contrast enhancement during the first 60 s of the curves [Citation19]. TVIS was derived from the late phase of the SITCs, and this parameter refers to the tumor volume that shows increased contrast enhancement during a 6-min-long interval, from 3 min to 9 min after contrast agent administration [Citation20]. Both parameters were assumed to be a measure of the extent of tumor hypoxia [Citation19,Citation20], and by measuring LETV and TVIS in the same patient cohort, LETV was found to have stronger prognostic power than TVIS [Citation20].
It has been suggested that DCE-MRI series should be analyzed by using pharmacokinetic models rather than non-model-based strategies, primarily because pharmacokinetic models are developed on the basis of physiological and biological properties of the imaged tissue [Citation21]. Two pharmacokinetic models are used frequently to analyze DCE-MRI data: the Tofts model [Citation22,Citation23] and the Brix model [Citation24–26]. In the study reported in this communication, the DCE-MRI data of the patients included in our studies of LETV and TVIS were analyzed by using the Brix model. There was a dual purpose of the study: to investigate whether the parameters of the Brix model may provide prognostic information on the outcome of cervical carcinoma and to compare the prognostic power of these parameters with that of LETV and TVIS.
Material and methods
Patients and treatment
Eighty evaluable patients with untreated locally advanced cervical cancer (FIGO stage IB through IVA) admitted to the Norwegian Radium Hospital between September 2004 and May 2007 were included in the study. The DCE-MRI data of these patients have been analyzed previously to determine LETV and TVIS [Citation19,Citation20]. The demographics of the patients are shown in . The investigation was approved by the regional committee of medical research ethics in southern Norway and was conducted in accordance with the Declaration of Helsinki. Written informed consent was obtained from each patient.
Table 1. Patient characteristics (N = 80).
The patients were all treated with concurrent cisplatin-based chemoradiotherapy with curative intent. External beam radiation therapy was given in 25 fractions during a period of 5 weeks to a total dose of 50 Gy to the primary tumor, parametria, and adjacent pelvic wall and 45 Gy to the rest of the pelvic region. In addition, 5 to 6 fractions of intracavitary brachytherapy with a dose of 4.2 Gy per fraction were given to Point A. Cisplatin (40 mg/m2) was given weekly with a maximum of 6 courses during the radiation therapy period. The primary endpoints were DFS, defined as the time to local or distant relapse or death from the date of diagnosis, and OS, defined as the interval from diagnosis to death.
MRI and image analysis
The imaging was carried out prior to treatment and has been described in detail previously [Citation19]. Briefly, the pelvis was scanned with axial T2-weighted fast spin echo sequences, and afterwards, DCE-MRI was conducted by using an axial T1-weighted spoiled gradient recalled sequence [repetition time: 160 ms; echo time: 3.5 ms; flip angle: 90°; number of excitations (number of averages): 1; field of view: 20 × 20 cm2; image matrix: 256 × 256; slice thickness: 5 mm; slice spacing: 6 mm; voxel size: 0.78 × 0.78 × 5.0 mm3; temporal resolution: 29 s; total sampling time: 10 min]. Three precontrast images were acquired, and contrast agent was injected manually in a bolus dose of 0.1 mmol/kg Gd-DTPA during a period of ∼3 s. Tumor volume and lymph node status were assessed by examining the T2-weighted images in the open source dicom viewer Osirix.
The DCE-MR images were analyzed voxel-by-voxel by using in-house-made software developed in Matlab. Minor tumor movements during the DCE-MRI were corrected for by manually moving postcontrast regions of interest (ROIs) to fit with the coordinates of the first precontrast image. To diminish any unwanted influence by tumor necrosis and the cervical and uterine cavities, voxels showing signal intensities in the T2-weighted images consistent with the presence of water or air were excluded from analysis using threshold-based criteria [Citation19,Citation20].
Plots of relative signal intensity versus time were generated voxelwise, and by using the Levenberg–Marquardt least squares minimization method, curves were fitted to the data by using the adapted Brix equation [Citation22]:
where S(t) is the signal intensity at time t, S(0) is the signal intensity in the pre-contrast images, ABrix is the amplitude, kep is the transfer rate of Gd-DTPA from tissue to plasma, and kel is the clearance rate of Gd-DTPA from plasma. The curve fitting was conducted without using any constraints to the numeric values of ABrix, kep, and kel. ABrix, kep, and kel frequency distributions were then calculated for each tumor, and all tumor voxels were included in the frequency distributions (i.e., no voxels were excluded based on the parameter numeric values).
Statistical analysis
Because it is generally observed that standard first-line treatment fails in approximately one-third of the patients with locally advanced cervical cancer [Citation1], associations between treatment outcome and Brix parameters were investigated by dividing the patient cohort into two groups consisting of one third and two-thirds of the patients [Citation19]. Thus, the outcome of the 26 patients with the lowest ABrix values was compared with that of the 54 patients with the highest ABrix values, and similar comparisons were carried out for kep and kel. Kaplan–Meier curves were compared by using the log-rank test. Univariate and multivariate Cox proportional hazard analyses were used to evaluate prognostic parameters with respect to DFS and OS. The Spearman rank order correlation test was used to search for correlations between parameters. Probability values of p < .05 were considered significant.
Results
The outcome of the patients included in this study was similar to that generally reported for locally advanced cervical cancer treated with concurrent cisplatin-based chemoradiotherapy. The actuarial DFS and OS at 5 years were 62% and 66%, respectively. Tumor progression or recurrence was documented in 23 patients, six in the pelvis alone, three in the pelvis and para-aortic lymph nodes or distant sites, and 14 in para-aortic lymph nodes or distant sites alone. Two patients were clinically disease-free after further treatment, whereas 21 patients died from their recurrences (20 patients) or intercurrent disease (one patient).
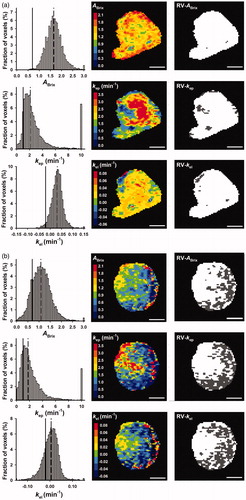
The Brix pharmacokinetic model was found to be suitable for analyzing the DCE-MRI data. Thus, the signal intensity data of single tumor voxels were well fitted by the model. This is illustrated in Supplementary Figure 1, which shows representative curve fits for a high-enhancing and a low-enhancing tumor. In general, the numeric values of ABrix, kep, and kel were higher in high-enhancing than in low-enhancing tumors. However, the intratumor and intertumor heterogeneities in the Brix parameters were substantial. This is illustrated in , which shows parametric maps and frequency distributions for two representative tumors, one high-enhancing and one low-enhancing tumor.
Figure 1. ABrix, kep, and kel frequency distributions, parametric images, and binary images highlighting RV-ABrix, RV-kep, and RV-kel in dark gray for a representative high-enhancing (a) and a representative low-enhancing (b) tumor. The frequency distributions include all tumor voxels, whereas the images refer to a single slice through the tumor. To avoid presenting the entire tail of the frequency distributions, the last column of the distributions represents the percentage of voxels with ABrix ≥ 3.0, kep ≥ 10, and kel ≥ 0.15. The vertical lines in the frequency distributions represent the threshold ABrix, kep, and kel values of RV-ABrix, RV-kep, and RV-kel (solid lines) and the median values of ABrix, kep, and kel (dashed lines). Scale bars: 1 cm.
To investigate whether the Brix parameters may have the power to provide prognostic information on the outcome of cervical carcinoma, detailed analyses of the ABrix, kep, and kel frequency distributions were conducted. First, the ABrix, kep, and kel values at each integer percentile of the frequency distributions were calculated, and a log-rank test was carried out for each percentile to assess whether any of the Brix parameters could discriminate between the two patient groups, using DFS and OS as endpoints. Plots of the log-rank p-value versus percentile were generated, and the plots revealed that none of the Brix parameters showed robust percentile ranges with p-values <.05, regardless of endpoint (Supplementary Figure 2).
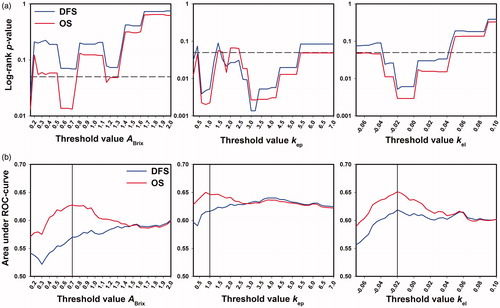
Moreover, the number of voxels and, accordingly, the tumor volumes with voxel values below a threshold value were calculated for a wide range of threshold values, using values from 0.05 to 2.0 (increments of 0.05) for ABrix, values from 0.2 to 7.0 (increments of 0.2) for kep, and values from −0.07 to +0.10 (increments of 0.005) for kel. A log-rank test was carried out for each threshold value to investigate whether any of the volumes could discriminate between the two patient groups. Plots of the log-rank p-value versus ABrix, kep, and kel threshold value were then generated for DFS and OS, and these plots showed significant ranges of threshold values with p < .05 (). Receiver operating characteristic (ROC) analysis was carried out to determine the optimal threshold values, and in , the area under the ROC-curve is plotted versus threshold value for each Brix parameter. The optimal threshold values, corresponding to the largest area under the ROC-curve, were determined to be 0.7 for ABrix, 1.0 for kep, and −0.02 for kel.
Figure 2. The tumor volumes with voxel values below a threshold value were calculated from the ABrix, kep, and kel frequency distributions of all tumors, using a range of threshold values for each parameter, and for each threshold value, the outcome of the patients with large volumes were compared with that of the patients with small volumes, using the log-rank test with DFS and OS as endpoints. ROC analysis was carried out to find the threshold values with the highest discriminative power. The plots show the log-rank p-value (a) and the area under the ROC-curve (b) versus ABrix, kep, and kel threshold value for DFS and OS. The dashed lines in (a) represent a significance level of p = .05. The vertical lines in (b) represent the optimal threshold values for ABrix, kep, and kel.
Binary maps showing the distribution of voxels with values of ABrix, kep, and kel above or below the optimal threshold value are presented in together with the corresponding ABrix, kep, and kel maps of a high-enhancing and a low-enhancing tumor. The binary maps are representative for the tumors analyzed in this study and illustrate three important observations. First, the number of voxels with parameter values below the optimal threshold value was lower in the high-enhancing tumor () than in the low-enhancing tumor (). Second, the low enhancing tumor regions were generally contiguous (). Third, the distribution of the voxels with parameter values below the optimal threshold value was similar in the ABrix, kep, and kel maps (). The tumor volumes with parameter values below the optimal threshold value [i.e. the presumed risk volumes (RVs)] were termed RV-ABrix, RV-kep, and RV-kel, and the binary maps in suggest substantial similarity between the RVs identified by the three Brix parameters. This impression was verified by analyzing the relationships between the different RVs. As shown in Supplementary Figure 3, significant linear correlations were found between RV-ABrix and RV-kep (p < .0001), RV-ABrix and RV-kel (p < .0001), and RV-kep and RV-kel (p < .0001).
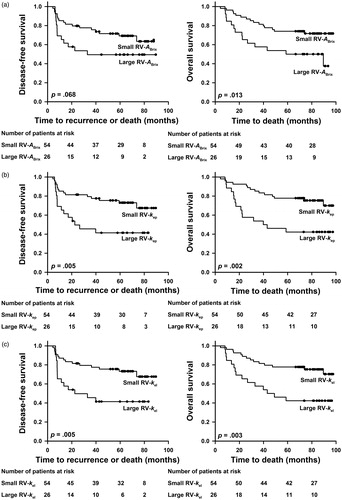
Kaplan–Meier plots for DFS and OS based on RV-ABrix, RV-kep, and RV-kel are shown in . The patients with large RV-ABrix did worse than those with small RV-ABrix, with 5-year DFS of 49% versus 69% (p = .068) and 5-year OS of 50% versus 74% (p = .013). Similarly, the patients with large RV-kep and those with small RV-kep showed 5-year DFS of 41% and 73%, respectively (p = .005) and 5-year OS of 42% and 78%, respectively (p = .002). Furthermore, the 5-year survival rates of the patients with large RV-kel and those with small RV-kel were 41% and 73%, respectively (DFS: p = .005) and 42% and 78%, respectively (OS: p = .003).
Figure 3. Kaplan–Meier curves for DFS and OS stratified by RV-ABrix (a), RV-kep (b), and RV-kel (c). The cutoffs separating small (N = 54) from large (N = 26) RVs were 1.3 cm3 for RV-ABrix, 0.9 cm3 for RV-kep, and 1.1 cm3 for RV-kel.
Univariate Cox regression analysis revealed that the DCE-MRI–derived parameters RV-ABrix, RV-kep, and RV-kel had significant impact on DFS and OS. A similar analysis of clinical parameters showed that DFS and OS were influenced significantly by tumor volume and FIGO stage, but not by lymph node status, tumor histology, and patient age (). Multivariate Cox regression analysis including tumor volume, FIGO stage, lymph node status, and RV-ABrix, RV-kep, or RV-kel showed that none of the clinical parameters were independent prognostic factors; however, the prognostic power of FIGO stage was of borderline significance. Furthermore, the analysis revealed that RV-kep and RV-kel were independent prognostic factors for DFS and RV-ABrix, RV-kep, and RV-kel were independent prognostic factors for OS ().
Table 2. Cox regression analysis of clinical and Brix parameters.
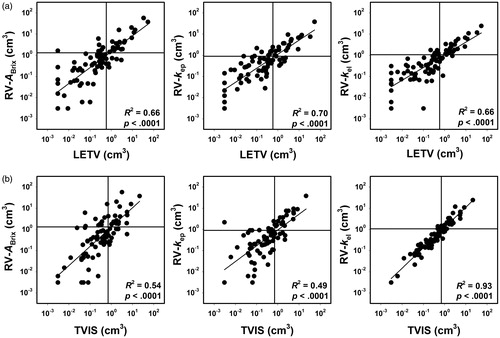
Our study demonstrates that Brix analysis of DCE-MRI data may provide prognostic information on the outcome of locally advanced cervical carcinoma. By using the DCE-MRI data of the same patient cohort, we have shown previously that prognostic information also may be achieved by non-model-based analyses of the data [Citation19,Citation20]. Two parameters showing significant prognostic power were identified in these studies, LETV and TVIS. Similar to RV-ABrix, RV-kep, and RV-kel, LETV and TVIS represent tumor subvolumes, and the relationships between these subvolumes were investigated by plotting RV-ABrix, RV-kep, and RV-kel versus LETV and TVIS (). Significant correlations were found between the RVs derived from the Brix analysis and the subvolumes derived from the non-model-based analyses (p < .0001 for all combinations). The horizontal and vertical lines in indicate the border between small and large values of RV-ABrix, RV-kep, and RV-kel and the border between small and large values of LETV and TVIS, respectively. The figure shows that the vast majority of the patients are stratified into the same risk group by the Brix model-based RVs and the non-model-based RVs. Furthermore, Kaplan–Meier plots for DFS and OS based on LETV and TVIS have been published previously [Citation19,Citation20], and these plots are very similar to the Brix parameter-based Kaplan–Meier plots in .
Figure 4. Log scale plots of RV-ABrix, RV-kep, and RV-kel versus LETV (a) and TVIS (b). Six tumors had LETV of zero, and to be able to include these tumors in the log scale plots, they were assigned LETV corresponding to one voxel. The patient cohort was divided into two groups consisting of one third and two-thirds of the patients, and the discrimination levels are indicated by horizontal lines for RV-ABrix, RV-kep, and RV-kel and by vertical lines for LETV and TVIS. Points refer to individual tumors. Curves were fitted to the points by linear regression analysis.
Discussion
Several studies have suggested that DCE-MRI may provide data associated with the outcome of locally advanced cervical carcinoma [Citation12–18]. Different methods of analyzing the DCE-MRI data were used in these studies, and many of the studies relied on a small number of patients. Therefore, robust DCE-MRI parameters that can predict the outcome of cervical cancer have not been identified and validated up to now. In the current investigation, we analyzed pretreatment DCE-MRI series of 80 evaluable cervical cancer patients by using the Brix pharmacokinetic model, and the analysis provided parametric RVs that were independent prognostic factors for DFS and OS.
Pharmacokinetic analysis of DCE-MRI data of human tumors is currently being carried out by using the Brix or the Tofts model [Citation22–25]. There are advantages and disadvantages with both models. The Tofts model requires assessment of an arterial input function, and the measurement of high-quality individual arterial input functions is a demanding task. The main advantage of the Brix model is that an arterial input function is not needed for the curve fitting. However, the curve fitting with the Brix model requires three independent parameters, whereas only two independent parameters are needed when using the standard Tofts model. In most clinical studies, pharmacokinetic analysis of DCE-MRI data is based on signal intensities, and the analysis requires assessment of the signal intensity prior to and for several minutes after the contrast agent administration. It may be advantageous to base pharmacokinetic analysis on contrast agent concentrations rather than signal intensities, and this can be done by using the Tofts model, but requires measurement of contrast agent relaxivity and voxelwise assessment of precontrast T1-values (T10-map).
The Brix and Tofts models were developed to make it possible to derive information on the physiological characteristics of tissues from DCE-MRI series [Citation22–25]. For a given tumor, the numeric values of the model parameters are determined by the pulse sequence being used and the tumor physiology. Under standardized imaging conditions which is usually used in the diagnostics of a specific malignant disease, the parameters vary among tumors because the tumors have developed different physiological characteristics during growth.
Regardless of model, pharmacokinetic analyses of tumor DCE-MRI series are based on mathematical descriptions of SITCs, and the shape of SITCs is determined by the uptake and washout of contrast agent in the imaged tissue. Theoretically, the uptake is determined by the perfusion and the vessel wall permeability, and it has been revealed that the uptake of high-molecular-weight agents is limited primarily by the permeability whereas the uptake of low-molecular-weight agents like Gd-DTPA is limited primarily by the perfusion [Citation23]. Importantly, a recent clinical study of cervical carcinoma concluded that differences in the uptake of Gd-DTPA between tumors are dominated by differences in tumor perfusion, whereas the influence of differences in vessel wall permeability are non-essential [Citation27]. This conclusion is in accordance with the results of comparative preclinical perfusion and DCE-MRI studies [Citation28,Citation29].
The Brix pharmacokinetic model describes SITCs by three parameters: ABrix, kep, and kel. ABrix (the amplitude) is influenced significantly by several physiological properties of tumors, including the size of the extravascular extracellular space, the permeability of the vessel walls, and blood perfusion [Citation22–25]. The magnitude of kep (the transfer rate of Gd-DTPA from tissue to plasma) is determined by several vascular parameters, including vessel permeability, vessel density, and blood perfusion [Citation24,Citation25]. Also, the magnitude of kel (the clearance rate of Gd-DTPA from plasma) is influenced significantly by the perfusion of the imaged tissue, particularly in malignant tissues [Citation17,Citation24]. Thus, a common feature of the three Brix parameters is that they are determined partly by the blood perfusion. However, even though the numeric values of the Brix parameters are influenced significantly by the perfusion of the imaged tumor, none of the parameters should be considered to be adequate measures of tumor blood perfusion. This is particularly important to notice when the DCE-MRI is conducted at a low temporal resolution, as was the case in the study reported here.
DCE-MRI data of cervical carcinoma have been analyzed by the use of the Brix model in a few previous studies, and these studies provided discordant results. Hawighorst et al [Citation12,Citation30] suggested that median kep may have the potential to predict the outcome of cervical cancer and that high values of median kep are associated with poor outcome. They suggested further that poor outcome was a consequence of highly elevated angiogenic activity [Citation12,Citation30,Citation31]. Loncaster et al [Citation32], on the other hand, did not find any association between the outcome of cervical cancer and median kep. However, they provided evidence that poor outcome could be associated with low values of median ABrix and that low values of median ABrix were associated with large fractions of hypoxic tissue. Andersen et al [Citation17] used locoregional control and progression-free survival as endpoints and reported plots similar to those in Supplementary Figure 2. They found distinct percentile intervals for ABrix and kel, but not for kep, where low parameter values were associated with poor treatment outcome. Halle et al [Citation33] reused the DCE-MRI data published by Andersen et al [Citation17], and they showed that low ABrix was associated with hypoxia-induced gene expression.
The findings reported in the current communication differ from those referred to above. In our study, significant associations between the outcome of treatment and the parameters of the Brix model were not found for any percentile value of ABrix, kep, or kel. It is particularly important to note that our analysis provided data that were not in accordance with the data published by Andersen et al [Citation17] and Halle et al [Citation33], who reported significant associations between treatment outcome and the numeric values of ABrix in the 20–30 percentile range of the frequency distributions. There were some minor differences between their and our study. They used a 5-min-long DCE-MRI sequence with a temporal resolution varying from 15 s to 1 min, whereas we used a 10-min-long DCE-MRI sequence with a fixed temporal resolution of 29 s. Further, the Brix parameters were constrained to ABrix ≥ 0, kep ≥ 0, and kel ≥ 0 in their study, whereas these parameters were allowed to vary freely in our study. Thus, negative values of the Brix parameters were accepted in our study, and as shown in the original paper of Brix et al [Citation24], negative kel values are a prerequisite for achieving good curve fits for voxels showing increasing signal intensity during the entire observation period. Finally, the patient cohort was divided into two equally sized groups in their study, whereas in our study, the patients were divided into two groups consisting of one third and two-thirds of the patients. However, most of these differences are probably not important, because we have, as far as possible, also analyzed our data by using the criteria reported by Andersen et al [Citation17] and Halle et al [Citation33] without being able to reproduce their conclusions.
Although significant associations between DFS or OS on the one hand and ABrix, kep, or kel on the other could not be found in our study, our study revealed that RV-ABrix, RV-kep, and RV-kel correlated with treatment outcome. Multivariate analysis including tumor volume, FIGO stage, lymph node status, and RV-ABrix, RV-kep, or RV-kel showed that these RVs were strong independent prognostic factors of DFS and OS. Consequently, Brix analysis of DCE-MRI data may provide biomarkers of the outcome of cervical carcinoma, and the predictive power of parametric RVs may be strong compared with that of percentile parameter values.
Noteworthy, significant correlations were found between RV-ABrix, RV-kep, and RV-kel, most likely because ABrix, kep, and kel are all influenced significantly by tumor blood perfusion, and furthermore, poor DFS and OS were associated with high values of the three RVs. High RV-ABrix, RV-kep, and RV-kel may be equivalent to a large number of voxels with inadequate blood perfusion, suggesting that these RVs reflect the extent of tumor hypoxia. This suggestion is consistent with the general finding that poor outcome of locally advanced cervical cancer is associated with low oxygen tension in the primary tumor [Citation4–6].
It has been recommended that DCE-MRI data of tumors should be analyzed by using pharmacokinetic models rather than non-model-based methods [Citation34–36]. In previous studies of the patients included in the current study, we showed that LETV and TVIS are associated with DFS and OS [Citation19,Citation20]. LETV and TVIS represent RVs that are determined from DCE-MRI data by using non-model-based methods. There were strong correlations between RV-ABrix, RV-kep, and RV-kel on the one hand and LETV and TVIS on the other, and furthermore, most patients were stratified into the same risk group by the model-based and the non-model-based RVs. Consequently, the predictive power of RVs determined by Brix analysis may not necessarily be superior to that of RVs assessed by non-model-based analyses.
By analyzing DCE-MRI data of a cohort of 80 patients with cervical carcinoma, we have identified five prognostic factors (RV-ABrix, RV-kep, RV-kel, LETV, TVIS) that are independent of established clinical prognostic factors. These DCE-MRI–derived prognostic factors represent tumor RVs, are correlated with each other, and have specific advantages and disadvantages as prognostic factors for cervical cancer. The primary disadvantages of the Brix-derived RVs are that they require long scanning times up to 10 min and that their quantification requires assessment of threshold values for ABrix, kep, and kel. The threshold values depend on signal intensity, and because signal intensities vary depending upon MR scanner and MR protocol, each radiology department has to determine and use its own threshold values. Calculation of LETV also requires assessment of signal intensity-dependent threshold values, but this RV has the advantage that it can be calculated from short-term DCE-MRI series lasting for 1–2 min, a significant advantage since scan time is a limiting factor in most radiology departments. Similar to the Brix-derived RVs, TVIS has the disadvantage that long scanning times are required, but this RV has the advantage that its assessment is independent of signal intensity, implying that observations can be compared easily across institutions.
It should be noticed that our study has some important limitations. First, T2-weighted images were used to determine ROIs, including tumor delineation and exclusion of image regions influenced by tumor necrosis and cervical cavities. Although tumor tissue, in general, can be distinguished easily from the normal cervix parenchyma and adjacent air in T2-weighted images and the ROIs were determined by two experienced radiologists, there may have been some uncertainties in the assessment of the ROIs. Second, the DCE-MRI was carried out more than 10 years ago when the spatial and temporal resolutions of the recordings were poorer than today due to MR scanner limitations. Moreover, only 80 patients were included in the study. Although there were few events (relapse or death) during the observation period, this patient number was sufficiently high to achieve interesting results. Nevertheless, our study is merely a hypothesis-generating study, and the results reported here warrant validation in a second patient population in a study utilizing a modern scanner enabling high temporal and spatial resolutions.
In summary, DCE-MRI data of locally advanced cervical carcinoma were subjected to pharmacokinetic analysis using the Brix model. The median or any other percentile value of the frequency distributions of the three Brix parameters were not associated with DFS or OS. However, significant associations between RVs calculated from the frequency distributions and treatment outcome were detected. The prognostic power of the RVs was independent of the conventional clinical prognostic factors of locally advanced cervical cancer.
Supplemental Material
Download PDF (49.8 KB)Acknowledgments
Hans Henrik Lien and Kjetil Knutstad, Department of Radiology and Nuclear Medicine, are thanked for their active cooperation in the study.
Disclosure statement
The authors report no conflicts of interest. The authors alone are responsible for the content and writing of the paper.
Additional information
Funding
Related Research Data
References
- Green JA, Kirwan JM, Tierney JF, et al. Survival and recurrence after concomitant chemotherapy and radiotherapy for cancer of the uterine cervix: a systematic review and meta-analysis. Lancet. 2001;358:781–786.
- Barbera L, Thomas G. Management of early and locally advanced cervical cancer. Semin Oncol. 2009;36:155–169.
- Klopp AH, Eifel PJ. Biological predictors of cervical cancer response to radiation therapy. Semin Radiat Oncol. 2012;22:143–150.
- Höckel M, Knoop C, Schlenger K, et al. Intratumoral pO2 predicts survival in advanced cancer of the uterine cervix. Radiother Oncol. 1993;26:45–50.
- Fyles AW, Milosevic M, Wong R, et al. Oxygenation predicts radiation response and survival in patients with cervix cancer. Radiother Oncol. 1998;48:149–156.
- Sundfør K, Lyng H, Tropé CG, et al. Treatment outcome in advanced squamous cell carcinoma of the uterine cervix: relationships to pretreatment tumor oxygenation and vascularization. Radiother Oncol. 2000;54:101–107.
- Barwick TD, Taylor A, Rockall A. Functional imaging to predict tumor response in locally advanced cervical cancer. Curr Oncol Rep. 2013;15:549–558.
- Ellingsen C, Hompland T, Galappathi K, et al. DCE-MRI of the hypoxic fraction, radioresponsiveness, and metastatic propensity of cervical carcinoma xenografts. Radiother Oncol. 2014;110:335–341.
- Lyng H, Vorren AO, Sundfør K, et al. Intra- and intertumor heterogeneity in blood perfusion of human cervical cancer before treatment and after radiotherapy. Int J Cancer. 2001;96:182–190.
- Cooper RA, Carrington BM, Loncaster JA, et al. Tumour oxygenation levels correlate with dynamic contrast-enhanced magnetic resonance imaging parameters in carcinoma of the cervix. Radiother Oncol. 2000;57:53–55.
- Lyng H, Vorren AO, Sundfør K, et al. Assessment of tumor oxygenation in human cervical carcinoma by use of dynamic Gd-DTPA-enhanced MR imaging. J Magn Reson Imaging. 2001;14:750–756.
- Hawighorst H, Weikel W, Knapstein PG, et al. Angiogenic activity of cervical carcinoma: assessment by functional magnetic resonance imaging-based parameters and a histomorphological approach in correlation with disease outcome. Clin Cancer Res. 1998;4:2305–2312.
- Yamashita Y, Baba T, Baba Y, et al. Dynamic contrast-enhanced MR imaging of uterine cervical cancer: pharmacokinetic analysis with histopathologic correlation and its importance in predicting the outcome of radiation therapy. Radiology. 2000;216:803–809.
- Zahra MA, Hollingsworth KG, Sala E, et al. Dynamic contrast-enhanced MRI as a predictor of tumour response to radiotherapy. Lancet Oncol. 2007;8:63–74.
- Yuh WTC, Mayr NA, Jarjoura D, et al. Predicting control of primary tumor and survival by DCE MRI during early therapy in cervical cancer. Invest Radiol. 2009;44:343–350.
- Semple SIK, Harry VN, Parkin DE, et al. A combined pharmacokinetic and radiologic assessment of dynamic contrast-enhanced magnetic resonance imaging predicts response to chemoradiation in locally advanced cervical cancer. Int J Radiat Oncol Biol Phys. 2009;75:611–617.
- Andersen EKF, Hole KH, Lund KV, et al. Pharmacokinetic parameters derived from dynamic contrast enhanced MRI of cervical cancers predict chemoradiotherapy outcome. Radiother Oncol. 2013;107:117–122.
- Mannelli L, Patterson AJ, Zahra M, et al. Evaluation of nonenhancing tumor fraction assessed by dynamic contrast-enhanced MRI subtraction as a predictor of decrease in tumor volume in response to chemoradiotherapy in advanced cervical cancer. AJR Am J Roentgenol. 2010;195:524–527.
- Lund KV, Simonsen TG, Hompland T, et al. Short-term pretreatment DCE-MRI in prediction of outcome in locally advanced cervical cancer. Radiother Oncol. 2015;115:379–385.
- Lund KV, Simonsen TG, Kristensen GB, et al. Pretreatment late-phase DCE-MRI predicts outcome in locally advanced cervix cancer. Acta Oncol. 2017;56:675–681.
- Sourbron SP, Buckley DL. Classic models for dynamic contrast-enhanced MRI. NMR Biomed. 2013;8:1004–1027.
- Tofts PS. Modeling tracer kinetics in dynamic Gd-DTPA MR imaging. J Magn Reson Imaging. 1997;7:91–101.
- Tofts PS, Brix G, Buckley DL, et al. Estimating kinetic parameters from dynamic contrast-enhanced T1-weighted MRI of a diffusable tracer: standardized quantities and symbols. J Magn Reson Imaging. 1999;10:223–232.
- Brix G, Semmler W, Port R, et al. Pharmacokinetic parameters in CNS Gd-DTPA enhanced MR imaging. J Comput Assist Tomogr. 1991;15:621–628.
- Hoffman U, Brix G, Knopp MV, et al. Pharmacokinetic mapping of the breast: a new method for dynamic MR mammography. Magn Reson Med. 1995;33:506–514.
- Brix G, Bahner ML, Hoffmann U, et al. Regional blood flow, capillary permeability, and compartmental volumes: measurement with dynamic CT—initial experience. Radiology. 1999;210:269–276.
- Dickie BR, Rose CJ, Kershaw LE, et al. The prognostic value of dynamic contrast-enhanced MRI contrast agent transfer constant Ktrans in cervical cancer is explained by plasma flow rather than vessel permeability. Br J Cancer. 2017;116:1436–1443.
- Graff BA, Benjaminsen IC, Brurberg KG, et al. Comparison of tumor blood perfusion assessed by dynamic contrast-enhanced MRI with tumor blood supply assessed by invasive imaging. J Magn Reson Imaging. 2005;21:272–281.
- Egeland TAM, Simonsen TG, Gaustad JV, et al. Dynamic contrast-enhanced magnetic resonance imaging of tumors: preclinical validation of parametric images. Radiat Res. 2009;172:339–347.
- Hawighorst H, Knapstein PG, Weikel W, et al. Angiogenesis of uterine cervical carcinoma: characterization by pharmacokinetic magnetic resonance parameters and histological microvessel density with correlation to lymphatic involvement. Cancer Res. 1997;57:4777–4786.
- Hawighorst H, Knapstein PG, Knopp MV, et al. Uterine cervical carcinoma: comparison of standard and pharmacokinetic analysis of time-intensity curves for assessment of tumor angiogenesis and patient survival. Cancer Res. 1998;58:3598–3602.
- Loncaster JA, Carrington BM, Sykes JR, et al. Prediction of radiotherapy outcome using dynamic contrast enhanced MRI of carcinoma of the cervix. Int J Radiat Oncol Biol Phys. 2002;54:759–767.
- Halle C, Andersen E, Lando M, et al. Hypoxia-induced gene expression in chemoradioresistant cervical cancer revealed by dynamic contrast-enhanced MRI. Cancer Res. 2012;72:5285–5295.
- Tatum JL, Kelloff GJ, Gillies RJ, et al. Hypoxia: importance in tumor biology, noninvasive measurement by imaging, and value of its measurement in the management of cancer therapy. Int J Radiat Biol. 2006;82:699–757.
- Hylton N. Dynamic contrast-enhanced magnetic resonance imaging as an imaging biomarker. J Clin Oncol. 2006;24:3293–3298.
- Pacheco-Torres J, López-Larrubia P, Ballesteros P, et al. Imaging tumor hypoxia by magnetic resonance methods. NMR Biomed. 2011;24:1–16.