
Abstract
Objective: Delineation variation of esophageal tumors remains a large source of geometric uncertainty. In the present study, we investigated the inter- and intra-observer variation in esophageal gross tumor volume (GTV) delineation and the impact of endoscopically implanted fiducial markers on these variations.
Material/Methods: Ten esophageal cancer patients with at least two markers endoscopically implanted at the cranial and caudal tumor borders and visible on the planning computed tomography (pCT) were included in this study. Five dedicated gastrointestinal radiation oncologists independently delineated GTVs on the pCT without markers and with markers. The GTV was first delineated on pCTs where markers were digitally removed and next on the original pCT with markers. Both delineation series were executed twice to determine intra-observer variation. For both the inter- and intra-observer analyses, the generalized conformity index (CIgen), and the standard deviation (SD) of the distances between delineated surfaces (i.e., overall, longitudinal, and radial SDs) were calculated. Linear mixed-effect models were used to compare the without and with markers series (α = 0.05).
Results: Both the inter- and intra-observer CIgen were significantly larger in the series with markers than in the series without markers (p < .001). For the series without markers vs. with markers, the inter-observer overall SD, longitudinal SD, and radial SD was 0.63 cm vs. 0.22 cm, 1.44 cm vs. 0.42 cm, and 0.26 cm vs. 0.18 cm, respectively (p < .05); moreover, the intra-observer overall SD, longitudinal SD, and radial SD was 0.45 cm vs. 0.26 cm, 1.10 cm vs. 0.41 cm, and 0.22 cm vs. 0.15 cm, respectively (p < .05).
Conclusion: The presence of markers at the cranial and caudal tumor borders significantly reduced both inter- and intra-observer GTV delineation variation, especially in the longitudinal direction. Our results endorse the use of markers in GTV delineation for esophageal cancer patients.
Introduction
Chemoradiotherapy plays a vital role in the curative treatment of esophageal cancer [Citation1]. The primary objective of esophageal cancer radiotherapy (RT) is to deliver a high radiation dose to the target volume while minimizing the dose delivered to the organs at risk (OARs). Target volume definition remains one of the largest sources of geometric uncertainty. For esophageal cancer it can be notoriously challenging to visualize the true tumor extent on an RT planning computed tomography (pCT) scan, particularly in longitudinal direction, which hampers an accurate delineation of the gross tumor volume (GTV). Ideally, delineation variation is determined on clinical target volume (CTV) delineations. However, the esophageal CTV can also be determined by elective lymph nodes, this is thus more a matter of clinical judgment than delineation variation. Since the cranial and caudal border of the CTV, which is – according to common practice – directly extrapolated from the delineated GTV in longitudinal direction, an accurate GTV in the longitudinal direction is crucial for CTV extent determination. The geometric uncertainty in delineation can lead to an underestimation or overestimation of the tumor extent and hence to the risk of inadequate tumor treatment or increased radiation damage to OARs. Moreover, with future studies focusing at dose escalation of the GTV, a precise GTV delineation will become even more vital.
18F-fluoro-2-deoxy-d-glucose (FDG) positron emission tomography (PET) provides additional information on metabolic activity (i.e., glucose utilization) of the tumor. Addition of this FDG-PET information to a diagnostic CT is found to be useful for diagnosis and staging of esophageal cancer [Citation2]. FDG-PET has shown limited specificity visualizing esophageal tumor extent, since it cannot differentiate tumor from inflammation. Moreover, the nonstandardized way of incorporating FDG-PET/CT information in the tumor delineation process, results in FDG-PET/CT having limited value in GTV delineation [Citation3,Citation4]. Furthermore, a recent study trying to decrease the variation in esophageal target volume delineation by adding PET/CT information was not able to show a significant reduction [Citation5]. Therefore, the use of FDG-PET/CT in target volume delineation remains subject of debate and still requires further clinical validation.
Endoscopic ultrasound (EUS) examination is still considered the most reliable tool for assessment of macroscopic tumor extension and correlates significantly with pathological tumor extension [Citation6,Citation7]. The use of endoscopy/EUS-guided implanted markers at the cranial and caudal borders of the macroscopical tumor enables projection of the (echo)endoscopic tumor extent onto the pCT [Citation8–10], with no macroscopic spread found beyond (echo)endoscopically determined tumor borders [Citation11]. We hypothesized that this addition of information to the otherwise poorly discriminative pCT images may reduce the observer variation in target volume delineation.
The aim of this study was to quantify the inter- and intra-observer variation of esophageal GTV delineation. Further, we investigated whether the use of markers placed on endoscopically determined cranial and caudal tumor borders can significantly reduce the inter- and intra-observer delineation variation in esophageal cancer patients.
Material and methods
Patients and observers
Data of 10 patients with curable esophageal cancer (cT1-4a, N0-1, M0) treated with RT, were retrospectively selected and anonymized (). All patients were selected from an earlier pilot study population concerning feasibility of marker placement [Citation8]. Each patient had at least two markers implanted (i.e., one at the cranial tumor border and one at the caudal tumor border) by a dedicated gastroenterologist, clearly visible on the pCT, as is clinical practice at our center. This procedure was reported in detail in an earlier study [Citation8]. The goal was to place the markers exactly on the cranial and caudal tumor borders; however, this was not always feasible (e.g., due to stenosis). Because the marker position was aimed to indicate true tumor extent, the distance between the placed marker and the (echo)endoscopic tumor border was measured by fluoroscopy; the tumor border was indicated by the tip of the (echo)endoscopy after marker implantation in the fluoroscopy. This distance between the marker and the tumor border was reported in the medical file available during delineation. Three types of markers were implanted: a solid gold marker (5 mm long with diameter of 0.43–0.64 mm; Cook Medical, Limerick, Ireland), a flexible coil-shaped gold marker (5–10 mm long with diameter of 0.35 mm; Visicoil, Core Oncology, Santa Barbara, CA, USA), or an injectable radiopaque hydrogel marker (0.4 mL; TraceIT Tissue Marker; Augmenix Inc, Waltham, MA, USA).
Table 1. Patient, tumor, and fiducial marker characteristics.
In the data selection process, tumor locations (proximal, mid-thoracic, distal) and preexistent primary tumor visibility on the pCT as determined by an experienced radiologist (i.e., poorly visible or clearly visible) were taken into account, pursuing a heterogeneous mix of esophageal tumor characteristics (). Tumor location was classified according to the American Joint Committee on Cancer [Citation12]. Tumor visibility on pCT was qualitatively rated (5-point ordinal scale) by an experienced gastrointestinal radiologist, whereas tumors with a score of 1–2 were considered poorly visible, and tumors with a score 3–5 as clearly visible. The visibility score was unknown to the observers. A total of five experienced radiation oncologists with 4–28 years of experience in gastrointestinal oncology (i.e., observers) participated in this study.
CT dataset
For each patient, a 3D pCT scan (120 kV, mA depending per patient (SmartA; General Electric Company, Waukesha, WI, USA) (mean 180 mA), axial slice thickness 2.5 or 3.0 mm, in-plane pixel size 1.0 × 1.0 mm) ranging from the bottom edge of the mandible to the lower border of the kidneys was available.To be able to delineate on both pCTs with and without markers in the same patient, we digitally removed the markers from the originally acquired pCTs using in-house developed software. The graphical user interface of the software was designed to follow several steps. First, on the pCT with markers, for each marker a region of interest (ROI) completely encompassing the marker was manually created. Next, a second ROI that contained the esophageal wall in the vicinity of the marker was created. Third, the CT values in the first ROI were replaced with values based on the CT values in the second ROI while ensuring as best as possible the use of representative similar patterns and presence of noise [Citation13], resulting in the creation of a pCT without markers. gives an illustration of a single pCT, with and without markers.
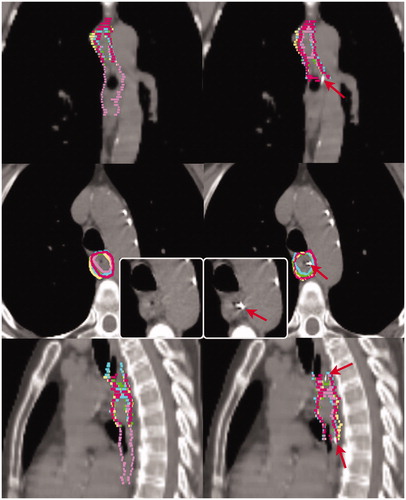
Figure 1. Delineations of patient 5 on the planning computed tomography without (left) and with markers (right). The delineations of the individual observers are indicated in different colors. The colors match the same observer throughout this work. Red arrows indicate fiducial markers. Insert demonstrates transversal slice without delineations.
Delineation protocol and study design
The GTV was defined as the macroscopically visible tumor, possible involved lymph nodes were not included. Based on all diagnostic information available (EUS/endoscopy reports and diagnostic CT), the observers delineated the GTVs on the axial slices of the pCT using Big Brother target volume delineation software [Citation14] using a strict delineation protocol (Supplementary Appendix). Sagittal and coronal views of the pCT scan were shown to the observer simultaneously. Observers were free to adjust window level/width at their own discretion.
The study consists of four delineation series: two series without markers and two with markers (Supplementary Figure A1). In the series without markers, the observers were asked to delineate the GTV on the pCT at two time points with a time interval of at least 3 weeks between the first and second time points. At least 6 weeks after completion of the series without markers, the observers were asked to delineate the GTV on the pCT with markers, twice again, under the same conditions. During this delineation series, both the fiducial markers and the information from the pCT scan were taken into account when delineating the GTV.
Inter-observer variation
Per patient, the average volume of the five GTVs and the generalized conformity index (CIgen) [Citation15] of the five GTVs were calculated using Big Brother software (Supplementary Figure A1). CIgen is defined as the ratio of the sum of the overlapping volumes between all observer pairs and the sum of the encompassing volumes between the same observer pairs, where CIgen = 0 means no overlap and CIgen = 1 means full overlap.
For each patient per series, the median GTV of the five GTVs was reconstructed using Big Brother software. This median GTV comprises the voxels delineated by at least 50% (i.e., 3 out of 5) of the observers. The surface of the median GTV (i.e., median surface) was sampled into a 3D mesh with approximately equidistant (0.5 mm) vertices. In the direction perpendicular to the median surface, the 3D distance from each vertex on the median surface to the five surfaces of the delineated GTVs was measured. Per vertex, the standard deviation (SD) of these five distances (i.e., local SD) was used as a measure of local inter-observer variation. Per patient, the inter-observer overall SD was defined as the root mean square (RMS) of all local SDs [Citation14].
In addition to the abovementioned inter-observer overall SD, we calculated the inter-observer overall SD in the longitudinal (i.e., CC) and radial (i.e., in the axial plane) direction separately. The longitudinal SD was defined as the RMS of local SDs associated with vertices sampled in the CC direction, for the most cranial and caudal slice (i.e., end) of each delineation. The radial SD was defined as the RMS of local SDs associated with vertices sampled in the axial plane, including only the axial slices of the pCT that contained delineations from all observers.
Intra-observer variation
For each patient in the two series without markers, the average volume of the two GTVs and the CIgen of the two GTVs delineated by the same observer were calculated (Supplementary Figure A1). Moreover, for each observer and each patient, based on the two GTVs, the local and overall SDs were calculated. In addition, the longitudinal and radial SDs were calculated. These measures were also calculated for the two series with markers.
Statistical comparison
To investigate whether with the use of markers a significantly different inter-/intra-observer variation is associated, linear mixed-effects models were applied to compare the series without markers to the series with markers. The series were compared in terms of inter-/intra-observer variation measures, including the average volume of GTVs, CIgen, and overall SDs as well as the longitudinal and radial SDs. In these models, the marker presence (i.e., without or with markers) was taken as a fixed effect; the patient associated with delineation time point (i.e., the first or the second time) or observer, tumor visibility (i.e., clearly or poorly visible), and cardiac involvement were taken as random effects. The same fixed effects were identified when stratifying the patient group (i.e., in the patient group with clearly and poorly visible tumors separately). All statistical comparison was done using the R software (version 3.3.2 [2016]; R Foundation for Statistical Computing, Vienna, Austria) with significance level α = 0.05 [Citation16,Citation17].
Results
Each observer made four delineations per patient, yielding a total of 200 GTV delineations. Observer 1 accidentally used incorrect diagnostic information when delineating patient 2 (Supplementary Figure A2), the delineations of this observer for patient 2 were therefore excluded. The average time interval between all delineation series was 11 weeks (range: 3–20 weeks).
Inter-observer variation
For the two series without markers versus the two with markers, the mean (range) of average volumes of the five delineated GTVs was 33.81 (10.72–89.86) cm3 vs. 35.92 (8.26–91.86) cm3 and the mean (range) of CIgen was 0.54 (0.29–0.80) vs. 0.68 (0.42–0.83). A significant difference was found in the CIgen (p < .001) for patients with poorly visible tumors on the CT scan but not for patients with clearly visible tumors. Complete results are listed in supplementary Table A1.
The pattern of local SD is very heterogeneous between patients upon visual inspection, as shown in . It is clear that the largest differences exist in the cranial and caudal regions. In the series with markers, the local SD was decreased particularly in the regions where in the series without markers a large (>1 cm) local SD was found. However, for patient 8, an increased local SD in the caudal part was found. For patient 2, a small variation remained at the curvatura minora region but was reduced compared to the delineations on pCT without markers.
Figure 2. Anterior view of the local surface distance variation (SD) over the five observers projected on the median surface of the 10 patients in the series without and with markers. Column (a) the original series (b) the repeated series.
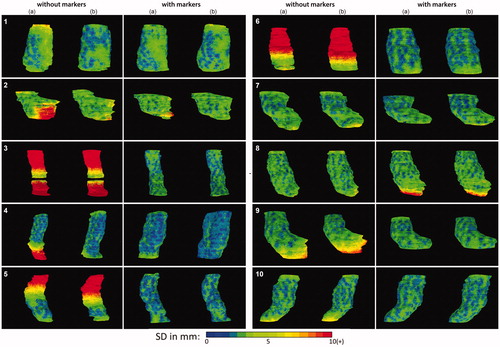
summarizes the overall, longitudinal, and radial SDs. For all 10 patients, a significant reduction (p < .001) of the overall SD, from 0.63 cm to 0.22 cm, was seen in the series with markers compared to the series without markers (). The reduction was more pronounced in the poorly visible tumors compared to the clearly visible tumors. Compared to the series without markers, the longitudinal SD at both the cranial and caudal end was significantly reduced by 1.02 cm on average for all patients (p < .001). The radial SD was 0.26 cm in the series without markers versus 0.18 cm with markers. The largest reduction in radial SD was seen at the curvatura minora in patient 2, who had a gastroesophageal junction tumor ().
Table 2. Inter-observer overall SD as well as longitudinal and radial SDs of delineations on CTs without (left columns) and with (right columns) markers.
The delineation time point showed no variance (<0.1 cm) in these linear mixed-effects models. This implies that there was no learning curve between the original and repeated delineations ( and Supplementary Table A1). Moreover, the cardiac involvement was found to have no statistically significant effect on in the inter-observer variation measures.
Intra-observer variation
For the series without markers versus with markers, the mean (range) of the average volume of the two GTVs delineated by each observer was 19.81 (6.35–88.14) cm3 vs. 18.48 (6.13–87.95) cm3 and the mean (range) of the CIgen of the two GTVs was 0.68 (0.33–0.86) vs. 0.75 (0.60–0.84). For both groups of patients with clearly and poorly visible markers, the CIgen was significantly increased in the series with markers compared to that without markers (p < .05) (Supplementary Table A2).
lists the findings concerning the intra-observer overall SDs as well as the longitudinal and radial SDs. For all patients, a significant reduction of the overall SD by 0.19 cm on average was noticed, when comparing the series with markers to those without markers (p < .01) (). The same held for patients with poorly visible tumors (p < .05) but not for patients with clearly visible tumors (p = .06). Comparison of the series with markers to those without markers indicated that the intra-observer longitudinal SD at both cranial and caudal ends was significantly reduced by 0.69 cm on average for all patients (p < .001). The intra-observer radial SD was 0.22 cm in the series without markers versus 0.15 cm in the series with markers (p < .01). Further, the cardiac involvement had no statistically significant effect on the intra-observer variation measures.
Table 3. Intra-observer overall SD as well as longitudinal and radial SDs of delineations on CTs without (left columns) and with (right columns) markers.
Discussion
To the best of our knowledge, this is the first study to quantify GTV delineation variation in esophageal cancer RT with fiducial markers. Our findings show that delineation variation is a major geometric uncertainty for esophageal cancer RT, especially in the longitudinal direction. This might lead to a clinically relevant systematic error in the treatment planning and delivery process. Marker implantation at craniocaudal tumor borders resulted in a significant reduction in both inter- and intra-observer variation, also suggesting reduced geometric uncertainty.
Target volume delineation variation is a difficult entity to grasp. Throughout literature, different kinds of parameters have been used to quantify and compare delineation variation, ranging from describing the distribution of volumes (e.g., Vmax/Vmin), to concordance measurements (e.g., Jaccard conformity index). These parameters provide different information about the delineation variation, subsequently, they cannot directly be compared [Citation18]. For esophageal cancer, limited studies reported on delineation variation. In a large pretrial quality assurance study of the SCOPE 1 trial, a large inter-observer variation was seen with a median Jaccard conformity index for GTV of 0.69 [Citation19]. An older series performed at the start of the 3D planning era, also demonstrated a large uncertainty with a Vmax/Vmin ratio up to 6 [Citation20]. A disadvantage of these parameters is that they all compare relative volumes instead of absolute distances and thus cannot be directly compared or translated into margins. This difficulty can be overcome by quantifying absolute distances and assessing both positional and volume change in a single measurement by means of the median surface distance [Citation21].
Large inter- and intra-observer overall SDs of 0.63 cm and 0.45 cm were seen in the absence of markers. Observer variations were predominantly determined in the longitudinal direction (inter-observer: 1.44 cm; intra-observer: 1.10 cm), which is obvious since GTV borders in the radial direction are more clearly visible on the pCT due to the proximity of contrasting adjacent structures (i.e., lungs, vertebrae, heart).
Addition of markers in the pCT decreased the delineation variation particularly in the longitudinal direction in both inter- and intra-observer longitudinal SDs. With largest reductions seen in patients with poorly visible tumors on pCT, suggesting that the use of markers might have had more impact in this group. Nevertheless, when the tumor flattens to mucosal level at the CC borders, it remains challenging to determine the true tumor extent, regardless of the bulkiness of the central part.
Only in one patient (patient 8), we found no reduction in inter-observer longitudinal SD by the use of markers. In this patient who also had cardiac involvement, the marker was placed 2 cm below the caudal (echo)endoscopic tumor border, yet again inducing ambiguity on true tumor extent. Nonetheless, in the other three patients receiving a marker at some distance from the (echo)endoscopic tumor border, no increase in longitudinal SD was seen. This might be explained by the fact that their markers were not placed further than 1cm from the (echo)endoscopic tumor border and no cardiac involvement was present, emphasizing the importance of marker placement on or very nearby tumor borders.
Looking at radial SD no difference with presence of markers is suspected, since markers only provide information on the tumor extent in longitudinal direction. Only for patient 2, a small reduction was seen in the radial SD between observers, possibly because markers placed in the cardia also provided information on the radial direction of the tumor extent. A significant radial SD reduction was also observed for the intra-observer variation in the series with markers compared to the series without markers. The presence of markers might have led to more confident observers, demonstrated by a significant reduction in also intra-observer overall and longitudinal SDs.
There are two different sources for target delineation variation. Foremost, different observers have different clinical judgment on what to encompass. These differences can be reduced by strict treatment protocols and delineation guidelines. Therefore, we instigated a strict delineation protocol in this study. Nonetheless, in patient 6, one observer consistently delineated a target volume extending below the delineations of the other four observers, in both series without markers, but not in the series with markers, suggesting a difference in clinical judgment (Supplementary Figure A3). If we exclude the delineations of this observer for this patient, the inter-observer overall SD would be 0.55 cm instead of 0.63 cm for all patients. Since target delineation remains prone to human errors, markers can also assist in preventing this type of geographic errors. The small difference between intra-observer and inter-observer variation is remarkable; that is, most contouring differences cannot be attributed to interpretation differences but are mainly due to the poor visibility of the border, adding an element of randomness to the delineation process without markers.
Secondly, even with the same treatment protocol and delineation guidelines, delineation is still subject to inter- and intra-observer variation. Safety margins are added to compensate for delineation variations. Since the intra-observer variation is inherently incorporated in the inter-observer variation, when calculating the PTV margin only the latter should be taken into account. Because the longitudinal CTV extent is directly extrapolated from the longitudinal GTV, in absence of pathological lymph nodes, an improvement in longitudinal GTV variation will consequently lead to an improvement in longitudinal CTV delineation variation, and thus in a reduction in PTV, because a longitudinal SD of 0.42 cm instead of 1.44 cm would be used for delineation variation in the commonly used margin recipe [Citation22]. Other uncertainties encompassed by the PTV – as quantified in earlier studies – were many times smaller than the longitudinal delineation variation without markers [Citation23,Citation24].
In addition to implantation of markers, using magnetic resonance imaging (MRI) might reduce delineation variation, as has been proven for other treatment sites [Citation25–27]. For esophageal cancer, this is an ongoing research field. There is a promising study showing an excellent correlation between histopathological findings and findings on diffusion weighted imaging scans regarding the esophageal squamous cell carcinoma GTV length [Citation28]. In the absence of an MRI-only workflow in treatment delivery, it remains necessary to register the MRI scan with the pCT and markers are still helpful for positional verification with CBCT, potentially, markers that are also visible on MRI, seem optimal [Citation29]. Problems could occur when large anatomical differences exist between both scans, which is imaginably because of its intrinsic mobility subject to gastric filling and respiratory and cardiac motion. However, when an MRI-only workflow is established, with the superior soft-tissue contrast in MRI, we predict a large potential benefit in esophageal cancer target volume delineation.
In conclusion, large inter- and intra-observer variation is seen in esophageal GTV delineation, especially in the longitudinal direction. The presence of markers at tumor borders can significantly reduce both inter- and intra-observer delineation variation in all directions. Since markers mainly assist with the determination of the cranial and caudal tumor borders, the largest reduction was seen in the longitudinal direction. Our results endorse the use of markers in esophageal GTV delineation to reduce the geometric uncertainty and hence a higher treatment accuracy.
Acknowlegdments
The authors thank Matthijs Kruis for providing the WorldMatch software and Augmenix Inc. for providing the hydrogel markers.
Disclosure statement
Mr. Jin is sponsored by Elekta. Dr. Alderliesten is involved in projects sponsored by Elekta.
References
- van Hagen P, Hulshof MCCM, van Lanschot JJB, et al. Preoperative chemoradiotherapy for esophageal or junctional cancer. N Engl J Med. 2012;366:2074–2084.
- Van Westreenen HL, Westerterp M, Bossuyt PMM, et al. Systematic review of the staging performance of 18F-fluorodeoxyglucose positron emission tomography in esophageal cancer. JCO. 2004;22:3805–3812.
- Muijs CT, Beukema JC, Pruim J, et al. A systematic review on the role of FDG-PET/CT in tumour delineation and radiotherapy planning in patients with esophageal cancer. Radiother Oncol. 2010;97:165–171.
- Thomas L, Lapa C, Bundschuh RA, et al. Tumour delineation in oesophageal cancer – a prospective study of delineation in PET and CT with and without endoscopically placed clip markers. Radiother Oncol. 2015;116:269–275.
- Nowee ME, Voncken FEM, Kotte ANTJ, et al. Gross tumour delineation on Computed Tomography and Positron Emission Tomography-Computed Tomography in oesophageal cancer: a nationwide study. Clin Transl Radiat Oncol. 2018;14:33–39.
- Gaur P, Sepesi B, Hofstetter WL, et al. Endoscopic esophageal tumor length: a prognostic factor for patients with esophageal cancer. Cancer. 2011;117:63–69.
- Wang B, Liu C, Lin C, et al. Endoscopic tumor length is an independent prognostic factor in esophageal squamous cell carcinoma. Ann Surg Oncol. 2012;19:2149–2158.
- MacHiels M, Van Hooft J, Jin P, et al. Endoscopy/EUS-guided fiducial marker placement in patients with esophageal cancer: a comparative analysis of 3 types of markers. Gastrointest. Endosc. 2015;82:641–649.
- DiMaio CJ, Nagula S, Goodman K. a, et al. EUS-guided fiducial placement for image-guided radiation therapy in GI malignancies by using a 22-gauge needle (with videos). Gastrointest Endosc. 2010;71:1204–1210.
- Fernandez DC, Hoffe SE, Barthel JS, et al. Stability of endoscopic ultrasound-guided fiducial marker placement for esophageal cancer target delineation and image-guided radiation therapy. Pract Radiat Oncol. 2013;3:32–39.
- Machiels M, van Montfoort ML, Thuijs NB, et al. PO-0812: Pathological validation of endoscopically placed fiducials on tumor borders in esophageal cancer. Radiother Oncol. 2019;133.
- Rice TW, Blackstone EH, Rusch VW. 7th edition of the AJCC Cancer Staging Manual: esophagus and esophagogastric junction. Ann Surg Oncol. 2010;17:1721–1724.
- Kruis MF, Van De Kamer JB, Sonke JJ, et al. Registration accuracy and image quality of time averaged mid-position CT scans for liver SBRT. Radiother Oncol. 2013;109:404–408.
- Steenbakkers RJHM, Duppen JC, Fitton I, et al. Observer variation in target volume delineation of lung cancer related to radiation oncologist-computer interaction: a “Big Brother” evaluation. Radiother. Oncol. 2005;77:182–190.
- Kouwenhoven E, Giezen M, Struikmans H. Measuring the similarity of target volume delineations independent of the number of observers. Phys Med Biol. 2009;54:2863–2873.
- R Core Team. R: A language and environment for statistical computing. Vienna, Austria: The R Foundation for Statistical Computing; 2013.
- Bates D, Mächler M, Bolker B, et al. Fitting linear mixed-effects models using lme4. J Statsitcal Softw 2015;67:51.
- Fotina I, Lütgendorf-Caucig C, Stock M, et al. Critical discussion of evaluation parameters for inter-observer variability in target definition for radiation therapy. Strahlenther Onkol. 2012;188:160–167.
- Gwynne S, Spezi E, Wills L, et al. Toward semi-automated assessment of target volume delineation in radiotherapy trials: the SCOPE 1 pretrial test case. Int J Radiat Oncol Biol Phys. 2012;84:1037–1042.
- Anon. Variability of target volume delineation in cervical esophageal cancer. Int J Radiat Oncol. 1998;42:277–288.
- Deurloo KEI, Steenbakkers RJHM, Zijp LJ, et al. Quantification of shape variation of prostate and seminal vesicles during external beam radiotherapy. Int. J. Radiat. Oncol. Biol. Phys. 2005;61:228–238.
- van Herk M. Errors and margins in radiotherapy. Semin Radiat Oncol. 2004;14:52–64.
- Jin P, van der Horst A, de Jong R, et al. Marker-based quantification of interfractional tumor position variation and the use of markers for setup verification in radiation therapy for esophageal cancer. Radiother Oncol. 2015;117:412–418.
- Jin P, Hulshof MCCM, de Jong R, et al. Quantification of respiration-induced esophageal tumor motion using fiducial markers and four-dimensional computed tomography. Radiother Oncol. 2016;118:492–497.
- Rasch C, Keus R, Pameijer FA, et al. The potential impact of CT-MRI matching on tumor volume delineation in advanced head and neck cancer. Int J Radiat Oncol Biol Phys. 1997;39:841–848.
- den Hartogh MD, Philippens MEP, van Dam IE, et al. MRI and CT imaging for preoperative target volume delineation in breast-conserving therapy. Radiat Oncol. 2014;9:63.
- Gurney-Champion OJ, Versteijne E, van der Horst A, et al. Addition of MRI for CT-based pancreatic tumor delineation: a feasibility study. Acta Oncol. 2017;56:923–930.
- Hou D-L, Shi G-F, Gao X-S, et al. Improved longitudinal length accuracy of gross tumor volume delineation with diffusion weighted magnetic resonance imaging for esophageal squamous cell carcinoma. Radiat Oncol. 2013;8:169.
- Gurney-Champion OJ, van Tienhoven G, et al. Visibility and artifacts of gold fiducial markers used for image guided radiation therapy of pancreatic cancer on MRI. Med Phys. 42:2638–2647.