
 ?Mathematical formulae have been encoded as MathML and are displayed in this HTML version using MathJax in order to improve their display. Uncheck the box to turn MathJax off. This feature requires Javascript. Click on a formula to zoom.
Abstract
Purpose: The aim of this work was to determine how the spatial pattern of dose in the ano-rectal wall is related to late gastro-intestinal toxicity for prostate cancer patients treated with mainly IMRT.
Patients and methods: Patients from the DUE-01 multicentre study with patient-reported (prospective) follow-up and available dosimetric data were included. Conventionally fractionated patients received 74–80 Gy and hypofractionated patients received 65–75.2 Gy. A large majority of the patients were treated with intensity-modulated radiotherapy (IMRT). Dose-surface maps (DSMs) for the anal canal and rectum as a single structure, and for the anal canal and the rectum separately, were co-registered rigidly in two dimensions and, for the patients with and without toxicity, respectively, the mean value of the dose in each pixel was calculated. A pixel-wise t-test was used to highlight the anatomical areas where there was a significant difference between the ‘mean dose maps’ of each group. Univariate models were also fitted to a range of spatial parameters. The endpoints considered were a mean grade ≥1 late fecal incontinence and a maximum grade ≥2 late rectal bleeding.
Results: Twenty-six out of 213 patients had fecal incontinence, while 21/225 patients had rectal bleeding. Incontinence was associated with a higher dose in the caudal region of the anal canal; the most relevant spatial parameter was the lateral extent of the low and medium isodoses (5–49 Gy in EQD2). Bleeding was associated with high isodoses reaching the posterior rectal wall. The spatial dose parameters with the highest AUC value (.69) were the lateral extent of the 60–70 Gy isodoses.
Conclusions: To avoid fecal incontinence it is important to limit the portion of the anal canal irradiated. Our analysis confirms that rectal bleeding is a function of similar spatial dose parameters for patients treated with IMRT, compared to previous studies on patients treated with three-dimensional conformal radiotherapy.
Introduction
Many investigators have studied the risk of rectal complications from radiotherapy in terms of dose-volume histogram (DVH) data [Citation1]. However, a limitation of a DVH is that the spatial distribution of dose is disregarded; therefore, several studies have recently considered spatial features [Citation2–17] of the three-dimensional (3D) dose distribution in order to improve the performance of predictive models. The development of ever more elaborate normal-tissue complication probability (NTCP) models is driven by the concern that a poor characterization of the dose-response relationship may unnecessarily limit the effectiveness of the treatment; a simplistic NTCP model could imply conservative dose-volume constraints to the organs-at-risk (OAR), or cause avoidable suffering through a suboptimal distribution of the dose to OAR for a given tumor dose (e.g., Ref. [Citation18]). Reliable NTCP models can also be used to optimize the treatment strategy [Citation19,Citation20]. While a meta-analysis of DVH-based NTCP models for rectal bleeding shows that there is a consensus on the parameter values based on several large studies [Citation1], an even higher association between the dose and the risk of rectal bleeding was found when spatial features were considered [Citation3].
The tubular structure of the rectum allows the delivered dose to be easily represented by dose-surface maps (DSMs), by virtually unfolding the rectum and visualizing the resulting dose distribution in two dimensions (2D). To search for significant dose patterns, several investigators co-register the DSMs or 3D patient volumes and derive the ‘mean dose distribution’ for the patients with and without toxicity, respectively [Citation7,Citation8,Citation11,Citation14,Citation17,Citation21,Citation22], i.e., a dose distribution where each voxel contains the mean value of that voxel for all patients. Then, a voxel-wise t-test can visualize the areas/volumes where the difference in dose is significant.
The endpoint most commonly studied with ano-rectal DSMs is late rectal bleeding. The largest study to date [Citation5], including 361 patients treated with 3D-conformal radiotherapy (3D-CRT), showed that late rectal bleeding correlated the strongest with the lateral extent of the 60-Gy isodose (in 32 or 37 fractions). The risk of late rectal bleeding and proctitis as a function of the lateral extent of selected isodoses has also been studied for 109 patients treated with tomotherapy [Citation14]. Importantly, their model was based on the accumulated dose rather than planned dose. The lateral extent of the 65-Gy isodose (in 37 fractions) was the spatial parameter that correlated the strongest with rectal bleeding.
The aim of the current study was to explore if spatial patterns of the dose distribution delivered to the ano-rectal wall during prostate cancer radiotherapy are associated with an increased risk of prospectively, patient-reported late toxicities (bleeding and fecal incontinence) in a large cohort of patients treated with mainly intensity-modulated radiotherapy (IMRT)-type treatments (IMRT, tomotherapy and conformal arc therapy). A pixel-wise method comparing DSMs of patients with toxicity and patients without toxicity is employed, avoiding any pre-selection of spatial parameters and permitting a fully unconstrained search of DSM-based predictors. Further, normal-tissue complication probability (NTCP) models parameterized from DSMs are suggested.
Material and methods
Patients and endpoints
DUE-01 is a prospective multi-centre cohort study which enrolled 539 patients with localized prostate cancer treated with radical radiotherapy between 2010 and 2014 [Citation23,Citation24]; no patient had a prostatectomy. Twenty-seven patients were withdrawn before radiotherapy. Although, DUE-01 mainly focused on urinary toxicity, the participating centers were also asked on a voluntary basis to distribute patient-reported outcome (PRO) questionnaires regarding symptoms of gastro-intestinal toxicity (the questionnaire is reported in Appendix 1 of the paper by Fiorino et al. [Citation25], with the aim of validating previously developed models of rectal toxicity [Citation25–27]. Three centers scored gastro-intestinal toxicity for all patients and two centers for only a few patients (15 and 7, respectively). PRO questionnaires were filled in before treatment, within 1 month after treatment and 6-monthly for 3 years post-treatment. In the current study, these data were used to derive the dose response for late fecal incontinence and late rectal bleeding. Patients with baseline scores >0 were excluded from the analysis.
Three of the questions of the questionnaire related to incontinence symptoms and the answers were used to score incontinence as follows: Grade 1, involuntary stool/mucous discharge “sometimes” experienced; Grade 2, involuntary stool discharge “often” experienced or sporadic use of sanitary pads; and Grade3, daily involuntary stool discharge or use of sanitary pads >2 times/week reported. Fecal incontinence was analyzed for patients with minimum follow-up of 24 months and at least three scores between month 6 and 24; the endpoint considered was the mean grade of incontinence over this time, with a threshold of Grade 1, as a longitudinal definition for this endpoint has been proven to be the most appropriate [Citation26]. A total of 213 patients could be analyzed after 10 were excluded due to missing dosimetric data; 26 of these had a mean fecal incontinence grade ≥1.
Five of the questions related to rectal bleeding: Grade 2 bleeding was scored if bleeding occurred >2 times/week and Grade 3 if daily bleeding was experienced or if the patient underwent blood transfusion(s) and/or laser coagulation. Rectal bleeding was analyzed for patients with minimum follow-up of 24 months and at least two completed questionnaires between month 6 and 24. The maximum score was considered as the toxicity endpoint with a threshold of Grade 2. A total of 225 patients could be analyzed after 12 were excluded due to missing dosimetric data; 26 of these had a maximum rectal bleeding grade ≥2.
Since inclusion criteria applied separately for the two endpoints, two slightly different cohorts emerged. Treatment statistics are summarized in . Although, the aim was to explore ano-rectal DSMs from IMRT-type treatments, the treatment technique was not applied as an inclusion criterion as the size of the cohort was felt to be more important than the homogeneity with regard to treatment technique. Eighty-one percent were treated with IMRT, tomotherapy or conformal arc therapy and 19% with 3D-CRT (see for further details).
Table 1. Treatment plan statistics for patients with and without toxicity; late fecal incontinence (LFInc) and late rectal bleeding (LRB), respectively.
Conventionally fractionated (i.e., 2 Gy per fraction) patients received 74-80 Gy. Thirty-tree percent of the patients were moderately hypofractionated (2.35–2.7 Gy per fraction) and received 65–75.2 Gy (see for further details).
Dose-volume data
Treatment data, including 3D-dose distributions, were imported into VODCA (MSS Medical Software Solutions GmbH, Switzerland) for the generation of DSMs [Citation22] for the anal canal and rectum as a single structure, and for the anal canal and the rectum separately. The anal canal was defined as the structure extending 3 cm cranially of the anal sphincter. The rectum was defined from the anal canal to the point where the structure starts turning anteriorly. DSMs were extracted from VODCA after a review of the segmentation of the OAR. The dose map of the tubular surface of the OAR was unfolded along the posterior axis and converted into a 2D-dose map. The lateral (left-right direction) extent of the map varies with the circumference of the outline of each image slice, and corresponds to a snapshot of the anatomy at the time of the acquisition of the treatment-planning CT. Therefore, the dose map was represented both with this anatomical axis and with a relative lateral axis of 200 pixels, using linear one-dimensional interpolation (see ). This latter representation will be referred to as laterally normalized DSM (referring to the geometry, not dose).
Figure 1. Example of DSM of the anal canal and rectum represented with an anatomical lateral axis (left) and a normalized lateral axis (right), respectively. The colorwash indicates the EQD2 in Gy.
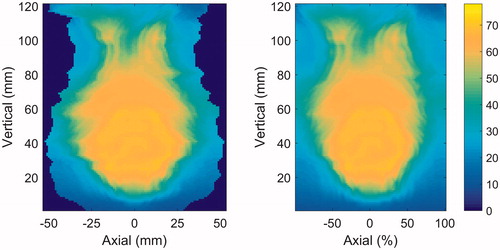
All pixel values in the DSMs were converted to 2 Gy-equivalent dose (EQD2) using α/β = 3 Gy. Matlab (The MathWorks Inc., USA) was used to analyze the dose-surface data. For all patients with and without toxicity, respectively, the average value of the dose in each pixel was calculated after aligning the dose maps for each of the OARs. For each OAR, this resulted in two ‘mean dose maps’ where any difference in the dose given to patients with and without toxicity can be detected. The ano-rectal DSMs were aligned anatomically at the caudal end of the anal canal, the rectal DSMs at the caudal end of the rectum and the anal DSMs at the cranial end of the anal canal. Laterally all DSMs were aligned along the central axis of the organ. An alternative alignment, based on the dose distribution, was also tested. Here, the maps were aligned both laterally and longitudinally through a co-registration of a suitable isodose.
Statistical analysis
The null-hypothesis that there is no difference between the dose distributions of the patients with and without toxicity was tested. As suggested in [Citation28], the test statistic used was derived from the difference in mean dose for each group per pixel. The pixel containing the greatest difference is somewhat arbitrary, depending partly on the population variance from pixel to pixel. Therefore, a permutation procedure was performed where 10,000 samples were created by randomly reassigning the outcome for each patient while preserving the overall complication rate. For each permutation sample, i, the average-dose difference per voxel, k, was normalized into Ti,k, using the formulation in [Citation28]:
where
Here, μE,i,k is the mean dose in sample i and voxel k for the group with toxicity, μN,i,k is the mean dose in sample i and voxel k for the group without toxicity, and σi,k is the standard deviation of di,k. The test statistic for each sample was the maximum value in the normalized mean-dose difference map, i.e., Tmax,i. An adjusted p value was calculated as the proportion of Tmax,i in the permutation samples which were higher than the Tmax,i in the observed data. Further, the pixels in the test-statistic map for the observed data with values corresponding to adjusted p values < .05 were identified.
As argued by Palorini et al. [Citation22], the use of this adjusted p value may be overly conservative for this type of application. Therefore, also the nonadjusted p value map is reported, based on a pixel-wise Student’s t-test.
Since the width of the DSMs varied when using the anatomical representation of the lateral axis, the values in the peripheral pixels of the mean-dose map were calculated from the individuals with the widest DSMs only. The p values and test-statistic values observed in these pixels were not considered reliable; hence, only the central half of the mean-dose map was considered in the analysis. When using laterally normalized DSMs, on the other hand, the full width could be considered.
In addition, a number of spatial-dose features were extracted from the DSMs, considering a range of dose thresholds. The shape of the dose was approximated by fitting an ellipse to each of 40 isodoses, similar to Buettner et al. [Citation5], from 5 Gy to 83 Gy in steps of 2 Gy (in EQD2). The longitudinal (i.e., cranio-caudal) extent, the lateral extent and the eccentricity were recorded for all isodoses for each patient, and a univariate NTCP model based on each candidate feature was fitted to the outcome data in order to find the best dose-volume predictor. The model used was the cumulative normal function, as in the well-known Lyman model [Citation29]. Using a Matlab script, internal validation was performed with bootstrapping (500 cycles) and the mean AUC value over the bootstrap cycles was used as a measure of model performance.
Results
Dose-surface maps
The anatomical alignment of DSMs resulted in lower p values compared to the dose-based alignment, for both endpoints. For mean grade ≥1 fecal incontinence, the most significant difference in DSMs was found for the anal canal, with an anatomical lateral axis, reaching an adjusted p value below .01. shows that the patients with incontinence generally had a larger portion of the anal canal irradiated, specifically the caudal part of the organ. Thus, the irradiated volume of the anal canal, rather than the maximum dose, seems to determine the risk of fecal incontinence. The rectal DSMs did not display a significant difference between patients with and without fecal incontinence.
Figure 2. Mean-dose maps of the anal canal for patients with and without fecal incontinence, the pixel-wise difference between the mean-dose maps, and the test-statistic map. The outer- (thin) and inner (thick) lines indicate where the test statistic corresponds to p values and adjusted p values, respectively, below .05.
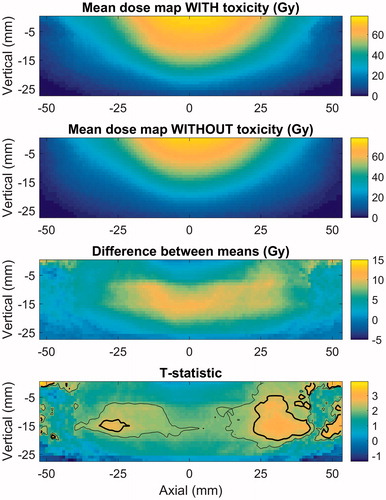
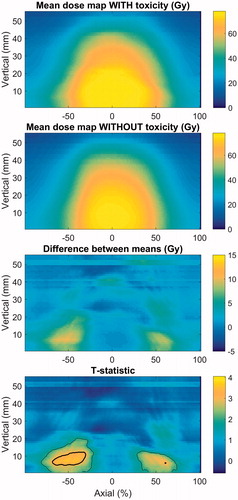
When considering maximum grade ≥2 late rectal bleeding, the most significant difference was found for the rectum, with a normalized lateral axis (c.f. ). Here, the adjusted p value was .01. The area with a dose difference between the patients with and without bleeding is shown in to be located posteriorly in the rectum, near the ano-rectal junction. When comparing the mean-dose maps it is evident that the patients with rectal bleeding received a higher dose generally, but that more specifically the high- and medium isodoses extended further into the posterior part of the rectum. The anal-canal DSMs did not show any significant difference between patients with and without rectal bleeding.
Figure 3. Mean-dose maps of the rectum for patients with and without rectal bleeding, the pixel-wise difference between the mean-dose maps, and the test-statistic map. The outer- (thin) and inner (thick) lines indicate where the test statistic corresponds to p values and adjusted p values, respectively, below .05.
Spatial parameters
When parameterizing the spatial features of importance in the DSMs, an ellipse was fitted to 40 isodoses. The AUC values of the univariate NTCP models, averaged over the bootstrap cycles, are presented in , for fecal incontinence and rectal bleeding, respectively. One model was fitted for each of the spatial parameters characterizing the shape of the 40 isodoses (from the 5-Gy isodose to the 83-Gy isodose in steps of 2 Gy, in EQD2). The results for fecal incontinence are presented with an anatomical lateral axis, and for rectal bleeding with a normalized lateral axis, as these resulted in the strongest difference between patients with and without toxicity.
Figure 4. AUC of models based on the lateral extent, longitudinal extent and eccentricity of ellipses approximating different isodoses in the OAR, for (A) late fecal incontinence, OAR = anal canal; and (B) late rectal bleeding, OAR = rectum.
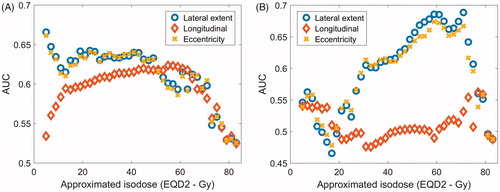
According to these results, fecal incontinence is best discriminated by the lateral extent of the low- to medium isodoses (5–49 Gy), but also the longitudinal extent of isodoses around 60 Gy scored highly. The range of values for the lateral extent of the 5-Gy isodose are listed in for patients with and without fecal incontinence, respectively. The best-fit slope (m) and 50% response level (φx50) with the NTCP model, with x representing the lateral extent of the 5-Gy isodose, were m = .30 (.22–.45) and φx50 = 170 (147–233 Gy). The values in brackets represent the 95% confidence interval. The AUC for this model was .67. These findings are in line with the pattern seen in the DSM analysis, where the patients with incontinence displayed higher doses to the caudal area of the anal canal, and no significant difference in dose was found in the high-dose area (yellow in ).
Rectal bleeding is best discriminated by the lateral extent of the 59-, 61- and 71-Gy isodoses, reaching an AUC of .69. For each of these parameters, the best-fit m and φx50 with the NTCP models were m = .35 (.26–.50) and φx50 = 200 Gy (164–321 Gy) for x = 59 Gy; m = .35 (.26–.51) and φx50 = 197 Gy (158–318 Gy) for x = 61 Gy; and m = .36 (.25–.50) and φx50 = 155 Gy (126–236 Gy) for x = 71 Gy. Also a range of other isodoses above 50 Gy scored similarly both in terms of the lateral extent and the eccentricity. The importance of the lateral extent of the isodoses is consistent with the low p values seen in pixels in the posterior area of the rectum in the DSM analysis.
Discussion
In this study, a longitudinal definition was used for late fecal incontinence. This is appropriate due to its chronic nature; the maximum grade could capture spurious effects possibly related to other causes. Excluding patients with baseline symptoms further reduced the risk of including nonradiotherapy related toxicity. It has also been shown that a longitudinal definition results in dose-volume models with higher predictivity [Citation26,Citation30]. For late rectal bleeding on the other hand, the classical maximum grade definition was used. This is suitable for a side effect which can be resolved with appropriate therapies or procedures.
There was a clear difference in the pattern of the DSMs when comparing patients with and without toxicity, for both endpoints. The patterns corroborate the results of other investigators who also reported some evidence that the dose to the anal canal and the caudal extension of the treated volume correlate with the risk of fecal incontinence [Citation31,Citation32]. In contrast, Casares-Magaz et al. [Citation7] found fecal leakage to be related to the area of rectum receiving high dose (60 Gy) but they did not include the anal canal in the analysis. In the current study, the greater caudal extension of the dose in the anal canal for patients with late fecal incontinence suggests that the risk of causing this complication may depend on the relative location of the CTV and the anal canal; a smaller longitudinal overlap between the CTV and anal canal naturally limits the exposure of the anal canal to dose. This emphasizes the importance of improving the identification of the prostate base, through MRI, and of image-guidance in reducing the caudal extension of the PTV; the use of MRI has been shown to reduce the risk of (urinary) late toxicity [Citation33] but the benefit for the OAR also depends on the required PTV margin [Citation34]. MRI was used for segmentation of the prostate in only a minority of the patients in this cohort but 80% of the patients were positioned at treatment using prostate match of CBCT- or MVCT images to the treatment-planning CT.
It is also important to consider the anal canal as an OAR in treatment planning for prostate cancer and limit the irradiated volume, even though it may be difficult to effectively limit this exposure by the choice of planning technique. For instance, several studies show that the risk of fecal incontinence is not reduced by the move towards IMRT for prostate cancer radiotherapy [Citation35–37].
The pattern of the test-statistic map was quite different for rectal bleeding compared to fecal incontinence. Evidently, the lateral extent of the medium- to high isodoses in the rectum is very important. This lends support to the strategy of limiting the circumference of the rectum receiving a high dose, and it is in line with Kim et al. [Citation38] who found that late rectal bleeding correlated strongly with the circumference of the rectum receiving over 39 Gy in 5 fractions (EQD2 = 84 Gy, α/β = 3 Gy) when treated with SBRT for prostate cancer. The spatial dose parameters of importance in our analysis for rectal bleeding were similar to those of Buettner et al. [Citation5], i.e., the lateral extent of medium- to high isodoses (although, as physical dose in [Citation5] vs. EQD2 in the current study). Thus, the spatial pattern of dose related to late rectal toxicity does not seem to differ between 3D-CRT and IMRT.
The dose-map analysis for rectal bleeding () indicates that the caudal part of the rectum is particularly sensitive – see further discussion in Supporting Information 1. Also, as discussed in Supporting Information 1, the pattern of sparing in the posterior rectal wall might be as important as the pattern of tissue damage in the anterior wall.
CBCT- and MVCT images were not collected in the DUE-01 study. Therefore, the current analysis was performed on the planned dose rather than an estimate of delivered dose. Scaife et al. [Citation39] showed that there can be large differences in DSM pixel values when using planned and delivered dose, respectively. As shown convincingly in [Citation14], models based on planned dose have a lower predictive power due to the lower accuracy of the input data for model fitting. However, the improvement in predictivity from using delivered dose was rather limited and the relative importance of different spatial parameters was generally preserved. Therefore, the conclusions from the current study are unlikely to be affected by this limitation.
When comparing the discriminative ability of different dose/volume parameters, the results depend not only on the mechanisms of radiation-induced injury but also on the characteristics of the dataset [Citation40], see Figures S5 and S6 in Supporting Information 1. The seemingly similar importance of the longitudinal extent of the 13–63 Gy-isodoses for fecal incontinence is probably due to the strong cross-correlation between these parameters in the anal-canal DSMs. For 3D-CRT, late fecal incontinence has been shown to correlate with V40 (EQD2 = 33 Gy, α/β = 3 Gy) [Citation25]. The current study does not contradict that relationship but signals caution regarding the exact isodose; it is expected that for 3D-CRT, cross-correlations between isodoses are at least as predominant compared to IMRT, reducing the robustness of dose-volume predictors.
In this study, the longitudinal axis of the DSMs was considered in its anatomical scale, while for rectal bleeding a normalized lateral axis resulted in a better discrimination. Although, the clinical protocol included imaging and treating the patients with an empty rectum (and comfortably full bladder), in practice the circumference of the rectum varies to some extent as a function of rectal filling throughout the treatment course. Therefore, the representation of the lateral axis on the treatment planning CT is somewhat arbitrary and not necessarily close to the average for the accumulated dose distribution. For this reason, a relative representation of the lateral axis may include a smaller systematic error. This provides a rational for normalizing the maps in the lateral direction only.
Finally, it is important to underline that several clinical factors have been found to be associated with the risk of experiencing the investigated end-points (e.g., Ref. [Citation31]) and this may affect the results in “blurring” the dose/volume-relationship. An interesting field of investigation would be the integration of the weight of non-dosimetric factors into DSMs-based analyses which has rarely been reported [Citation41,Citation42].
In conclusion, the risk of causing late fecal incontinence depends strongly on the portion of irradiated anal canal, which is quantified well by the lateral extent of the isodoses, especially at low doses. The risk of causing late rectal bleeding is suitably represented by the lateral extent of medium- to high isodoses. Thus, the DSM pattern associated with late rectal bleeding is the same with IMRT as that previously reported for 3D-CRT.
Supplemental Material
Download PDF (620.4 KB)Disclosure statement
No potential conflict of interest was reported by the authors.
Additional information
Funding
Related Research Data
References
- Michalski JM, Gay H, Jackson A, et al. Radiation dose-volume effects in radiation-induced rectal injury. Int J Radiat Oncol Biol Phys. 2010;76:S123–S129.
- Acosta O, Drean G, Ospina JD, et al. Voxel-based population analysis for correlating local dose and rectal toxicity in prostate cancer radiotherapy. Phys Med Biol. 2013;58:2581–2595.
- Buettner F, Gulliford SL, Webb S, et al. Using dose-surface maps to predict radiation-induced rectal bleeding: a neural network approach. Phys Med Biol. 2009;54:5139–5153.
- Buettner F, Gulliford SL, Webb S, et al. Modeling late rectal toxicities based on a parameterized representation of the 3d dose distribution. Phys Med Biol. 2011;56:2103–2118.
- Buettner F, Gulliford SL, Webb S, et al. Assessing correlations between the spatial distribution of the dose to the rectal wall and late rectal toxicity after prostate radiotherapy: an analysis of data from the mrc rt01 trial (isrctn 47772397). Phys Med Biol. 2009;54:6535–6548.
- Buettner F, Gulliford SL, Webb S, et al. The dose-response of the anal sphincter region-an analysis of data from the MRC RT01 trial. Radiother Oncol. 2012;103:347–352.
- Casares-Magaz O, Muren LP, Moiseenko V, et al. Spatial rectal dose/volume metrics predict patient-reported gastro-intestinal symptoms after radiotherapy for prostate cancer. Acta Oncol. 2017;56:1507–1513.
- Gianolini S, Widesott L, Rancati T, et al. Does the shape of the rectal surface dose distribution predict the risk of late rectal incontinence and bleeding, in patients treated with high-dose 3dcrt for localized prostate cancer? Radiother Oncol. 2008;88:S320.
- Hoogeman MS, van Herk M, de Bois J, et al. Quantification of local rectal wall displacements by virtual rectum unfolding. Radiother Oncol. 2004;70:21–30.
- Lee R, Chan EK, Kosztyla R, et al. Dose-distance metric that predicts late rectal bleeding in patients receiving radical prostate external-beam radiotherapy. Phys Med Biol. 2012;57:8297–8307.
- Munbodh R, Jackson A. Quantifying cell migration distance as a contributing factor to the development of rectal toxicity after prostate radiotherapy. Med Phys. 2014;41:021724.
- Munbodh R, Jackson A, Bauer J, et al. Dosimetric and anatomic indicators of late rectal toxicity after high-dose intensity modulated radiation therapy for prostate cancer. Med Phys. 2008;35:2137–2150.
- Sanchez-Nieto B, Fenwick JF, Nahum AE, et al. Biological dose surface maps: evaluation of 3d dose data fortubular organs. Radiother Oncol. 2001;61:S52.
- Shelley LEA, Scaife JE, Romanchikova M, et al. Delivered dose can be a better predictor of rectal toxicity than planned dose in prostate radiotherapy. Radiother Oncol. 2017;123:466–471.
- Tucker SL, Zhang M, Dong L, et al. Cluster model analysis of late rectal bleeding after imrt of prostate cancer: a case-control study. Int J Radiat Oncol Biol Phys. 2006;64:1255–1264.
- van Lin EN, Hoffmann AL, van Kollenburg P, et al. Rectal wall sparing effect of three different endorectal balloons in 3d conformal and imrt prostate radiotherapy. Int J Radiat Oncol Biol Phys. 2005;63:565–576.
- Wortel RC, Witte MG, van der Heide UA, et al. Dose-surface maps identifying local dose-effects for acute gastrointestinal toxicity after radiotherapy for prostate cancer. Radiother Oncol. 2015;117:515–520.
- Fonteyne V, Sadeghi S, Ost P, et al. Impact of changing rectal dose volume parameters over time on late rectal and urinary toxicity after high-dose intensity-modulated radiotherapy for prostate cancer: a 10-years single centre experience. Acta Oncol. 2015;54:854–861.
- Fellin F, Azzeroni R, Maggio A, et al. Helical tomotherapy and intensity modulated proton therapy in the treatment of dominant intraprostatic lesion: a treament planning comparison. Radiother Oncol. 2013;107:207–212.
- van Wijk Y, Vanneste BL, Jochems A, et al. Development of an isotoxic decision support system integrating genetic markers of toxicity for the implantation of a rectum spacer. Acta Oncol. 2018;57:1499–1505.
- Heemsbergen WD, Al-Mamgani A, Witte MG, et al. Urinary obstruction in prostate cancer patients from the dutch trial (68 gy vs. 78 gy): relationships with local dose, acute effects, and baseline characteristics. Int J Radiat Oncol Biol Phys.2010;78:19–25.
- Palorini F, Cozzarini C, Gianolini S, et al. First application of a pixel-wise analysis on bladder dose-surface maps in prostate cancer radiotherapy. Radiother Oncol. 2016;119:123–128.
- Cozzarini C, Rancati T, Carillo V, et al. Multi-variable models predicting specific patient-reported acute urinary symptoms after radiotherapy for prostate cancer: results of a cohort study. Radiother Oncol. 2015;116:185–191.
- Cozzarini C, Rancati T, Palorini F, et al. Patient-reported urinary incontinence after radiotherapy for prostate cancer: quantifying the dose-effect. Radiother Oncol. 2017;125:101–106.
- Fiorino C, Fellin G, Rancati T, et al. Clinical and dosimetric predictors of late rectal syndrome after 3d-crt for localized prostate cancer: preliminary results of a multicenter prospective study. Int J Radiat Oncol Biol Phys. 2008;70:1130–1137.
- Fiorino C, Rancati T, Fellin G, et al. Late fecal incontinence after high-dose radiotherapy for prostate cancer: better prediction using longitudinal definitions. Int J Radiat Oncol Biol Phys. 2012;83:38–45.
- Rancati T, Fiorino C, Fellin G, et al. Inclusion of clinical risk factors into ntcp modelling of late rectal toxicity after high dose radiotherapy for prostate cancer. Radiother Oncol. 2011;100:124–130.
- Chen C, Witte M, Heemsbergen W, et al. Multiple comparisons permutation test for image based data mining in radiotherapy. Radiat Oncol. 2013;8:293.
- Lyman JT. Complication probability as assessed from dose-volume histograms. Radiat Res. 1985;104:7.
- Gulliford SL, Partridge M, Sydes MR, et al. A comparison of dose-volume constraints derived using peak and longitudinal definitions of late rectal toxicity. Radiother Oncol. 2010;94:241–247.
- Fiorino C, Valdagni R, Rancati T, et al. Dose-volume effects for normal tissues in external radiotherapy: pelvis. Radiother Oncol. 2009;93:153–167.
- Landoni V, Fiorino C, Cozzarini C, et al. Predicting toxicity in radiotherapy for prostate cancer. Phys Med. 2016;32:521–532.
- Sander L, Langkilde NC, Holmberg M, et al. MRI target delineation may reduce long-term toxicity after prostate radiotherapy. Acta Oncol. 2014;53:809–814.
- Onjukka E, Rintelä N, Castellanos E, et al. Does prostate radiation therapy treatment planning benefit from MRI? Int J Radiat Oncol Biol Phys. 2015;93:E569.
- Al-Mamgani A, Heemsbergen WD, Peeters ST, et al. Role of intensity-modulated radiotherapy in reducing toxicity in dose escalation for localized prostate cancer. Int J Radiat Oncol Biol Phys. 2009;73:685–691.
- Cicchetti A, Avuzzi B, Rancati T, et al. Predicting late faecal incontinence risk after rt for prostate cancer: new insights from external independent validation. Int J Radiat Oncol Biol Phys. 2018;102:127–136.
- Wortel RC, Incrocci L, Pos FJ, et al. Late side effects after image guided intensity modulated radiation therapy compared to 3d-conformal radiation therapy for prostate cancer: results from 2 prospective cohorts. Int J Radiat Oncol Biol Phys. 2016;95:680–689.
- Kim DWN, Cho LC, Straka C, et al. Predictors of rectal tolerance observed in a dose-escalated phase 1-2 trial of stereotactic body radiation therapy for prostate cancer. Int J Radiat Oncol Biol Phys. 2014;89:509–517.
- Scaife JE, Thomas SJ, Harrison K, et al. Accumulated dose to the rectum, measured using dose-volume histograms and dose-surface maps, is different from planned dose in all patients treated with radiotherapy for prostate cancer. Br J Radiol. 2015;88:20150243.
- Rutkowska E, Baker C, Nahum A. Mechanistic simulation of normal-tissue damage in radiotherapy-implications for dose-volume analyses. Phys Med Biol. 2010;55:2121–2136.
- Improta I, Palorini F, Cozzarini C, et al. Bladder spatial-dose descriptors correlate with acute urinary toxicity after radiation therapy for prostate cancer. Phys Med. 2016;32:1681–1689.
- Yahya N, Ebert MA, House MJ, et al. Modeling urinary dysfunction after external beam radiation therapy of the prostate using bladder dose-surface maps: evidence of spatially variable response of the bladder surface. Int J Radiat Oncol Biol Phys. 2017;97:420–426.