
Abstract
Background: Little is known about the biological factors influencing ovarian cancer (OC) patient outcome, especially in older patients who are often underrepresented in clinical trials. We examined alterations in the transcriptomic profile of primary high-grade serous carcinoma (HGSC) samples from older OC patients (>70 years) receiving first-line platinum-based treatment to identify potential biomarkers for prediction of response to this therapy.
Material and methods: Tumor samples from 50 HGSC patients were identified from a retrospective cohort, analyzed by gene expression array. The protein expression of selected biomarkers was examined using immunohistochemistry (IHC).
Results: Gene expression profiling revealed 81 genes with significantly altered expression in patients experiencing progression after first-line platinum-based treatment within 6 months versus those who progressed later than 12 months. Expression of ankyrin repeat and PH domain 1 (ARAP1) was significantly lower in the group with early versus late progression (p ≤ .01). Correlation between ARAP1 expression and outcome was further confirmed by IHC staining in the discovery cohort (χ2-test, p = .004) and in independent validation cohorts. The sensitivity of ARAP1 allowed identification of 64.7% of patients with early progression in the discovery population, with a specificity of 78.6% and a negative predictive value of 78.6%. Multivariate regression analysis identified ARAP1 as an independent prognostic factor.
Conclusions: This hypothesis generating study suggests that low expression of ARAP1 is an independent prognostic biomarker of shorter RFS in older patients with HGSC receiving first-line platinum-based antineoplastic therapy, which could be used to identify patients who should receive more intensive treatment and closer surveillance.
Introduction
Ovarian cancer (OC) is the leading cause of death from gynecological malignancies worldwide and the fifth most common cancer among women in the Western world [Citation1]. Approximately, 90% of OC cases are epithelial ovarian cancers (EOCs), the majority (70%) of which is high-grade (grade 2 or 3) serous adenocarcinomas (HGSCs) [Citation1,Citation2]. As early stages of the disease present with few and unspecific symptoms, 70% of EOC cases are diagnosed in advanced stage (FIGO stage III/IV), resulting in a 5-year survival for EOC patients of <35% [Citation3]. HGSCs are characterized by a high prevalence of mutations in the tumor suppressor gene TP53 (96%), with 22% also having mutations in BRCA1/BRCA2 [Citation4]. Four subtypes, immunoreactive, differentiated, proliferative and mesenchymal, have been identified based on differences in gene expression [Citation4] and validated by the CLOVAR study [Citation5], leading to the emergence of the ‘worst outcome group’ based on subtype and survival signatures. This group, characterized by the mesenchymal subtype/poor prognosis and comprising 23% of patients, had lower median survival (23 months versus 46 months) and higher platinum-resistance rate (63% versus 23%) compared to other patients [Citation5].
The cornerstone of advanced stage HGSC treatment is cytoreductive surgery in combination with platinum-based chemotherapy consisting of carboplatin (C) and the taxane, paclitaxel (P) [Citation6]. The treatment schedule is primary surgery followed by six courses of CP or three courses of neoadjuvant CP followed by interval debulking surgery and another three courses of CP. If patients are not eligible for surgery due to health or disease status, they receive chemotherapy if this is considered tolerable.
The number of older cancer patients is increasing significantly commensurate with the aging population and the increasing incidence of cancer in general [Citation7]. Age is the strongest risk factor for EOC, as the incidence increases with each additional year of life, supporting the notion that EOC is a disease of aging [Citation8]. In Denmark, as in most of the Western world, approximately 40% of women with EOC are >70 years old at the time of diagnosis [Citation9].
Increasing age is associated with higher disease-specific mortality, which is likely related to age-associated changes in normal cells, such as less efficient DNA repair and alterations in the immune and endocrine systems [Citation10]. However, the cancer cells within tumors occurring in older versus younger patients may also differ, including telomere instability, linking aging with increased cancer risk. In addition, the characteristics of cancer stem cells in the two groups may differ [Citation11]. Little is known about these biological factors in cancer cells and surrounding normal cells and their influence on patient treatment and outcome [Citation12,Citation13]. The incidence of comorbidity increases with age, with older cancer patients having a prevalence of 36–94%, depending on the assessment method used [Citation14]. Age is also a risk factor for chemotherapy-related toxicity and decreased tolerance to chemotherapy [Citation15] which, combined with the known underrepresentation of older cancer patients in clinical trials, complicates oncologic treatment decisions in this population [Citation16]. Thus, there is a need for further research to elucidate the biology of EOC and factors that influence EOC treatment outcomes. As 40% of EOCs occur in patients aged 70 or above, this population should be of particular research interest. To improve outcome for EOC patients, significant effort has been given to identify prognostic and predictive biomarkers, and although several candidate biomarkers have emerged, only a few have been validated [Citation17].
In this study, we applied global transcriptomic analysis of primary EOC tumor tissue samples from older patients (>70 years) with early versus late disease progression to identify potential biomarkers for prediction of response to anti-neoplastic therapy or their specific biological characteristics in older EOC patients. Selected candidate biomarkers were further evaluated using immunohistochemistry (IHC).
Material and methods
Patients and tissue samples
Formalin-fixed, paraffin-embedded (FFPE), tumor samples from 50 women aged >70 years with primary HGSC were identified in a retrospective cohort (discovery cohort). All patients had received first-line platinum-based antineoplastic therapy following surgery or as neoadjuvant chemotherapy, or chemotherapy as the sole treatment. The FFPE tumor samples predominately originated from the local biobank at the Department of Pathology, Odense University Hospital (OUH), and were collected for diagnostic purposes from 1997 to 2015. Samples were grouped according to time of progression after first-line platinum-based anti-neoplastic therapy, with 20 patients experiencing progression within 6 months, and 30 patients progressing >12 months after, or not at all. In addition, FFPE tumor tissue from an additional 14 women with HGSC and aged ≥70 years were collected as a validation cohort. Eight had early disease progression (<6 months) and six had late progression (>12 months). These samples also predominately originated from the local biobank at the Department of Pathology, OUH and were from the same time period as the discovery population.
In addition, samples of normal tissues (skin, tonsil, esophagus, salivary gland, lung, thyroid, spleen, thymus, liver, gall bladder, kidney, pancreas, cerebellum, uterus, placenta, muscle, testis, prostate, bladder, colon, duodenum and ventricle) were collected as diagnostic specimens from patients treated at the University Hospital of Odense. These normal tissues were used to optimize the antibody staining procedure.
Global transcriptome analysis of FFPE tumor tissue samples
RNA was isolated from tissue sections of the FFPE tumors blocks using a QiaSymphony RNA Kit (Qiagen, Hilden, Germany), processed using a GeneChip™WT Pico Reagent Kit, reverse transcribed and used for cRNA synthesis. Subsequently, the cRNA was labeled and hybridized on a GeneChip™ Human Transcriptome Array 2.0 (Affymetrix, Santa Clara, CA, USA) according to the manufacturer’s protocol. The arrays were washed and stained with phycoerythrin-conjugated streptavidin using the Affymetrix Fluidics Station 450, followed by scanning using the Affymetrix GeneArray 3000 7G scanner to generate fluorescent images. Cell intensity files (.CEL files) were generated in the GeneChip Command Console Software (AGCC; Affymetrix, Santa Clara, CA, USA). The microarray data were deposited to Gene Expression Omnibus (accession number GSE126308).
Data quality was assessed by arrayQualityMetrics (version 3.34.0, using R version 3.4.4) [Citation18] after normalization using a robust multi-array average (RMA). Nine samples were defined as outliers when evaluating only inter-array distance in the dataset. The first component in a principle component analysis recapitulated the distance of the same nine samples. Two of the nine samples also showed a minor shift in mean (significant based on 0.103 threshold using the Kolmogorov–Smirnov statistic between each array's distribution and the distribution of the pooled data). However, assessing the distribution through MA-plots by Hoeffding's statistic on the median distribution of A and M over all arrays, no arrays were detected as outliers based on the recommended threshold 0.15 (all arrays below 0.05). Based on these statistics, no samples were filtered out due to the quality and after initial QC analysis, all samples were approved as suitable for further analysis. Bioinformatics analysis was performed using the Qlucore Omics Explorer 3.2 (Qlucore, Lund, Sweden). Raw intensity CEL files were preprocessed by quantile normalization, and gene summaries were extracted via RMA [Citation19]. The nominal two-group comparison is based on a Student's t-test and allowed the identification of differentially expressed genes (p < .01).
Hierarchical cluster analysis was performed and visualized using the Qlucore Omics Explorer™ software. All hierarchical clusters are built using average linkage, and a heat map was generated based on mean m = 0, variance 1 normalization. Gene expression was determined to be significantly altered between the two groups when the fold-change was ±1.2, and p ≤ .01.
To determine cellular mechanisms responsible for differences between late and early progression, we performed an enrichment analysis of differentially expressed genes identified between these two groups. The gene list was uploaded into DAVID (database for annotation, visualization and integrated discovery) [Citation20]. Similarly, a GSEA (gene set enrichment analysis) tool was used to seek specific features, but did not detect significant enrichments.
IHC protocol for ARAP1
No published studies have evaluated the expression of ARAP1 using IHC and no standard IHC protocol for ARAP1 was available. We based our protocol on the recommendations of the manufacturer of the anti-ARAP1 antibody and the information provided by The Human Protein Atlas regarding antibody and expression patterns [Citation21,Citation22]. Initially, we conducted a feasibility study to perform technical calibrations and determine the most suitable antigen retrieval method, antibody dilution and optimal dilution buffer. FFPE sections of tumor and normal tissue blocks were deparaffinized with xylene and rehydrated. A panel of antigen retrieval procedures were tested, including microwave boiling for 15 min in (1) T-EG buffer (10 mM Tris, 0.5 mM EGTA, pH 9.0), (2) 10 mM citrate buffer, pH 6.0 or (3) Dako Target retrieval solution (Dako S1699), or subjected to proteolytic treatment using (4) 0.05% protease type XIV (pronase E, Sigma, St. Louis, MO, USA, cat. no. P5147) in TBS, pH 7.0 for 15 min at 37 °C or (5) 0.4% pepsin (Sigma, St. Louis, MO, USA, cat. no. P7012) in 0.01 M HCl for 20 min at 37 °C. Heating the slides in a microwave in citrate buffer for 15 min was determined to be the optimal method. Subsequently, the slides were then incubated in 1.5% H2O2 for 10 min to remove endogenous peroxidase activity. Immunostaining was performed by incubating sections with rabbit polyclonal anti-ARAP1 antibody (1:1000 dilution; Origene, Rockville, MD, USA) in citrate buffer, pH 6.0, for 60 min. The sections were incubated with the EnV FLEX/HRP + Rabbit LINK 15-30 autostainer (AS) detection system followed by incubation with 3,3-diaminobenzidine tetrahydrochloride (Dako Company, Glostrup, Denmark) at 37 °C and counterstained with hematoxylin. ARAP1 has been described as being present in cytoplasm as well as the plasma membrane, which is in line with our findings. Staining of the TMA panel of 25 different normal tissues and 10 tumor tissues of different origins revealed that ARAP1 was generally expressed in smooth muscle and B-lymphocytes as well as goblet cells of the colon, epithelial cells of the tubules and glomeruli of the kidney, and urothelial cells of the bladder, but was not found in many other tissues, including cerebellum, skin, esophagus, lung, thyroid gland, spleen, liver and ventricle. In the different tumor biopsies, ARAP1 was expressed in Hodgkin's lymphoma, colon cancer, lung cancer, medullary thyroid carcinoma and seminoma, but not in adrenocortical adenoma, melanoma, mesothelioma or renal cell carcinoma.
IHC evaluation of ARAP1 expression
Whole tumor slides from the FFPE HGSC samples were randomly reviewed by two independent investigators; one experienced surgical pathologist specialized in gynecological pathology and one non-pathologist medical doctor. Both reviewers were blinded with regard to progression group until two reviews on two separate days were completed. After the first review, a brief discussion between the two reviewers established the spectrum of staining. Initially, the percentage of tumor cells positive for ARAP1 staining and the intensity of the staining were evaluated. However, as all tumor cells were positive, we only evaluated the intensity. It was only possible to distinguish between weak/moderate (2–3), grouped as ‘weak’, and strong (4) staining.
Statistical analysis
χ2-test was used to examine differences in the intensity of tumor staining between patients with early and late progression. A p value of <.05 was considered statistically significant.
Sensitivity, specificity, positive predictive value (PPV) and negative predictive value (NPV) was calculated to assess the ability of ARAP1 to categorize patients correctly into the early and late progression groups, thereby predicting who will experience early progression after platinum-based antineoplastic therapy.
Multivariate analysis was performed using a logistic regression model to assess the adjusted hazard ratio (HR) of odds ratio (OR) by ARAP1 expression and clinic-pathological characteristics, including age and stage.
Interrater and intrarater reliability was assessed by estimating agreement percentage as well as the kappa statistics (Cohen’s kappa) with 95% analytic confidence intervals. This included testing whether the level of agreement was higher than would be expected by chance.
Collection and storage of data for the study was approved by The Regional Committees on Health Research Ethics for Southern Denmark (journal number: S-20160077 CSF) and the Danish Data Protection Agency (journal number: 18/34826).
Results
Altered gene expression profile associated with disease progression in primary HGSC tumors of older patients
Primary tumor tissue of 50 older HGSC patients (≥70 years) was analyzed by gene expression array. Analysis of the data comparing patients with early (<6 months, n = 20) versus late (>12 months, n = 30) progression revealed several candidate genes that showed significantly altered expression (>1.2-fold alteration in expression and p ≤ .01) between these two groups. Forty-three genes were significantly downregulated and 38 upregulated in the early progression patient group. Patient characteristics for the two groups are shown in .
Table 1. Patient characteristics for the early and late progression group.
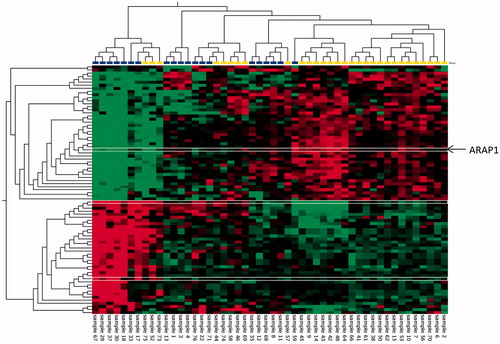
A heat map of differentially expressed genes is shown in and the altered genes are listed in Supplementary Table S1.
Figure 1. Hierarchical cluster analysis showing the 81 significantly altered genes (p<.01) with fold changes of ±1.2 in primary tumors of older HGSC patients (>70 years) with early (<6 months, 20 patients, blue) versus late disease progression (>12 months, 30 patients, yellow). Red: higher levels, green: lower levels in the early versus late disease progression group. Heatmaps were generated using the Qlucore Omics Explorer™ software. The ARAP1 gene selected for further analysis is marked in the heat map with thin white lines.
To identify the biological processes responsible for the differences between early and late progression, we performed enrichment analysis of the 81 differentially expressed genes identified when comparing these two groups. The detected genes were enriched in seven GO terms having p values <.05 (Supplementary Table S2). However, none of the GO term showed to be significant after multiple testing using Bonferroni, most likely due to the low number of input genes.
The literature concerning the 81 altered genes was reviewed, and ArfGAP with RhoGAP domain, ankyrin repeat and PH domain 1 (ARAP1) was expressed at a significantly lower level in the group with early versus late progression, and were selected for further analysis as candidate biomarkers.
Evaluation of ARAP1 as a candidate biomarker for correlation with time to progression in older HGSC patients using IHC
To further evaluate the altered ARAP1 expression, at the protein level, IHC analysis was performed. For this analysis, tumor tissue from 17 patients in the early progression group and 28 in the late progression group of the discovery cohort were available (). Sixty-five percent (11/17) of tumors from patients with early progression exhibited weak ARAP1 staining (), while 35% (6/17) exhibited strong staining. In the late progression group, 21% (6/28) exhibited weak ARAP1 staining intensity, while 79% (22/28) exhibited strong intensity (. The tumors of the early progression group exhibited significantly weaker ARAP1 staining than the late progression group (p = .004). In the discovery population, the sensitivity of ARAP1 in patients who experienced early progression was 64.7% (CI: 38.3–85.8), the specificity was 78.6% (CI: 59.1–91.7) with a PPV of 64.7% (CI: 45.4–80.2) NPV of 78.6% (CI: 65.2–87.8). Logistic regression analysis of late progression status according to ARAP1 staining and clinic-pathological characteristics of the metastatic disease, including age, stage and residual tumor status (radical surgery or not), showed that strong ARAP1 staining was independently prognostic of late progression (OR 15.4 (95% CI: 1.3–178.8 p = .03). Likewise, weak ARAP1 staining was independently prognostic of early progression with the same OR.
Figure 2. Staining intensity for ARAP1 correlates with time to progression. Immunohistochemistry showing weak and strong intensity of ARAP1 staining, respectively, in HGSC samples. (A) Weak intensity. Example from the early progression group. (B) Strong intensity. Example from the late progression group. Scale bar: 100 µm.
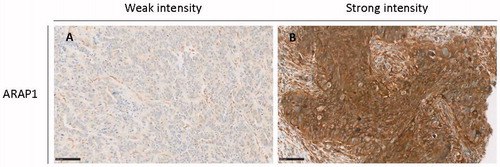
Table 2. Intensity of ARAP1 staining in the discovery and validation populations.
For further validation, we identified an additional 12 tumor samples from patients who fulfilled the same criteria as our discovery population. Six originated from patients with early progression, and six were from late progression patients. All six tumors from the former group showed weak intensity of ARAP1 staining (), while in the latter group, four tumors exhibited strong ARAP1 staining and two had weak staining. Thus, as also seen in the validation group, the tumors of patients with early progression exhibited significantly weaker ARAP1 staining than those of the late progression group (p = .014). The sensitivity of ARAP1 in the validation population in patients who experienced early progression was 100.0% (CI: 54.1–100.0), the specificity was 66.7% (CI: 22.3–95.7) with a PPV of 75.0% (CI: 49.2–90.3) and a NPV of 100.0%.
Interrater and intrarater reliabilities of the ARAP1 IHC analysis
Two independent investigators performed the IHC interpretation. The interrater reliability was very high with Cohen’s kappa value for the discovery population of 0.911 (CI: 0.791–1.000) for the first review and 0.910 (0.789–1.000) for the second review, indicating ‘almost perfect’ agreement. The corresponding values for the validation population were slightly lower, but still high, demonstrating ‘moderate’ and ‘strong’ levels of agreement, respectively. The intrarater reliability was more variable (see Supplementary Tables S3 and S4 for all results regarding agreement).
Evaluation of ARAP1 levels as a prognostic biomarker in HGSC patients using publicly available gene expression data
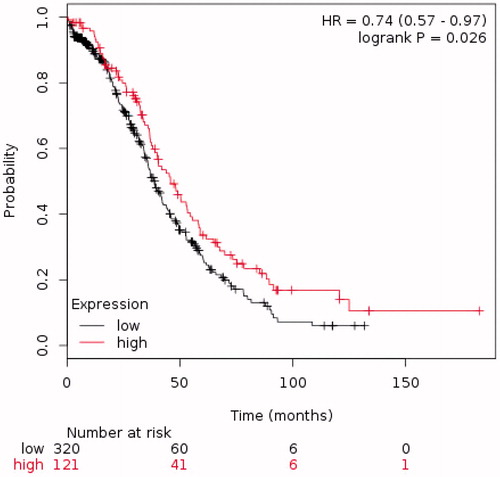
To obtain further evidence that the ARAP1 level is associated with outcome in HGSC patients, we evaluated a cohort of 441 HGSC patients with stages III and IV disease treated with chemotherapy using KM plotter, an online resource useful in assessing the effect of genes on survival in different cancer populations, including OC [Citation23]. The analysis, in agreement with our earlier findings, showed that lower ARAP1 expression was associated with poorer overall survival (OS) ().
Figure 3. The Kaplan–Meier plot assessing the effect of ARAP1 expression on overall survival (OS) in a publically available dataset of 441 HGSC ovarian cancer patients.
Discussion
The change in demographics and the increasing incidence of cancers in general have led to a significant increase in the number of older EOC patients. This population may tolerate standard treatments less well, perhaps due to age-related alterations in biological factors and the high prevalence of comorbidities. In this study, we aimed at identifying and validating potential prognostic biomarkers in older (>70 years) primary EOC patients, more specifically HGSC, following first-line platinum-based chemotherapy. Global gene expression profiling identified 81 genes exhibiting altered expression between HGSC patients with early disease progression (within 6 months of start of first-line platinum-based chemotherapy) and those with late disease progression (more than 12 months after end of first-line platinum-based chemotherapy, or never) (fold change ± 1.2, and p ≤ .01). Among the identified altered genes, ARAP1 was expressed at significantly lower levels in the tumor tissue of HGSC with early progression compared to those with late. Validation of ARAP1 protein levels using IHC supported this finding, as significantly weaker staining intensity was observed in tumor tissue from the early progression patients compared to those with late progression in the discovery cohort and a validation cohort. The study further demonstrated a relatively high sensitivity, specificity and NPV of ARAP1 in terms of selecting patients with early versus late progression. Interrater reliability demonstrated an almost perfect level of agreement during both reviews, with the intrarater reliability being more varied, generally indicating that ARAP1 protein expression, as assessed by IHC, demonstrated high reproducibility. Finally, analysis of a large publically available gene expression dataset of HGSC patient tumor tissue confirmed ARAP1 as a prognostic marker. Tumor/block age did not influence the findings in the ARAP1 gene expression profile (linear regression analysis; p = .104) or the ARAP1 IHC data (logistic regression analysis; p = .105).
A very limited number of studies have investigated the role of ARAP1 in cancer [Citation24–26] and none in OC. ARAPs generally contain (ADP-ribosylation factor) Arf GTPase-activating proteins (GAPs), Rho GAP, Ras-associating (RA) and five pleckstrin homology (PH) domains, and have Rho GAP and PI(3,4,5)P3-dependent Arf GAP activity. Furthermore, ARAP1 overexpression leads to Cdc42 activation. These biochemical activities induce changes in both the Golgi apparatus and the actin cytoskeleton. In addition, overexpression of ARAP1 slowed cell spreading. Together, these results indicate that ARAP1 is a point of convergence for Arf, Rho and phosphoinositides and seems to serve as a key molecule in a signaling network that coordinates membrane and actin remodeling in cell motility [Citation24,Citation25]. This is in line with the findings of this study wherein tumors of patients with early progression had significantly lower ARAP1 levels compared to those with late.
ARAP1 has also been shown to play a role in apoptosis. Downregulation of ARAP1 has been associated with slowing of TNF-related apoptosis-inducing ligand (TRAIL)-induced apoptosis of cancer cells [Citation26]. TRAIL causes apoptosis by binding to pro-death receptors, DR4 and DR5, on the surface of cancer cells. Downregulation of ARAP1 suppresses cell surface expression of these death receptors, especially of DR4, resulting in reduced apoptosis [Citation26]. These findings are in agreement with our observations of significant lower ARAP1 levels in tumors of HGSC patients with early versus late progression patients.
Epidermal growth factor receptor (EGFR) is often overexpressed in human carcinomas, and excessive EGFR signaling promotes cell growth and proliferation [Citation27]. Overexpression of ARAP1 has been shown to accelerate degradation of EGFR in the late endosome, while knockdown leads to EGFR accumulation [Citation25]. This is in line with the findings of this study, where tumors of patients with early progression had significantly lower ARAP1 levels compared to those with late.
The molecular mechanism behind the association between ARAP1 expression and time to progression needs to be further addressed by experimental studies, but the known role of ARAP1 in cell movement and spreading as well on apoptosis seems likely to be involved.
The two progression groups were comparable with regard to age and, of course, histological subtype, while they differed in the percentage of patients with stages IIIB and IV disease. This difference could simply be a coincidence due to a relatively low patient number, especially in the early progression group, or could reflect more advanced disease stages in patients with early progression versus those with earlier stage disease. However, multivariate analysis including all relevant prognostic factors demonstrated that this did not affect the interpretation of ARAP1 as an independent prognostic marker in older HGSC patients. In terms of stage, patients were divided into two clinically relevant groups, with stages I–IIIB disease in one group and stages IIIC and IV disease in the other. Further evaluation in prospective cohorts is needed as well as evaluation of other promising tissue biomarkers in OC, including human leukocyte antigen-G (HLA-G), hydroxysteroid (17B) dehydrogenase type 12 (HSD17B12) and kallikreins (KLKs) [Citation28,Citation29] to achieve clinical utility. Although HLA-G, a non-classical MHC class 1 molecule, has shown divergent results in OC, it is overall considered a predictor of platinum-sensitivity and a prognostic factor in high-grade EOC [Citation30,Citation31]. Increased expression of HSD17B12, an enzyme involved in fatty acid elongation, has been reported to be associated with poor prognosis in OC [Citation28]. Finally, increased expression of KLKs, a subgroup of 15 serine proteases, is also associated with poor prognosis in OC patients [Citation29].
CA 125 is currently the only biomarker used routinely in the clinical setting. Although pretreatment serum CA 125 has been identified as an independent predictor of PFS in advanced EOC treated with a standard chemotherapy regimen, its clinical use is currently limited to serial measurement for disease monitoring during course of treatment and during subsequent controls, as well as part of the diagnostic process [Citation32]. ARAP1 expression separates itself from CA 125 by providing valuable information regarding progression risk, early (<6 months) versus late (>12 months) progression, in a specific, but highly relevant, subpopulation of EOC patients – and may be high valuable in the clinical setting, if validated in future studies.
The high interrater reliability in the IHC validation process between two blinded reviewers with different experience levels is very promising for reproducibility. Evaluation of ARAP1 in prospective cohorts, including patients who did not receive first-line platinum-based anti-neoplastic therapy, should also be undertaken to assess its utility as a predictive marker [Citation33]. If ARAP1 shows further potential, its use will be very feasible in the current diagnostic and clinical settings.
The expression of sperm-associated antigen 9 (SPAG9) and microsomal glutathione S-transferase 1 (MGST) was two of the other significantly higher expressed genes in patients with early versus late progression. SPAG9 belongs to the cancer testis antigen (CTA) family, which represents a unique class of tumor antigens with normal expression in the testis and aberrant expression in various malignancies [Citation34]. It has been identified as a promising biomarker for early detection and a therapeutic target for several cancers, including ovarian, cervix, breast and renal cell carcinoma [Citation35–39]. MGST is a membrane protein localized to the endoplasmic reticulum and outer mitochondrial membrane, where it serves a protective function. MGST1 is highly expressed in EOC primary tumors, metastases and effusions and has been shown to protect cells from cisplatin [Citation40,Citation41]. An IHC evaluation of the protein levels of these two genes in HGSC tumor tissue was undertaken, but the available regents did not allow firm conclusions to be made.
This hypothesis generating study revealed that gene expression of the protein, ARAP1, which is associated with several cancer-relevant functions, was significantly lower in older HGSC patients with early progression (<6 months) versus late progression (>12 months) in patients receiving first-line platinum-based chemotherapy. ARAP1 protein expression with IHC was significantly weaker in samples from patients with early versus late progression in both the discovery and validation populations. ARAP1 was able to identify older patients with early progression with a relatively high sensitivity, specificity and NPV. Further statistical analysis demonstrated that ARAP1 is an independent prognostic biomarker in older patients with HGSC receiving first-line platinum-based anti-neoplastic therapy. As ARAP1 was only identified and validated in older women with HGSC, we cannot rule out that the same biomarkers are also present in younger HGSC patients. However, this does not detract from the potential value of these biomarkers in older OC patients, as they are at higher risk of OC and also pose age-related challenges in oncological treatment decisions. Thus, it is crucial to find the balance between the benefit from a given treatment and the risk of adverse effects in a heterogeneous and complex population. The identification of possible biomarkers could guide treatment choices and identify patients who will benefit from specific treatments, thus providing personalized medicine to the older cancer patient population.
Supplemental Material
Download MS Word (32.3 KB)Disclosure statement
No potential conflict of interest was reported by the authors.
Additional information
Funding
Related Research Data
References
- Clarke-Pearson DL. Clinical practice. Screening for ovarian cancer. N Engl J Med. 2009;361:170–177.
- Prat J. Ovarian carcinomas: five distinct diseases with different origins, genetic alterations, and clinicopathological features. Virchows Arch. 2012;460:237–249.
- Prat J. Staging classification for cancer of the ovary, fallopian tube, and peritoneum. Int J Gynaecol Obstet. 2014;124:1–5.
- Cancer Genome Atlas Research Network. Integrated genomic analyses of ovarian carcinoma. Nature. 2011;474:609–615.
- Verhaak RG, Tamayo P, Yang JY, et al. Prognostically relevant gene signatures of high-grade serous ovarian carcinoma. J Clin Invest. 2013;123:517–525.
- Grabowski JP, Sehouli J. Current management of ovarian cancer. Minerva Med. 2015;106:151–156.
- Smith BD, Smith GL, Hurria A, et al. Future of cancer incidence in the United States: burdens upon an aging, changing nation. J Clin Oncol. 2009;27:2758–2765.
- Hensley MA, Chi D. Ovarian and fallopian-tube cancer. In: Handbook of gynecologic oncology [Internet]. London: Martin Dunitz; 2002.
- Or Knudsen A, Schledermann D, Nyvang GB, et al. Trends in gynecologic cancer among elderly women in Denmark, 1980–2012. Acta Oncol. 2016;55:65–73.
- Anisimov VN. Biology of aging and cancer. Cancer Control. 2007;14:23–31.
- Leth-Larsen R, Terp MG, Christensen AG, et al. Functional heterogeneity within the CD44 high human breast cancer stem cell-like compartment reveals a gene signature predictive of distant metastasis. Mol Med. 2012;18:1109–1121.
- Aparicio T, Schischmanoff O, Poupardin C, et al. Deficient mismatch repair phenotype is a prognostic factor for colorectal cancer in elderly patients. Dig Liver Dis. 2013;45:245–250.
- Tsao AS, Liu S, Lee JJ, et al. Clinical outcomes and biomarker profiles of elderly pretreated NSCLC patients from the BATTLE trial. J Thorac Oncol. 2012;7:1645–1652.
- Jorgensen TL, Hallas J, Friis S, et al. Comorbidity in elderly cancer patients in relation to overall and cancer-specific mortality. Br J Cancer. 2012;106:1353–1360.
- Wedding U, Honecker F, Bokemeyer C, et al. Tolerance to chemotherapy in elderly patients with cancer. Cancer Control. 2007;14:44–56.
- Hurria A, Dale W, Mooney M, et al. Designing therapeutic clinical trials for older and frail adults with cancer: U13 conference recommendations. J Clin Oncol. 2014;32:2587–2594.
- Szajnik M, Czystowska-Kuzmicz M, Elishaev E, et al. Biological markers of prognosis, response to therapy and outcome in ovarian carcinoma. Expert Rev Mol Diagn. 2016;16:811–826.
- Kauffmann A, Gentleman R, Huber W. arrayQualityMetrics – a bioconductor package for quality assessment of microarray data. Bioinformatics (Oxford, England). 2009;25:415–416.
- Bolstad BM, Irizarry RA, Astrand M, et al. A comparison of normalization methods for high density oligonucleotide array data based on variance and bias. Bioinformatics (Oxford, England). 2003;19:185–193.
- Dennis G Jr., Sherman BT, Hosack DA, et al. DAVID: database for annotation, visualization, and integrated discovery. Genome Biol. 2003;4:P3.
- Atlas HP. The human protein atlas; [cited 2018 Jun 15]. Available from: https://www.proteinatlas.org/
- Uhlen M, Zhang C, Lee S, et al. A pathology atlas of the human cancer transcriptome. Science. 2017; 357. DOI: 10.1126/science.aan2507
- Lanczky A, Nagy A, Bottai G, et al. miRpower: a web-tool to validate survival-associated miRNAs utilizing expression data from 2178 breast cancer patients. Breast Cancer Res Treat. 2016;160:439–446.
- Miura K, Jacques KM, Stauffer S, et al. ARAP1: a point of convergence for Arf and Rho signaling. Mol Cell. 2002;9:109–119.
- Daniele T, Di Tullio G, Santoro M, et al. ARAP1 regulates EGF receptor trafficking and signalling. Traffic. 2008;9:2221–2235.
- Simova S, Klima M, Cermak L, et al. Arf and Rho GAP adapter protein ARAP1 participates in the mobilization of TRAIL-R1/DR4 to the plasma membrane. Apoptosis. 2008;13:423–436.
- Normanno N, De Luca A, Bianco C, et al. Epidermal growth factor receptor (EGFR) signaling in cancer. Gene. 2006;366:2–16.
- Szajnik M, Szczepanski MJ, Elishaev E, et al. 17beta hydroxysteroid dehydrogenase type 12 (HSD17B12) is a marker of poor prognosis in ovarian carcinoma. Gynecol Oncol. 2012;127:587–594.
- Dong Y, Loessner D, Irving-Rodgers H, et al. Metastasis of ovarian cancer is mediated by kallikrein related peptidases. Clin Exp Metastasis. 2014;31:135–147.
- Sheu JJ, Shih Ie M. Clinical and biological significance of HLA-G expression in ovarian cancer. Semin Cancer Biol. 2007;17:436–443.
- Rutten MJ, Dijk F, Savci-Heijink CD, et al. HLA-G expression is an independent predictor for improved survival in high grade ovarian carcinomas. J Immunol Res. 2014;2014:1.
- Zorn KK, Tian C, McGuire WP, et al. The prognostic value of pretreatment CA 125 in patients with advanced ovarian carcinoma: a Gynecologic Oncology Group study. Cancer. 2009;115:1028–1035.
- Simon RM, Paik S, Hayes DF. Use of archived specimens in evaluation of prognostic and predictive biomarkers. J Natl Cancer Inst. 2009;101:1446–1452.
- Suri A, Saini S, Sinha A, et al. Cancer testis antigens: a new paradigm for cancer therapy. Oncoimmunology. 2012;1:1194–1196.
- Garg M, Chaurasiya D, Rana R, et al. Sperm-associated antigen 9, a novel cancer testis antigen, is a potential target for immunotherapy in epithelial ovarian cancer. Clin Cancer Res. 2007;13:1421–1428.
- Jagadish N, Fatima R, Sharma A, et al. Sperm associated antigen 9 (SPAG9) a promising therapeutic target of ovarian carcinoma. Tumour Biol. 2018;40:101042831877365.
- Garg M, Kanojia D, Salhan S, et al. Sperm-associated antigen 9 is a biomarker for early cervical carcinoma. Cancer. 2009;115:2671–2683.
- Kanojia D, Garg M, Gupta S, et al. Sperm-associated antigen 9, a novel biomarker for early detection of breast cancer. Cancer Epidemiol Biomarkers Prev. 2009;18:630–639.
- Garg M, Kanojia D, Khosla A, et al. Sperm-associated antigen 9 is associated with tumor growth, migration, and invasion in renal cell carcinoma. Cancer Res. 2008;68:8240–8248.
- Hetland TE, Nymoen DA, Emilsen E, et al. MGST1 expression in serous ovarian carcinoma differs at various anatomic sites, but is unrelated to chemoresistance or survival. Gynecol Oncol. 2012;126:460–465.
- Johansson K, Jarvliden J, Gogvadze V, et al. Multiple roles of microsomal glutathione transferase 1 in cellular protection: a mechanistic study. Free Radic Biol Med. 2010;49:1638–1645.