
Abstract
Objectives: Women diagnosed with breast cancer are offered treatment and therapy based on tumor characteristics, including tumor diameter. There is scarce knowledge whether tumor diameter is accurately reported, or whether it is unconsciously rounded to the nearest half-centimeter (terminal digit preference). This study aimed to assess the precision (number of digits) of breast cancer tumor diameters and whether they are affected by terminal digit preference. Furthermore, we aimed to assess the agreement between mammographic and histopathologic tumor diameter measurements.
Material and Methods: This national registry study included reported mammographic and registered histopathologic tumor diameter information from the Cancer Registry of Norway for invasive breast cancers diagnosed during 2012–2016. Terminal digit preference was assessed using histograms. Agreement between mammographic and histopathologic measurements was assessed using the intraclass correlation coefficient (ICC) and Bland-Altman plots.
Results: Mammographic, histopathologic, or both tumor measurements were available for 7792, 13,541 and 6865 cases, respectively. All mammographic and 97.2% of histopathologic tumor diameters were recorded using whole mm. Terminal digits of zero or five were observed among 38.7% and 34.8% of mammographic and histopathologic measurements, respectively. There was moderate agreement between the two measurement methods (ICC = 0.52, 95% CI: 0.50–0.53). On average, mammographic measurements were 1.26 mm larger (95% limits of agreement: −22.29–24.73) than histopathologic measurements. This difference increased with increasing tumor size.
Conclusion: Terminal digit preference was evident among breast cancer tumor diameters in this nationwide study. Further studies are needed to investigate the potential extent of under-staging and under-treatment resulting from this measurement error.
Introduction
Preferential overrepresentation of certain terminal digits (terminal digit preference) is a well-known source of measurement error in medicine, including the measurement of malignant tumors [Citation1–3]. Some evidence suggests that pathologists measuring breast tumor diameter favor terminal digits of zero or five, though few studies have evaluated this type of measurement error as a primary objective [Citation3–6]. Moreover, terminal digit preference in breast radiology is not well described.
Pretreatment clinical tumor size (cT) informs neoadjuvant and surgical treatment decisions, while pathological tumor size (pT) informs adjuvant therapy and follow-up. The tumor-node-metastasis (TNM) framework defines breast tumor size categories (T categories) T1–T3 based on maximum diameter, where T1: ≤20 mm, T2: >20–50 mm, and T3: >50 mm [Citation7,Citation8]. T4 refers to any tumor with direct extension to the chest wall and/or skin, and TX refers to cases where the tumor diameter has not or cannot be assessed [Citation7–9].
In Norway, the clinician responsible for securing a patient’s diagnosis reports the cT category from either palpation (calipers), ultrasound, mammography, or magnetic resonance imaging. In the absence of information from palpation, radiologic imaging, including mammography, provides influential information when determining cT, but cT can under- or overestimate pT [Citation10,Citation11]. Accurate estimates of cT and pT are important for optimal clinical decision-making and personalized treatment.
The World Health Organization (WHO) and American Joint Committee on Cancer have advised for many years that breast cancer tumor measurements be reported to the nearest mm – recent editions provide detailed guidance on rounding [Citation7–9]. Norwegian guidelines are based on the WHO guidelines and also adhere to those from the national breast cancer screening program, BreastScreen Norway [Citation12,Citation13].
In Norway, mammographic and histopathological tumor diameters are routinely reported and registered at the Cancer Registry of Norway (CRN). We wanted to determine whether terminal digit preference was present among these population-based data, and describe the precision to which pathologic tumor diameter was reported. As a secondary objective, we aimed to assess the agreement between mammographic and histopathologic tumor diameter measurements.
Methods
Data source
All data were extracted from the CRN. Mandatory reporting of cancer cases from multiple sources ensures complete and high quality data [Citation14,Citation15]. Roughly 30% of all breast cancers nationwide are screen-detected through BreastScreen Norway, which is administered by the CRN and offers biennial mammographic screening to all female residents aged 50–69 [Citation15,Citation16].
Information about mammographic and histopathologic tumor diameter is sent to the CRN via standardized electronic radiology reports from radiologists, and via electronic or paper-based histopathology reports from pathologists. Radiology reports are registered automatically at the CRN, while histopathology reports are registered manually.
Study sample
We included information about mammographic and histopathological tumor diameter from all incident invasive breast cancers diagnosed during 2012–2016 among women residing in Norway.
The first invasive breast cancer diagnosed per woman during the study period was included. Only the largest lesion was included for women diagnosed with multifocal or bilateral breast cancer. We excluded women with pT4 lesions, cases where the longest measured mammographic or histopathologic tumor diameter was ≥100 mm, and cases with no recorded tumor diameter (e.g., pTX).
This project was approved by Oslo University Hospital’s privacy ombudsman (PVO 19/02585) [Citation17].
Study variables
We extracted information about women’s age and year of diagnosis, and mode of detection, which was classified as screen-detected (diagnosed within six months after a positive screening mammogram in BreastScreen Norway), or clinically detected (not screen-detected). Histologic tumor classification (invasive carcinoma of no special type (NST), lobular, or other), the largest mammographic and histopathologic tumor diameter measured (mm; hereafter referred to as mammographic and histopathologic tumor diameter, respectively), and cT and pT classifications were also extracted.
Mammographic tumor diameter
Mammographic tumor diameter was measured on digitally acquired images using electronic calipers in a clinical setting by the examining radiologist. Measurements could be taken from screening or diagnostic mammographic examinations, from either standard 2D images (with or without contrast), spot compression views (with or without magnification), tomosynthesis images, or synthetic 2D images derived from tomosynthesis. Images were displayed on DICOM-compliant workstations after retrieval from a picture archiving and communication system (PACS). The type of mammography equipment, viewing workstations, and PACS varied between centers.
There are no national guidelines describing mammographic tumor measurement methods. For mammographically visible cases, radiologists typically reported the tumor diameter in whole mm in the patient’s radiology report on the day of the examination. Thereafter, this measurement was entered into the report sent to the CRN.
Histopathologic tumor diameter
Based on national recommendations, tumor diameter was determined from microscopic slides by measuring the outermost boundaries of the invasive lesion, and measured to the nearest mm using a transparent ruler [Citation12]. If this could not be done using the available slides, the measurement was based on the macroscopic examination (formalin fixed specimen), either from a single tissue slice, or as an estimate across all tissue slices containing microscopically verified invasive tumor tissue [Citation7].
Measurement precision
All mammographic measurements must be sent to the CRN as whole mm.
Histopathologic tumor diameter could be registered with one decimal place if it was reported as such (e.g., for small invasive lesions), but national recommendations advise pathologists to report tumor diameter using whole mm [Citation12,Citation13].
T-category information
The clinician responsible for securing a patient’s diagnosis, often the patient’s surgeon, reported the cT category directly to the CRN. Due to a high proportion of missing and unavailable data [Citation18], we derived a surrogate assessment, mT, using the mammographic tumor diameter. The mT variable was used in all analyses requiring information about cT.
The pT category was manually set by dedicated coders at the CRN based on the maximum tumor diameter and tumor invasion information included in the submitted pathology reports.
Statistical analysis
Descriptive results were presented as means (standard deviations, SDs, or ranges), or frequencies (%). Histograms were used to present the frequency distributions of tumor diameter measurements, stratified by measurement type (mammographic vs histopathologic), and the number of decimal places (zero or one). To focus on the cut-points for T1–T3 tumors, some figures were restricted to cases with tumors ≤55 mm. Using the same stratification variables, we reported the proportion of different terminal digits among tumors of varying sizes and used histograms to visualize overall terminal digit frequencies.
To study agreement between mammographic and histopathologic tumor diameter for cases where both measurements were available, we estimated means and 95% confidence intervals (CIs); Pearson’s correlation coefficient (r) and an asymptotic 95% CI based on Fisher’s z transformation; and the intraclass correlation coefficient (ICC) and 95% CI based on a single measurement, one-way random effects model for absolute agreement [Citation19]. A scatterplot and Bland-Altman plot were used to visualize the differences between mammographic and histopathologic measurements and to calculate the absolute and relative mean differences and 95% limits of agreement (LOA) using raw and natural log transformed data. We presented the relative mean difference and 95% LOA because the magnitude of the differences appeared to be associated with tumor diameter [Citation20]. Lastly, the mT and pT categories were compared using proportions of agreement/disagreement, and a weighted Kappa with Cicchetti-Allison weights (κw). Bowker’s test was used to test symmetry.
An ad hoc analysis of cases with a terminal digit of zero or five from mammography or histopathology was conducted using a scatterplot, and Bland-Altman plots for raw and natural log transformed data.
All statistical analyses were performed in R version 3.5.0 for Windows [Citation21]. The irr package was used to calculate the ICC and corresponding CI, while the DescTools package was used to calculate κw and its corresponding CI [Citation22,Citation23].
Results
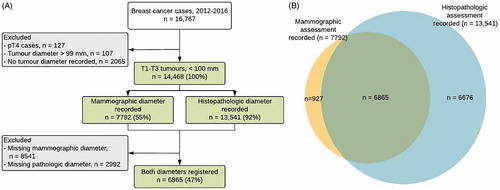
During 2012–2016, 16,767 women were diagnosed with invasive breast cancer in Norway. After applying exclusion criteria, the final study sample consisted of 14,468 invasive breast tumors with mammographic or histopathologic tumor diameter information in the same number of women (. Tumor diameter information from mammography, histopathology, or both sources was available for 7792; 13,541; and 6865 cases, respectively ().
Figure 1. (A) Flow diagram (B) Venn diagram indicating whether tumor diameter information on mammographic (yellow area), histopathologic (blue area), or both (green area) was available for women diagnosed with invasive T1–T3 breast cancer in Norway during 2012–2016, n = 14,468.
The mean age at diagnosis in the final study sample was 62 years (range 23–103), and 57% of women were aged 50–69 (). Overall, roughly 35% of cancers were screen-detected, and 82% of all cancers were invasive carcinoma of no special type (). The subsample of women with mammographic tumor information was slightly older than that with histopathologic information (means (SDs) 62.2 (11.7), and 61.7 (12.6) years, respectively).
Table 1. Characteristics of women diagnosed with invasive T1–T3 breast cancer in Norway during 2012–2016, n = 14,468, stratified by whether mammographic, histopathologic , or both assessments were available.
Precision
All mammographic tumor diameters were recorded as whole numbers (median 18 mm, range 1–99). Nearly all (97.2%, n = 13,167) of the histopathologic diameters were recorded as whole numbers (median 17 mm, range 1–95); the remaining cases (2.8%) were recorded with a single decimal (median 7.4 mm, range 0.1–50.1).
Terminal digit preference
Histograms of the distribution of mammographic and histopathologic tumor diameters recorded as whole numbers showed high frequencies of multiples of five and drops around these peaks that corresponded to numbers ending in one, four, six, or nine ((A,B)). A histogram of the histopathologic tumor diameters recorded with one decimal place also showed a high frequency had a terminal digit of five (Supplementary Figure S1).
Figure 2. Longest measured tumor diameter recorded for T1–T3 breast cancers (≤55 mm) diagnosed during 2012–2016, based on (A) mammography (n = 7792) and (B) histopathology (whole numbers only; n = 13,167); light blue bars emphasize tumor diameters with zero or five as a terminal digit. The lower panels indicate the frequency of terminal digits from the longest measured tumor diameter (≤100 mm) for T1–T3 breast cancers diagnosed during 2012–2016, based on (C) mammography (whole numbers only; n = 7792), (D) histopathology (whole numbers only; n = 13,167), and (E) histopathology (decimals only; n = 374).
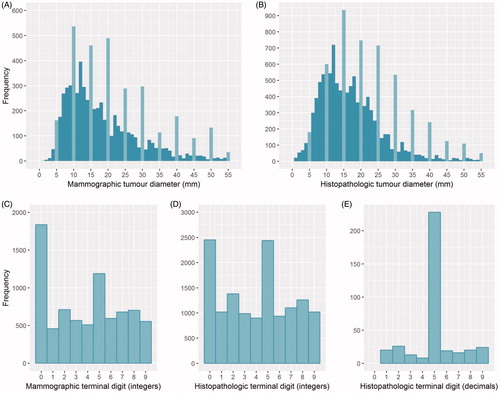
Histograms of the terminal digits from mammographic and histopathologic tumor diameters recorded as whole numbers also showed a high frequency of zeroes and fives, compared to ones, fours, sixes, and nines (). A terminal digit of zero was more frequent than five among tumor diameters measured from mammography (23.4% and 15.3%, respectively), but not from histopathology (17.9% for both; Supplementary Table S1). The proportion of tumor diameters with terminal digit of five generally increased as mammographic or histopathologic tumor diameter increased. This was also observed for a terminal digit of zero, but only for tumors ≥20 mm (Supplementary Table S1). Among the histopathologic measurements recorded with one decimal, 61% of cases had a decimal value of five, and none had a decimal value of zero ().
Agreement between mammographic and histopathologic assessments
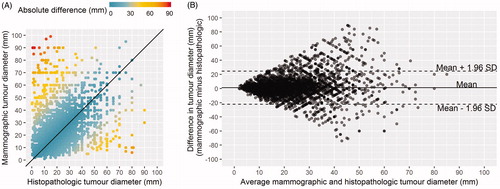
Among cases for which a mammographic and histopathologic tumor diameter were available (n = 6865), the median (range) tumor diameters were 16 mm (1–99) and 15 mm (0.1–90), respectively. We observed moderate correlation between the two assessments: r = 0.52 (95% CI: 0.51–0.54), and ICC = 0.52 (95% CI: 0.50–0.53). On average, mammographic tumor diameters were 1.26 mm (95% LOA: −22.29–24.73) larger than the corresponding histopathologic diameters. However, there was evidence of disagreement in both directions, and agreement between the two decreased as the average tumor diameter increased (). On a relative scale, the mammographic tumor diameters were 1.06 times (6%) larger than the pathologic values (95% LOA: 0.34–3.28) (Supplementary Figure S2). A subgroup analysis stratified by histologic type showed that for invasive NST, lobular, or other carcinomas, the mammographic tumor diameters were, on average, 1.53 mm (95% LOA: −21.39–24.45) larger, 1.59 mm (95% LOA: −28.85–25.67) smaller, and 2.04 mm (95% LOA: −21.06–25.14) larger than the corresponding histopathologic measurements, respectively.
Figure 3. Maximum tumor diameters for T1–T3 breast cancers diagnosed in Norway during 2006–2012, n = 6865. (A) Scatterplot displaying the maximum histopathologic tumor diameter (mm; x-axis) versus the maximum mammographic tumor diameter (mm; y-axis), where the solid line indicates perfect agreement (B) Bland-Altman plot illustrating the difference in tumor size measurement (mm) between mammographic and histopathologic measurements, against the average of the two measurements (mm). The solid line represents the mean difference, while the top and bottom dashed lines represent the upper and lower limits of agreement, respectively.
Ad hoc analysis of all cases with mammographic and histopathologic tumor diameter with a terminal digit of zero or five (n = 3890) displayed clear graphical patterns in the scatter plot (checkerboard pattern) and the Bland-Altman plots (lattice pattern; Supplementary Figure S3).
The mT and pT categories were the same in 5313 cases (77%), while the mT category was highest in 823 (53%) of the discordant cases (psymmetry<0.0001; ). Overall, there was moderate agreement between the mT and pT categories: κw=0.50, 95% CI: 0.48–0.53.
Table 2. Contingency table of mammographic vs histopathologic tumor categories (pT), n = 6865.
Discussion
Terminal digit preference in the measurement of breast tumors is not well-studied and only one of four previously published studies on this topic used population-based data [Citation3–6]. Our results from nationwide cancer registry data showed evidence of terminal digit preference for zeroes and fives in the reporting of maximum mammographic and histopathologic tumor diameters of invasive breast cancers diagnosed during 2012–2016. This measurement error can lead to T-category misclassification and has the potential to impact patient treatment. Further, we observed moderate agreement between mammographic and pathologic tumor diameter. Mammographic tumor diameter both over- and underestimated histopathologic tumor diameter, and the absolute discrepancy between the two measurements increased with increasing tumor diameter.
Among histopathologic tumor diameters, 97.3% of cases were registered as whole mm, and the majority of those reported with decimal values were <10 mm. This is a slight overestimate of the number of cases reported as whole mm by pathologists because decimal values of zero are truncated when registered at the CRN. More explicit national guidance may improve compliance in reporting tumor diameter to the nearest mm, as advised by international guidelines [Citation7,Citation8].
The overrepresentation of tumor diameters with a terminal digit of zero or five corresponded largely to whole and half cm values ≥1 cm on mammography and ≥1.5 cm from histopathology. The resulting measurement error appeared to be due in equal parts to rounding up and down to the nearest whole or half cm value. A recent Dutch study suggested that pathologists avoided reporting T category border values of 10 mm and 20 mm, however, these results have not been corroborated [Citation3–6]. In our study, terminal digit preference led to an excess of tumors recorded as 10, 20, or 50 mm, which define the border values for T1c, T2, and T3 tumors [Citation7–9]. Any tendency to underestimate tumor diameter by rounding down to the nearest cm increases the likelihood of under-staging tumors with respect to their T category and could lead to under-treatment. This limitation of the TNM system was pointed out as early as 2006, but even recent suggestions to simplify the TNM system have overlooked this shortcoming [Citation4,Citation24].
On the other hand, rounding up to 10, 20 or 50 mm does not change the T category and therefore does not directly lead to over-staging (e.g., an 18 mm tumor rounded up to 20 mm is classified as T1 in either situation). A tumor that is under a boundary value (e.g., 18 mm; T1) and is rounded up to over the boundary value (e.g., 21 mm; T3) would result in over-staging in terms of the T category, but our study does not provide evidence about whether this type of rounding occurs.
Without knowing which specific cases are affected by terminal digit preference, it is difficult to speculate the scope of the clinical implications of this measurement error. Studies that report treatment data and re-measure histopathologic samples are needed to quantify the number of women who may potentially be undertreated for their breast cancer due to under-staging and could have important consequences for decisions regarding neoadjuvant treatment and surgical planning, as well as the use of chemo and radiation therapy and response monitoring.
On average, we observed that mammographic tumor diameters were slightly larger than the corresponding histopathologic measurements. However, the 95% LOA for this estimate was wide and indicated that both under- and overestimation can occur, as has been observed in other studies [Citation10,Citation11,Citation25]. We observed decreasing absolute agreement between mammographic and histopathologic tumor diameter measurements as tumor size increases, which supports previous findings [Citation10,Citation25]. Despite the measurement differences in mammographic and histopathologic tumor diameter, the mT and pT categories assigned to a case were the same in over 75% of cases. In the remaining cases, particularly the <2% categorized as mT3 and pT1 or vice-versa, more accurate mammographic measurement may have increased the likelihood of breast conserving surgery, or reduced the need for reoperation.
When considering histologic subtype, our study indicated that mammography underestimates histopathologic tumor diameter for lobular carcinomas, but results from two single-centre studies indicate the opposite [Citation10,Citation26]. This discrepancy may be due to sampling variability, as these two studies evaluated 99 [Citation10] and 18 [Citation26] cases of lobular carcinoma and diffuse tumors can be difficult to measure. Our findings corroborate those from a multicentre cohort study that analyzed 474 cases of lobular carcinoma, but do not corroborate their finding that mammography underestimates histopathologic tumor diameter for invasive carcinomas NST [Citation25]. Both our study and that of Stein et al. [Citation25] used retrospective data and had similar inclusion criteria, but the difference between mammographic and histopathologic tumor diameter was roughly 1.5 mm larger across all subgroups in our study, which would have been enough to change the direction of the association observed for the sub-analysis of invasive carcinomas NST. Because the study samples were similar, we believe that differences in measurement practices between countries can explain this discrepancy.
Discrepancies between mammographic and histopathologic measurements can occur due to differential terminal digit preference between radiologists and pathologists, or because the measurements are taken at different times and potentially from different axes of the tumor. They may also be attributed to measurement challenges associated with endocrine responsiveness, mammographic breast density, diffuse or multifocal lesions, or shrinkage as a result of neoadjuvant treatment or formalin fixation [Citation10,Citation11,Citation25,Citation26]. Moreover, histopathologic measurements can be influenced by the degree of sampling, particularly from the tumor periphery and surrounding tissues. We included only invasive T1-T3 breast cancer cases and aimed to exclude those who received neoadjuvant treatment (pTX) to mitigate some of these challenges.
Our study design did not allow us to determine whether terminal digit preference is associated with factors that complicate accurate tumor measurement; this was a limitation of our study. We hypothesize that only factors that obscure the tumor periphery (e.g., multifocal or diffuse lesions) may be associated with increased terminal digit preference, and future studies might investigate this topic. With respect to our secondary outcome – agreement between mammographic and histopathologic tumor diameter measurements – determining whether factors such as breast density confounded the relationships we observed was outside the scope of this study. This was another limitation of our study.
To the best of our knowledge, studies measuring the agreement between mammographic and histopathologic tumor diameter have not considered the potential for measurement error due to terminal digit preference. In our study, the effects of this preference can be seen in the checkerboard pattern arising in the scatterplot and lattice pattern arising in the Bland-Altman plots. These patterns are also visible in the plots of other agreement studies, which suggests that terminal digit preference is prevalent in the measurement of tumor diameter from mammography and histopathology, as well as from clinical examination, ultrasound and MRI [Citation10,Citation11,Citation25,Citation27]. Terminal digit preference is therefore an important source of measurement error in cT-category staging. This source of measurement error should be more widely discussed and potentially taken into account when making neoadjuvant and surgical treatment decisions, particularly for borderline cases.
The use of prospectively collated data from a population-based registry is a strength of our study. Reporting to the CRN is mandated by law, and clinicians working in oncology do so as a part of routine clinical practice. The data included in this study are continually used for research and surveillance of BreastScreen Norway, and are constantly assured by clinicians working in the program. Moreover, pathologic tumor diameter data at the CRN are subject to annual quality assurance against the original pathology report, as described in the appendix. This validation work has not been documented extensively, but studies using colorectal cancer data from the CRN and registry-based breast cancer data in Denmark and Sweden support the notion that pathological breast cancer tumor diameter data at the CRN reflects that from the original pathology report [Citation28–30]. Furthermore, the data used in this study are not affected by clinicians’ awareness of being studied (the Hawthorne effect) [Citation31]. Our results therefore reflect national standard clinical practice.
Although our sample includes tumor measurements from a national pool of radiologists and pathologists, our study did not include information about the individual clinicians who performed the measurements, and it was not possible to investigate inter- or intra-observer trends. Moreover, we did not have information about the specific conditions in which the mammographic tumor diameter measurements took place, for example, whether standard 2D images or tomographic images were used. This is unlikely to be a major limitation since tumor diameter measurements from both techniques are relatively similar compared to histopathology [Citation32]. Additionally, the reasons for missing tumor diameter data are unclear: data could have been missing because the clinicians were unable to measure the tumor (e.g., due to it being mammographically occult), because they failed to record the measured value, or because the recorded value was not sent to the CRN. The latter is the most likely explanation for the majority of missing mammographic information as this data cannot be submitted by centers that are not affiliated with BreastScreen Norway [Citation33]. Nonetheless, the overall reporting rate has improved since 2012, and was 72% in 2016 [Citation33,Citation34]. Only 3% of histopathologic tumor diameter information was missing for women who had surgery for breast cancer during 2009–2011 [Citation35], thus missing histopathologic tumor diameter information in our study is likely due to women receiving neoadjuvant therapy (where post-treatment staging, ypT, is reported instead of pT). No reason for missing data seems likely to have caused any systematic bias in the terminal digits of tumor diameters in the final sample.
In this population-based study, we observed a preference for reporting tumor diameters with terminal digits of zero or five, corresponding to whole and half centimeter values. Further, our results support the notion that absolute agreement between mammographic and histopathologic tumor diameter is moderate and decreases with increasing tumor size. The current guidelines for TNM staging do not consider terminal digit preference and histopathological review studies are needed to investigate the potential extent of under-staging and under-treatment resulting from this source of measurement error.
Supplemental Material
Download (265.9 KB)Disclosure statement
No potential conflict of interest was reported by the authors.
Correction Statement
This article has been republished with minor changes. These changes do not impact the academic content of the article.
Additional information
Funding
Related Research Data
References
- Hayes SJ. Terminal digit preference occurs in pathology reporting irrespective of patient management implication. J Clin Pathol. 2008;61(9):1071–1072.
- Veierød MB, Page CM, Aaserud S, et al. Melanoma staging: varying precision and terminal digit clustering in Breslow thickness data is evident in a population-based study. J Am Acad Dermatol. 2018;79(1):118–125.e1.
- den Bakker MA, Damhuis RAM. Pentameric last-digit preference and stage border avoidance in pathology measurement. Histopathology. 2018;73(3):510–513.
- Coburn NG, Clarke-Pearson E, Chung MA, et al. A novel approach to T classification in tumor-node-metastasis staging of breast cancer. Am J Surg. 2006;192(4):434–438.
- Tabár L, Tucker L, Davenport RR, et al. The use of mammographic tumour feature significantly improves outcome prediction of breast cancers smaller than 15 mm: a reproducibility study from two comprehensive breast centres. Memo. 2011;4(3):149–157.
- Verschraegen C, Vinh-Hung V, Cserni G, et al. Modeling the effect of tumor size in early breast cancer. Ann Surg. 2005;241(2):309–318.
- Badve SS, Beitsch PD, Bose S, et al. Part XI, Breast In: Amin MB, Edge S, Greene F, et al. editors. AJCC Cancer Staging Manual. 8th ed. Heidelberg, (Germany): Springer International Publishing; 2017.
- Union for International Cancer Control. TNM classification of malignant tumours In: Brierley JD, Gospodarowicz MK, Wittekind C, editors. 8th ed. Oxford, UK & Hoboken, NJ: John Wiley & Sons; 2016.
- Hayes DF, Allred C, B.O A, et al. Part VII, Breast In: Edge S, Byrd D, Compton CC, et al. editors. AJCC Cancer Staging Manual. 7th ed. Heidelberg, (Germany): Springer International Publishing; 2010.
- Heusinger K, Lohberg C, Lux MP, et al. Assessment of breast cancer tumor size depends on method, histopathology and tumor size itself*. Breast Cancer Res Tr. 2005;94(1):17–23.
- Marinovich ML, Macaskill P, Irwig L, et al. Agreement between MRI and pathologic breast tumor size after neoadjuvant chemotherapy, and comparison with alternative tests: individual patient data meta-analysis. BMC Cancer. 2015;15(1):662.
- Brystkreft – handlingsprogram [Internet]. Oslo: Norwegian Directorate of Health; 2019. [updated 2019/01/17; cited 2019/04/05]. Available from: https://helsedirektoratet.no/retningslinjer/nasjonalt-handlingsprogram-med-retningslinjer-for-diagnostikk-behandling-og-oppfolging-av-pasienter-med-brystkreft
- Kvalitetsmanual i Mammografiprogrammet – Patologi. Oslo: Mammografiprogrammet, Kreftregisteret; 2018. Available from: https://www.kreftregisteret.no/globalassets/publikasjoner-og-rapporter/mammografiprogrammet/20180206_kvalitetsmanual-patologi---nettversjon_med-forside.pdf
- Larsen IK, Smastuen M, Johannesen TB, et al. Data quality at the Cancer Registry of Norway: an overview of comparability, completeness, validity and timeliness. Eur J Cancer. 2009;45(7):1218–1231.
- Cancer Registry of Norway. Cancer in Norway 2016 – cancer incidence, mortality, survival and prevalence in Norway. Oslo Cancer Registry of Norway; 2017.
- Hofvind S, Tsuruda K, Mangerud G, et al. The Norwegian Breast Cancer Screening Program, 1996-2016: celebrating 20 years of organised screening in Norway. Oslo: Cancer Registry of Norway; 2017.
- Forskrift om innsamling og behandling av helseopplysninger i Kreftregisteret (Kreftregisterforskriften) [Regulations on the collection and processing of personal health data in the Cancer Registry of Norway (Cancer Registry Regulations)], FOR-2001-12-21-1477 2002. Norwegian.
- Larsen IK, Myklebust TÅ, Johannesen TB, et al. Stage-specific incidence and survival of breast cancer in Norway: The implications of changes in coding and classification practice. Breast. 2018;38:107–113.
- Koo TK, Li MY. A guideline of selecting and reporting intraclass correlation coefficients for reliability research. J Chiropr Med. 2016;15(2):155–163.
- Bland JM, Altman DG. Statistical methods for assessing agreement between two methods of clinical measurement. Lancet. 1986;327(8476):307–310.
- R Core Team. R: a language and environment for statistical computing. version 3.5.0. Vienna, Austria: R Foundation for Statistical Computing; 2018.
- Gamer M, Lemon J, Singh IFP. irr: Various coefficients of interrater reliability and agreement. Version 0.84. 2012.
- Signorell A, Aho K, Alfons A, et al. DescTools: tools for descriptive statistics. Version 0.99.26. 2018.
- Pineros M, Parkin DM, Ward K, et al. Essential TNM: a registry tool to reduce gaps in cancer staging information. Lancet Oncol. 2019;20(2):e103–e11.
- Stein RG, Wollschlager D, Kreienberg R, et al. The impact of breast cancer biological subtyping on tumor size assessment by ultrasound and mammography – a retrospective multicenter cohort study of 6543 primary breast cancer patients. BMC Cancer. 2016;16(1):459.
- Gruber IV, Rueckert M, Kagan KO, et al. Measurement of tumour size with mammography, sonography and magnetic resonance imaging as compared to histological tumour size in primary breast cancer. BMC Cancer. 2013;13(1):328.
- Hieken TJ, Harrison J, Herreros J, et al. Correlating sonography, mammography, and pathology in the assessment of breast cancer size. Am J Surg. 2001;182(4):351–354.
- Cronin-Fenton DP, Kjaersgaard A, Ahern TP, et al. Validity of Danish Breast Cancer Group (DBCG) registry data used in the predictors of breast cancer recurrence (ProBeCaRe) premenopausal breast cancer cohort study. Acta Oncol. 2017;56(9):1155–1160.
- Sakkestad ST, Olsen BC, Karliczek A, et al. Validity of Norwegian Rectal Cancer Registry data at a major university hospital 1997-2005. Acta Oncol. 2015;54(10):1723–1728.
- Lofgren L, Eloranta S, Krawiec K, et al. Validation of data quality in the Swedish National Register for Breast Cancer. BMC Public Health. 2019;19(1):495
- Porta M. A Dictionary of Epidemiology. Oxford, UK: Oxford University Press; 2008.
- Marinovich ML, Macaskill P, Bernardi D, et al. Systematic review of agreement between tomosynthesis and pathologic tumor size for newly diagnosed breast cancer and comparison with other imaging tests. Expert Rev Med Devices. 2018;15(7):489–496.
- Cancer Registry of Norway. Årsrapport 2017 med resultater og forbedringstiltak fra Nasjonalt kvalitetsregister for brystkreft. [National quality registry for breast cancer annual report, 2017]. Oslo: Cancer Registry of Norway; 2018. Norwegian.
- Cancer Registry of Norway. Årsrapport 2016 med resultater og forbedringstiltak fra Nasjonalt kvalitetsregister for brystkreft. [National quality registry for breast cancer annual report, 2016]. Oslo: Cancer Registry of Norway; 2017. Norwegian.
- Cancer Registry of Norway. Patologirapport. [Pathology report]. Oslo: Cancer Registry of Norway; 2015. Norwegian.