
 ?Mathematical formulae have been encoded as MathML and are displayed in this HTML version using MathJax in order to improve their display. Uncheck the box to turn MathJax off. This feature requires Javascript. Click on a formula to zoom.
Abstract
Background: The interest in generating “synthetic computed tomography (CT) images” from magnetic resonance (MR) images has been increasing over the past years due to advances in MR guidance for radiotherapy. A variety of methods for synthetic CT creation have been developed, from simple bulk density assignment to complex machine learning algorithms.
Material and methods: In this study, we present a general method to determine simplistic synthetic CTs and evaluate them according to their dosimetric accuracy. It separates the requirements on the MR image and the associated calculation effort to generate a synthetic CT. To evaluate the significance of the dosimetric accuracy under realistic conditions, clinically common uncertainties including position shifts and Hounsfield lookup table (HLUT) errors were simulated. To illustrate our approach, we first translated CT images from a test set of six pelvic cancer patients to relative electron density (ED) via a clinical HLUT. For each patient, seven simplified ED images (simED) were generated at different levels of complexity, ranging from one to four tissue classes. Then, dose distributions optimised on the reference ED image and the simEDs were compared to each other in terms of gamma pass rates (2 mm/2% criteria) and dose volume metrics.
Results: For our test set, best results were obtained for simEDs with four tissue classes representing fat, soft tissue, air, and bone. For this simED, gamma pass rates of 99.95% (range: 99.72–100%) were achieved. The decrease in accuracy from ED simplification was smaller in this case than the influence of the uncertainty scenarios on the reference image, both for gamma pass rates and dose volume metrics.
Conclusions: The presented workflow helps to determine the required complexity of synthetic CTs with respect to their dosimetric accuracy. The investigated cases showed potential simplifications, based on which the synthetic CT generation could be faster and more reproducible.
Introduction
Image guidance with magnetic resonance (MR) for radiotherapy is currently one of the most promising options for improvement in treatment outcome. However, the MR images acquired before or during the treatment cannot directly be used for dose planning, since to this end, electron density (ED) is the dominant quantity needed. The latter is conventionally derived from a computed tomography (CT) image via a look-up table. However, for situations where dose calculation on MR images is intended or cannot be avoided, the lack of ED information can be overcome by MR-based, so-called “synthetic CTs” (sCTs) (sometimes also called “pseudo CT” or “substitute CT”).
A number of approaches for the computation of sCTs have been suggested and investigated in the literature over the last years. They can be divided into atlas-based approaches [Citation1–3] and machine learning approaches [Citation4–9]. The latter range from simple bulk density assignment (BDA) [Citation4,Citation5] over classification and regression [Citation6–8,Citation10] to complex neural networks [Citation9,Citation11]. A recent review [Citation12] summarises the different methods and their specified accuracy. For photon treatments, dose differences <2% can be observed for most cases. Commercial products are now also available on hybrid machines using BDA, as well as for pre-treatment MR imaging off-site (hybrid method [Citation13], BDA [Citation14]). For the latter, dosimetric evaluations were recently published by Tyagi et al. [Citation15] and Persson et al. [Citation16], demonstrating the applicability of the presented techniques.
The usage of BDA specifically for pelvic cancer has been widely investigated in the literature, however mostly for water equivalent (WE) bulk densities [Citation4,Citation17] or WE and bone [Citation4,Citation5,Citation18] as surrogate EDs. The commercial approach described in Köhler et al. [Citation14] increased the complexity of the sCT by using five different tissue classes for BDA. The next increase in complexity is the dual model [Citation19,Citation20], which separates bone (polynomial fit) and soft tissue (interpolation between fat, muscle and urine) for sCT generation. Machine learning and image registration are the most complex and computational demanding approaches. However, at some point an increase in complexity of the sCT generation might not result in a relevant increase in dosimetric accuracy any more. This trade-off has not yet been analysed systematically.
In this study, we therefore investigate the necessary level of complexity of sCT generation for clinical purposes. The generation of sCTs includes, independently from the applied approach, two aspects: (1) the complexity of ED information needed for a specific treatment, i.e., number of tissue classes, and (2) the uncertainties in relating MR contrast and CT numbers. While these two aspects are usually treated simultaneously, we present a methodology to decouple the two factors, which facilitates the isolated investigation of the required granularity in ED information. Through the decoupling, our study may serve as a fundamental guideline for the design of MR to sCT conversion algorithms. Through the consideration of clinically meaningful treatment uncertainties, it may inform future discussion about the practically meaningful complexity of sCTs in clinical MR-only workflows. These represent an upper limit for the accuracy of the sCTs.
Material and methods
We created a set of seven simplified CT images (simCTs) each from the original CTs of six pelvic cancer patients with different numbers of tissue classes. The definition of the tissue classes originated from the structure of the relative ED (relative to water, rED) histogram shown exemplarily in for the pelvis: two tissue types (fat and non-fat soft tissue) dominate the histogram in the form of two Gaussian-shaped peaks. This simple and reproducible shape suggested that only few rED classes are sufficient, representing either both peaks or a ratio of them in only two or one class, respectively. In the context of MR-based treatment planning, these classes can correspondingly be identified in conventional T2-weighted MR contrasts, as the 2 D histogram in suggests. T2-weighted sequences or fat/water separating sequences are especially useful to separate tissue similarly to the CT-based fat/soft tissue separation. Air and bone are well differentiable in the rED, but not in the MR signal, resulting in a smeared, low signal in around the main peaks. As also pointed out by others [Citation6,Citation7,Citation12,Citation22], the main challenge of MR-based treatment planning is thus the differentiation of air and bone and their assignment of rED. To assess the importance of air and bone classes in the dose calculation, a simCT with four classes including air and bone was created as well.
Figure 1. Histogram of relative electron density derived from the CT of the pelvis via a clinical HLUT (bottom right) and histogram of MR signal intensity from the corresponding T2-weighted MR image after bias field correction (top left). The top right image shows the 2 D histogram of the relative electron density and the MR signal. The MR image was acquired in the same position as the CT and close in time to the CT acquisition, as described in detail in Bostel et al. [Citation21].
![Figure 1. Histogram of relative electron density derived from the CT of the pelvis via a clinical HLUT (bottom right) and histogram of MR signal intensity from the corresponding T2-weighted MR image after bias field correction (top left). The top right image shows the 2 D histogram of the relative electron density and the MR signal. The MR image was acquired in the same position as the CT and close in time to the CT acquisition, as described in detail in Bostel et al. [Citation21].](/cms/asset/c184ff50-2441-439b-aa2f-984dad58a31b/ionc_a_1684558_f0001_c.jpg)
Patient selection
Six patients who underwent intensity-modulated radiotherapy (IMRT) of pelvic tumours at the German Cancer Research Center (DKFZ), Heidelberg, were selected for this study. Indications and fractionation scheme information can be found in Supplementary Table 1. Patients were part of a MR guidance study [Citation21] and gave informed consent for the retrospective usage of their image data. Planned clinical dose distribution and contours for the target and organs at risk (OARs) were available from experienced radiation oncologists created within the clinical treatment planning system (TPS) RayStation (RaySearch Laboratories AB, Stockholm, Sweden). More details on patient selection, imaging and treatment planning can be found in [Citation21] and [Citation23]. The treatment plan optimisation and dose calculation was performed with the open-source treatment planning system matRad [Citation24] (https://www.matRad.org), which offers higher flexibility than commercial TPS, for example access to beam weights and beam weight initialisation for dose optimisation. The simulation of uncertainties and subsequent data analysis was performed in Matlab (The Mathworks, Inc., Natick, USA). The matRad program is based on Matlab, therefore the transition of dose calculation results to analysis was straight forward. Using a clinical Hounsfield lookup table (HLUT) from DKFZ, all original CTs were converted into rED () images, which are the basis for all simplified rED images (simED).
Bulk density determination
For each patient, the histogram of rED inside the body contour was analysed. The two dominant peaks representing fat and remaining soft tissue, which includes organs, muscle, etc., were fitted with a sum of two Gaussian functions to find the peak positions fat_pat and
soft_pat. Additionally, the crossing point of the two Gaussians was determined as the separation point between fat and remaining soft tissue (
sep_pat). The peak and minimum positions were also averaged over the six patients (
sep_coh
fat_coh, and
soft_coh).
For the creation of simEDs, the body in the original rED image was segmented using histogram-based thresholding into four compartments: air ( < 0.6), fat (0.6 ≤
<
sep_pat), soft tissue (
sep_pat≤
≤ 1.07) and bone (
> 1.07). Based on these, seven different simEDs were created by overwriting the compartments with bulk density values. A summary over all simEDs, their compartments and respective rED values can be found in . The four main steps of complexity represented by the simEDs are water-equivalent (WE), single-tissue (1t), two soft tissues (2t), and two soft tissues plus air and simplified bone (4t). In view of MR-based treatment planning, WE, 1t and 2t could be created just by classification on common MR sequences with good fat/water separation. For simED4t, simple segmentation on the MR image is not directly feasible due to comparably low signal intensity in both air and bone. Either additional MR-sequences (e.g., UTE or ZTE) or other bone/air separation techniques have to be employed, such as manual bone segmentation [Citation4,Citation25,Citation26].
Table 1. Overview of the relative electron density () values assigned to the four compartments of the different simEDs.
Optimisation
The treatment plan for original rED images was optimised in matRad to reproduce the dose distribution from the clinical treatment plan, considering dose constraints from QUANTEC [Citation27] as well (from now on referred to as reference dose distribution).
Independent treatment plan optimisation was performed on all simEDs using the identical dosimetric treatment plan objectives and constraints. The beam weights from the original plan were used as initial beam weights for simED optimisation to accelerate consistent convergence. The gamma pass rates (GPRs, 2 mm/2%-criterion) inside the body contour and the PTV comparing the dose distribution from the original rED and the simEDs were above 99%, which indicates treatment plan consistency. As a second step, the associated optimal fluences from each simED were used to recompute the dose distribution on the original rED image (from now on referred to as the dose from simED) and compared to the reference dose distribution. Finally, the dosimetric differences between the simEDs and the original rED image were evaluated.
Uncertainty scenarios
The simulation of uncertainties is key for meaningful interpretation of the clinical relevance of the observed discrepancies between simEDs and original rED. Two types of uncertainties were simulated for comparison to simEDs: geometrical setup and range uncertainties. Details how the simulation was performed can be found in the Supplementary material. The uncertainties were simulated both for the original rED image and the simED images.
Analysis
To analyse the resulting dose simulations, 3 D gamma tests [Citation28] using 2 mm distance and 2% global dose criteria with a 2% lower threshold, and corresponding GPRs were calculated within the PTV volume. SimEDs and the uncertainty scenarios from both the original rED image and the simEDs were compared to the original rED each. The latter resulted in GPR distributions, which are visualised as boxplots.
Further, dose volume metrics Dx (the dose values that x% of the volume receives) were calculated for the PTV and the OARs from dose from the original rED image, the simEDs and the uncertainty scenarios. For target volumes D2, D50, and D98, for OARs D2 and Dmean were used, following the ICRU Report 83 [Citation29].
Again, the distribution of Dx values from uncertainty scenarios simulating positioning errors are visualised as boxplots, whereas the uncertainty scenarios simulating HLUT shifts are shown as errorbars. The HLUT shift range and the interquartile range (IQR) of position shifts (black box in the boxplots) from the original rED image defined two confidence intervals, which are used as acceptance criteria for the simEDs, i.e., the criterion is passed if the Dx values lie within the IQR of position shifts or the HLUT shift range. In , the two confidence intervals are included as shaded areas. However, some intervals have a “glass top” or “glass bottom” indicated by the black arrows in the figure. This means that also values above or below the interval are accepted, if this conforms or reduces dose to the target or OAR, respectively. Accepting an actual under- or overdosage is prevented by the usage of the combination or two or three Dx values per simED and volume.
Results
Bulk density determination
The detailed results from the histogram fits are given in the Supplementary Table 2. The rED of the fat peak fit position (fat_pat) varies between 0.924 and 0.948, with a mean (
fat_coh) of 0.934 ± 0.008. The soft tissue fit peak (
soft_pat) ranges from 1.019 to 1.034, with a mean (
soft_coh) of 1.027 ± 0.005. The minimum
sep_pat is smaller than water (
= 1) for all six patients, ranging from 0.970 to 0.980 with a mean (
sep_coh) of 0.973 ± 0.004.
Gamma analysis
An example for the gamma images is given in in the Supplementary material for one slice from patient 1 for simED1t_coh. The gamma index failure can be linked to the anatomy, as can be observed in the figure when comparing the simED and the corresponding original rED slice. Failures occur mainly downstream of a large air bubble (white arrows) and where the beam travels significantly through cortical bone (yellow arrows), which mostly occurs when the beam is parallel to the surface of the bone.
(left) shows the comparison between the GPRs of the simED (symbols) and the distribution of GPRs under the influence of positioning uncertainties (boxplots) for the original rED image for the PTV. For clarity, the uncertainty scenarios of the individual simEDs are not included here and shown exemplarily for patient 1 on the right. Uncertainties from the HLUT for the original rED image are also not shown here, as they are above 99.98% in all cases.
Figure 2. Left: Gamma pass rates (GPRs) of the PTV for the simEDs compared to the original rED image are shown as symbols. GPRs from sampled shifts of the original rED image are shown as boxplots. Uncertainty sampling is shown exemplarily for patient 1 on the right: positioning sampling is included as boxplots, HLUT sampling as errors bars.
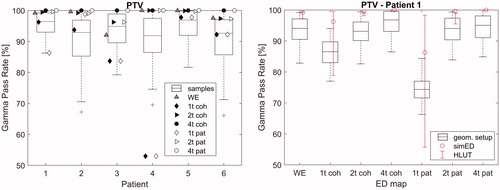
The GPRs of simED4t are almost 100% for all patients. Worst results are obtained by both patient and cohort specific simED1t, however simEDWE has higher GPRs than simEDs1t in all cases. All simED2t show GPRs above 96%. The boxplots of the GPRs obtained by the positioning uncertainty sampling visualise that the GPR drops down to ∼70% in extreme cases for the PTV. The IQR can reach down to ∼85% for individual patients as well, which is worse than the GPRs observed for most simEDs.
On the right, one example is given for GPRs of simEDs compared to the original rED image including the uncertainty sampling for patient 1. For simEDs with lower GPRs, the uncertainty scenarios introduce even larger uncertainties, as for example for simED1t. However, for high GPRs of the simED, such as 2t and 4t, the sampled shifts have similar influence as the sampled shifts of the original image and the HLUT shift only has a very small influence.
Dose volume metrics
summarises the results of the mean relative dose difference of specific Dx for the PTV and three OARs of the six patients. These OARs are available for all selected patient cases independent from indication and are thus used for evaluation. Patient 4 does not receive any dose to the spinal cord, thus the values for the spinal cord are averaged only over the remaining five patients.
Table 2. Mean relative dose differences for a set of dose volume metrics (DVMs) averaged over the patient cohort.
Largest deviations from the reference dose distribution for the PTV can be observed for simED1t, the smallest for simED4t_pat. The deviations for simED2t, simED4t and simEDWE are, however, smaller than 1%. Among the OARs, mostly negative dose differences can be observed. The largest positive deviation can be observed for simED4t_pat for the spinal cord.
An example for the Dx values including the simulated uncertainties is shown in for patient 2. Here, the trends of the Dx deviations from the reference dose distribution that have been presented in table 2 can be recognised. The width of the envelopes for D2 and D50 for the PTV are dominated by the HLUT sampling, whereas for D98, the position sampling creates a wider span of Dx values. All D2 and D98 for the PTV lie within the envelopes and the “glass bottom/top”, whereas for D50, the values of the DVM for simED1t lie below their respective envelopes. Similarly, an example for an OAR is given below for the bladder of the same patient. Here, no exceeding of the dose envelopes and the glass bottoms can be observed.
Figure 3. D2, D50 and D98 of the PTV (top) and D2 and Dmean of the bladder (bottom) of patient 2 for all simEDs. The uncertainty sampling is included as boxplots for the positioning sampling, and as error bars for the HLUT sampling. The shaded regions and the black arrows represent the acceptance envelopes based on the uncertainty sampling of the original ED image (more details in the Supplementary material).
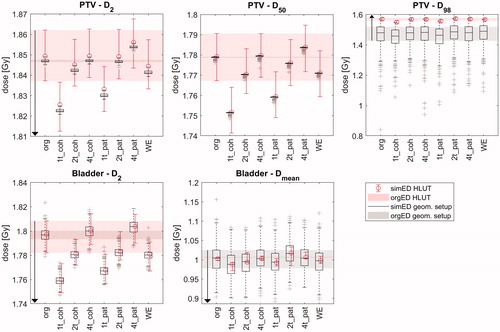
Generally, the PTV criterion was the most critical one, resulting in most criterion failures. The two simED4t always passed the PTV criterion, simEDWE and simED2t performed almost as good with one or two failures each. Only simED1t showed negative results for the PTV for all tested cases. Regarding the OARs, simED4t_pat showed best results with no failures at all, followed by simED4t_coh with one failure for the bowel for patient 1. While no criterion failures were observed for the bladder for all simEDs, two failures were observed for the spinal cord (one for simED2t_coh and one for simEDWE) and one to three failures for the bowel for all simED except simED4t.
Discussion
We illustrated the described workflow using a dataset of six pelvic patients. The pelvis is a challenging part of the body, as it includes potentially large variations. The tissue composition in the beam’s path can vary strongly depending on the patient’s weight, bladder filling or bowel gas. Such anatomical differences were observed between the six patients, the bladder volume for example varied between 84 cm3 and 397 cm3. Nevertheless, the results for each simED are consistent among the patients. This suggests generalizability of the results and the gain in informative value from much larger patient cohorts can be expected small.
The ED classification in this study was based on the frequency distribution of rEDs for the pelvic region. We assumed that only the prominent peaks for fat and non-fat soft tissue are of major importance for the planning process. Simplified air and bone models were also included as simED4t, to incorporate the strong radiological impact of those tissues despite their small volume ratio. Consequently, this very aspect of our methodology does not represent a general solution for the whole body, as it can be expected that some tissues, for example lung, are not included in the two peaks. However, the general approach facilitated in our study here, i.e., finding an optimal number of tissue classes by comparison to other sources of uncertainty, could also be transferred to other sites.
Bulk density determination
Cohort mean values for BDA are advantageous when it comes to sCT creation from MR images where no patient specific ED values are available any more. Their applicability, especially for fat and soft tissue, was motivated by the small inter-patient variation in the peak positions from the histogram analysis (maximum 0.9% relative deviation). The values for fat were slightly smaller than the respective values derived from the ICRU report 46 [Citation30], as a consequence of the applied HLUT. This is, however, not critical to study, since the same HLUT was used consistently for all data and optimisations. The investigation with patient specific bulk rED values served as an intermediate reference, being closer related to the reference rED image via the histogram than the cohort mean rED values. It should be mentioned that
sep (also used as a BD for simED1t) was introduced as the best approximation to separate fat and remaining soft tissue, but only partly reflects the volume ratio between fat and soft tissue, as for example a mean value would do. SimEDWE was found to perform better than simED1t in GPR analysis and Dx analysis. We believe that one reason for this is the overestimation of the fat volume ratio in the beam’s path compared to the whole body, which is reflected by
sep being smaller than 1. In the beam’s path, the fraction of traversed fat is less than traversed non-fat soft tissue, therefore the value for the bulk rED is underestimated.
Analysis
The qualitative analysis of the gamma images revealed the sources and regions of GPR failure for the different simEDs compared to the original rED image. Apart from the simED4t, all gamma images show failure in vicinity of air bubbles (e.g., in the lower gastrointestinal tract) and after considerable path lengths in cortical bone. The latter can be assumed to be reliable for each simED compared to the original rED image, whereas failures from air are comparable to the influence of inter- and intra-intestinal movement. These types of failure occur during standard fractionated treatment and are accounted for in the PTV margin. Path length variations on the other hand are not explicitly accounted for in the PTV margin, and, although a deadening effect occurs for slight variations, strong variations are not covered due to their unpredictability and locality. To better separate accounted influences from true failure from simEDs, the analysis of GPRs of the CTV or GTV would be advantageous, however those contours were not available for all patients. Both two and four tissue simEDs show acceptable GPRs above 96% in all patients. Fewer tissue classes lead to smaller GPRs for some patients, which was considered unacceptable. For the PTV GPR analysis and comparison to sampled shifts, it can be observed that the simEDs have less impact on the GPR than most of the simulated uncertainty scenarios.
The mean relative dose differences in showed that the impact of two or more tissue classes can be considered negligible, as the respective deviations for the PTV are smaller than 1%. For simED4t, all deviations are even below 0.3%. Thus, simED4t_coh can be recommended, as also the Dx values for the OARs are below 0.5% deviation. For simED4t_pat, deviations up to 1.7% occur, however these are all covered by the acceptance criterion defined by the uncertainty sampling.
Most Dx criterion failures were observed for the bowel. However, that usage of the Dx criterion for the bowel is debatable. Clinically, a Vx criterion (i.e., the volume receiving x Gy) is used rather than a Dx criterion. This, however, was not applicable here due to incomplete imaging of the organ in the original data set. Criterion failures for the PTV occurred mostly for simple rED images with one tissue class, which is in agreement with previous results from the GPRs and the mean relative dose differences. Also, simED4t showed slightly better results than simED2t for the Dx analysis, similar for GPR analysis. A noticeable characteristic of the simEDs regarding the sampled shifts can be observed: the comparable sizes of simEDs and reference boxplots in all investigated cases indicate that positioning uncertainties can also be detected with consistent use of simEDs, i.e., comparing the simED in original position to shifted position, which is desirably detected with sCTs. The difference with respect to the original rED image will add to the sampled values by shifting the boxplot up- or downwards in their entirety. SimEDs consisting of two tissue classes yield acceptable deviations from plans optimised on a reference CT for the specific case of pelvic tumours according to the applied criteria. Both GPR and Dx analysis results were comparable between patient specific and cohort simEDs, supporting the hypothesis that general values for a population are sufficient for treatment planning of pelvic tumours with simED images. This can reduce the effort per patient to only thresholding to detect the corresponding compartments and facilitates the creation of simEDs from MR images later on, when no patient specific EDs from reference CT scans are available.
These results suggest that even with a few tissue classes patients would benefit from MR guidance, which increases the geometrical confidence during irradiation, and dose re-calculation and re-optimisation (if necessary) with simple rED images. A further decrease of dosimetric accuracy due to interplay effects of simple rED images and patient shifts, as shown in (right), is not to be expected when generating the simED from MR images. The motivation to use MR guidance is precisely its ability to detect and thus reduce uncertainties such as position shifts or anatomical changes (not included in this study). It should be noted here that the generation of a sCT from a MR image will also suffer from MR artefacts, such as distortion or signal non-uniformity. These artefacts will further influence the quality of the sCT, but they are not part of this study, since their correction can be completely separated from the conversion of MR intensity to rED, for example by technical improvements [Citation31] or pre-processing of the MR [Citation32].
The simED generation in this study also showed that mis-classification of single voxels is a minor problem for the resulting dose. The two Gaussian fit curves in the histogram always overlap, suggesting that voxels from both tissue classes are falsely segmented by the threshold. Also, the strong simplification of complex bone structures yielded sufficient accuracy for treatment planning according to our criteria. This plays into the hands of MR-based treatment planning, where a perfect segmentation of the compartments, especially bone, is even harder to achieve than for CT images, for example due to susceptibility artefacts.
Conclusion
We present an approach to systematically study the accuracy achieved by algorithms for synthetic CT generation. The simulation of uncertainties (HLUT and positioning) serves hereby as a reference comparison for a clinically meaningful interpretation of results. For the six patient cases presented here, simplified versions of CT or rED images yielded comparable dosimetric results to the original image and introduced smaller deviation from the reference dose than positioning and HLUT uncertainties. This indicates that simplified CT images with a minimum of four bulk densities (air, fat muscle, bone) are sufficient for MR-based treatment planning for intensity modulated radiotherapy of pelvic tumours.
Our approach to determine the number of tissue classes can seamlessly be adapted to other data sets to enhance the explanatory power, or to other sites of the body. It provides structured information about the requirements regarding MR sequences for MR-based treatment planning, and thereby enables the identification of a suited trade-off between model complexity for simCT generation and accuracy for MR-based planning in routine treatments.
Supplemental Material
Download MS Word (321.8 KB)Disclosure statement
No potential conflict of interest was reported by the authors.
References
- Dowling JA, Lambert J, Parker J, et al. An atlas-based electron density mapping method for magnetic resonance imaging (MRI)-alone treatment planning and adaptive mri-based prostate radiation therapy. Int J Radiat Oncol Biol Phys. 2012;83(1):e5–e11.
- Ren S, Hara W, Wang L, et al. Robust estimation of electron density from anatomical MR imaging of the brain using a unifying multi-atlas approach. Int J Radiat Oncol Biol Phys. 2016;97(4):849–857.
- Kraus KM, Jäkel O, Niebuhr NI, et al. Generation of synthetic CT data using patient specific daily MR image data and image registration. Phys Med Biol. 2017;62(4):1358–1377.
- Lee YK, Bollet M, Charles-Edwards G, et al. Radiotherapy treatment planning of prostate cancer using magnetic resonance imaging alone. Radiother Oncol. 2003;66(2):203–216.
- Lambert J, Greer PB, Menk F, et al. MRI-guided prostate radiation therapy planning: investigation of dosimetric accuracy of MRI-based dose planning. Radiother Oncol. 2011;98(3):330–334.
- Rank CM, Tremmel C, Hünemohr N, et al. MRI-based treatment plan simulation and adaptation for ion radiotherapy using a classification-based approach. Radiat Oncol. 2013;8(1):51.
- Edmund JM, Kjer HM, Leemput KV, et al. A voxel-based investigation for MRI-only radiotherapy of the brain using ultra short echo times. Phys Med Biol. 2014;59(23):7501–7519.
- Liu L, Jolly S, Cao Y, et al. Female pelvic synthetic CT generation based on joint intensity and shape analysis. Phys Med Biol. 2017;62(8):2935–2949.
- Han X. MR-based synthetic CT generation using a deep convolutional neural network method. Med Phys. 2017;44(4):1408.
- Johansson A, Garpebring A, Karlsson M, et al. Improved quality of computed tomography substitute derived from magnetic resonance (MR) data by incorporation of spatial information – potential application for MR-only radiotherapy and attenuation correction in positron emission tomography. Acta Oncol. 2013;52(7):1369–1373.
- Emami H, Dong M, Nejad-Davarani SP, et al. Generating synthetic CTs from magnetic resonance images using generative adversarial networks. Med Phys. 2018;45(8):3627.
- Johnstone E, Wyatt JJ, Henry AM, et al. A systematic review of synthetic CT generation methodologies for use in MRI-only radiotherapy. Int J Radiat Oncol Biol Phys. 2018;100(1):199–217.
- Siversson C, Nordström F, Nilsson T, et al. Technical note: MRI only prostate radiotherapy planning using the statistical decomposition algorithm. Med Phys. 2015;42(10):6090–6097.
- Köhler M, Vaara T, Grootel MV, et al. MR-only simulation for radiotherapy planning. Netherlands: Philips Healthcare.
- Tyagi N, Fontenla S, Zhang J, et al. Dosimetric and workflow evaluation of first commercial synthetic CT software for clinical use in pelvis. Phys Med Biol. 2017;62(8):2961–2975.
- Persson E, Gustafsson C, Nordström F, et al. MR-OPERA: a multicenter/multivendor validation of magnetic resonance imaginge-only prostate treatment planning using synthetic computed tomography images. Int J Radiat Oncol Biol Phys. 2017;99(3):692–700.
- Chen L, Price RA, Wang L, et al. MRI-based treatment planning for radiotherapy: dosimetric verification for prostate IMRT. Int J Radiat Oncol Biol Phys. 2004;60(2):636–647.
- Doemer A, Chetty IJ, Glide-Hurst C, et al. Evaluating organ delineation, dose calculation and daily localization in an open-MRI simulation workflow for prostate cancer patients. Radiat Oncol. 2015;10(1):37.
- Korhonen J, Kapanen M, Keyriläinen J, et al. A dual model HU conversion from MRI intensity values within and outside of bone segment for MRI-based radiotherapy treatment planning of prostate cancer. Med Phys. 2013;41(1):011704.
- Tenhunen M, Korhonen J, Kapanen M, et al. MRI-only based radiation therapy of prostate cancer: workflow and early clinical experience. Acta Oncol. 2018;57(7):902–907.
- Bostel T, Nicolay NH, Grossmann JG, et al. MR-guidance – a clinical study to evaluate a shuttle-based MR-linac connection to provide MR-guided radiotherapy. Radiat Oncol. 2014;9(1):12.
- Wiesinger F, Bylund M, Yang J, et al. Zero TE-based pseudo-CT image conversion in the head and its application in PET/MR attenuation correction and MR-guided radiation therapy planning. Magn Reson Med. 2018;80(4):1440.
- Bostel T, Pfaffenberger A, Delorme S, et al. Prospective feasibility analysis of a novel off-line approach for MR-guided radiotherapy. Strahlenther Onkol. 2018;194(5):425–434.
- Wieser H-P, Cisternas E, Wahl N, et al. Development of the open-source dose calculation and optimization toolkit matRad. Med Phys. 2017;44(6):2556–2568.
- Jonsson JH, Karlsson MG, Karlsson M, et al. Treatment planning using MRI data: an analysis of the dose calculation accuracy for different treatment regions. Radiat Oncol. 2010;5(1):62.
- Kim J, Glide-Hurst C, Doemer A, et al. Implementation of a novel algorithm for generating synthetic CT images from magnetic resonance imaging data sets for prostate cancer radiation therapy. Int J Radiat Oncol Biol Phys. 2015;91(1):39–47.
- Marks LB, Yorke ED, Jackson A, et al. Use of normal tissue complication probability models in the clinic. Int J Radiat Oncol Biol Phys. 2010;76(3):S10–S19.
- Low DA, Harms WB, Mutic S, et al. A technique for the quantitative evaluation of dose distributions. Med Phys. 1998;25(5):656–661.
- ICRU. Prescribing, recording, and reporting photon-beam IMRT, Report 83. J Int Comm Radiat Units Measur. 2010;10(1).
- White DR, Griffith RV, Wilson IJ. Report 46. J Int Comm Radiat Units Measur. 1992;os24(1).
- Fransson A, Andreo P, Pötter R. Aspects of MR image distortions in radiotherapy treatment planning. Strahlenther Onkol. 2001;177(2):59–73.
- Belaroussi B, Milles J, Carme S, et al. Intensity non-uniformity correction in MRI: existing methods and their validation. Med Image Anal. 2006;10(2):234–246.