
 ?Mathematical formulae have been encoded as MathML and are displayed in this HTML version using MathJax in order to improve their display. Uncheck the box to turn MathJax off. This feature requires Javascript. Click on a formula to zoom.
Abstract
Background: Cachexia and sarcopenia are associated with poor survival after colorectal cancer (CRC) diagnosis. Computed tomography (CT) can be used to measure aspects of cachexia including sarcopenia, myosteatosis and the amount of subcutaneous and visceral adipose tissue. The aim of this study was to relate CT-based body composition variables with survival outcomes in CRC.
Material and methods: In this population-based, retrospective cohort study, CT scans of 974 patients with pathological stages I–IV CRCs, collected at or very near diagnosis (years 2000–2016), were used to measure cross-sectional fat and muscle tissue areas. Body composition variables based on these measurements were assessed in relation to tumor stage and site and cancer-specific survival in stages I–III CRC (n = 728) using Cox proportional hazards models and Kaplan–Meier estimators.
Results: Sarcopenia was associated with decreased cancer-specific survival, especially in patients with stages I–II tumors. The hazard ratio (HR) for the lowest versus highest tertile of skeletal muscle index (SMI) was 1.67; 95% confidence interval (CI), 1.08–2.58 for all stages, and HR 2.22; 95% CI 1.06–4.68, for stages I–II. Myosteatosis was also associated with decreased cancer-specific survival [(HR 2.03; 95% CI 1.20–3.34 for the lowest versus the highest tertile of skeletal muscle radiodensity (SMR)]. SMI and SMR were lower in patients with right-sided CRC, independent of age and sex. No adipose tissue measurement was significantly associated with cancer-specific survival.
Conclusion: In concordance with previous studies, sarcopenia and myosteatosis were associated with decreased cancer-specific survival. The strong association between sarcopenia and poor cancer-specific survival in early-stage disease could have clinical implications for personalizing therapy decisions, including nutritional support.
Introduction
Overweight and obesity increase the risk of cancer, including some of the most common types, such as breast cancer and colorectal cancer (CRC) [Citation1]. Excess body fat is associated with metabolic and inflammatory changes, which are related to the development of cancer [Citation2,Citation3]. In contrast, a higher body mass index (BMI > 25 kg/m2) is associated with reduced mortality after CRC diagnosis. This apparent discrepancy in the role of body fatness in cancer development and prognosis has been dubbed the ‘obesity paradox’ [Citation4]. Body mass index, however, is not a precise measurement and does not take body composition into account. A normal BMI may mask potentially dangerous adiposity and low muscle mass, and overweight or obese people may have a high amount of muscle tissue.
Body composition is important after cancer diagnosis, not only for prognosis but also for aspects related to prognosis and patient well-being such as response to treatment and toxicity, surgical complications, physical activity and fatigue [Citation4–7]. Cachexia, which is defined as the degradation of fat and muscle tissue due to a disease, is associated with lower survival [Citation8–10]. Moreover, sarcopenia, or depletion of skeletal muscle mass, is also associated with decreased survival after colorectal, head and neck, ovarian and breast cancer diagnosis, regardless of BMI [Citation8,Citation11–15]. The degree of sarcopenia is commonly quantified using the skeletal muscle index (SMI), which is the muscle area in an anatomically predefined single computed tomography (CT) section, normalized for height.
Myosteatosis, or the infiltration of fat within the muscle, can be quantitatively assessed by the radiodensity of skeletal muscle (SMR) measured in Hounsfield units (HU) on CT. Low SMR has been associated with higher mortality in several cancers [Citation12,Citation15–19], including CRC, independent of muscle mass or adiposity [Citation8,Citation12,Citation20]. Furthermore, visceral obesity (VO), defined as elevated visceral adipose tissue (VAT), has also been related to survival outcomes in CRC, although the relationship is less clear [Citation8,Citation12,Citation21–25].
CT-based measures of body composition, including sarcopenia, myosteatosis and VO, have been studied previously in CRC. However, the knowledge base is still limited for aspects such as clinically relevant subgroups of patients (e.g. based on disease site and stage). Furthermore, previous studies examining associations between CT-based measures of body composition and tumor site or survival estimates have only studied the colon as a whole, not left- and right colon separately [Citation9,Citation12,Citation21,Citation26–32]. Tumor genetic and anthropomorphic features, as well as survival estimates, varies depending on right- or left-sided tumor localization. Compared to left-sided colon cancer, right-sided colon cancer is associated with female sex, older age and a higher proportion of mutations in the KRAS and BRAF oncogenes, and left-sided colon cancer generally has worse prognosis [Citation33,Citation34]. Furthermore, in some cohorts, e.g. metastatic CRC or studies not using cohort-specific optimal stratification to determine cutoffs for CT variables [Citation21,Citation26,Citation29,Citation35], no association has been seen between CT measured body composition measurements and survival. Moreover, in some European populations significance has been lost after adjusting for confounders [Citation26,Citation29], thus it is important to investigate additional populations. In the present large, population-based study, we assessed several CT-based measures of body composition in relation to survival in CRC patients. We also investigated survival estimates in subgroups of CRC according to tumor- or anthropometric characteristics and the association between body composition and tumor site and stage. We hypothesized that our results would be congruent with previous studies, i.e. both SMI and SMR, but not other body composition measures, would be associated with survival outcomes.
Material and methods
Study population
This population-based retrospective cohort study is nested within the Northern Sweden Health and Disease Study (NSHDS) consisting of participants in three cohorts: The Västerbotten Intervention Program (VIP), the Mammography Screening Program (MSP) and the northern Swedish MONitoring of Trends and Determinants in CArdiovascular Disease (MONICA) project. All three cohorts have been described in detail elsewhere [Citation36,Citation37]. In short, the VIP, initiated in 1986 and ongoing, is a health screening intervention in which all residents of Västerbotten County are invited to a general health exam at 10-year intervals starting mainly at the age of 40 years. In the MSP, established in 1995 and concluded in 2006, women in Västerbotten County aged 50–70 years were invited to complete a lifestyle questionnaire, as well as provide blood samples, while attending mammography screening. MONICA consists of randomly selected 25–74-year-olds living in northern Sweden (Västerbotten and Norrbotten County) invited to participate in six cross-sectional health surveys between 1986–2014 (average participation rate of 74%). At the final date of entry to this study (January 19, 2016), the NSHDS included 119,738 participants. Patients diagnosed with colorectal adenocarcinoma between 17 October 1986 and 19 January 2016 were identified by linkage with the Cancer Registry of Northern Sweden, using ICD-10 C18.0 and C18.2–18.9 for colon, and C19.9 and C20.9 for rectum. There were a total of 1542 patients with CRC in the registries. All cases and tumor data were verified by a pathologist (RP) specialized in gastrointestinal pathology and 68 non-adenoma CRC cases were excluded (mainly colon carcinoid cancers). The date of surgery was also extracted from the registry and verified from patient charts. Exclusion criteria were previous cancer diagnosis except for non-melanoma skin cancer or no available data from NSHDS health surveys, resulting in missing data on body height. After initial exclusions, the study cohort consisted of 1358 CRC patients. The study protocol was approved by the Regional Ethical Review Board in Umeå, Sweden (dnr: 2016-221-31 and dnr: 2019-00157). All participants in the NSHDS cohorts gave written informed consent for data collection for research purposes.
The inclusion criteria for this study were: CT scans within 4 months before and 3 months after diagnosis and over half were from within 1 week of diagnosis. We performed sensitivity analyses excluding post-surgical CT scans, or limiting the analyses to CT scans performed within 4 weeks of diagnosis. Exclusion criteria were: CT scans not including the third lumbar vertebrae (L3, n = 16), CT performed after neoadjuvant therapy or having no CT scan at all (n = 90), only thoracic CT scan and abdominal MRI available (n = 13), unable to locate patient medical records (n = 22) or CT scans with insufficient image quality, artifacts or failed downloads (n = 17). Storage of CT images in digital form began gradually in 2000, and 226 patients diagnosed in 2000–2002 had no digital CT images available. A sensitivity analysis was performed by censoring patients diagnosed before 2003. The total number of patients included after all exclusion was 974 (). Of these, 65 CT scans were performed after surgery (7%), but before any neoadjuvant chemo- or radiotherapy.
Figure 1. Flow chart of the study design with inclusion and exclusion criteria. CRC: colorectal cancer, CT: computed tomography, L3: third lumbar vertebrae, MRI: magnetic resonance imagining.
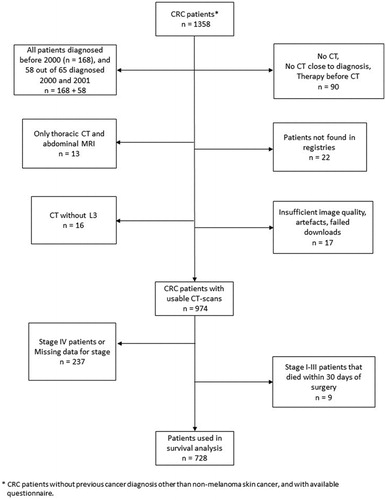
For survival analysis, we excluded patients with stage IV CRC (n = 210), patients who died within 30 days of surgery (n = 9 with stages I–III) and patients with missing stage data (n = 27). Eighty-seven patients, all with missing stage or stage IV CRC, did not undergo primary surgery. Of the 974 patients included in the study, 728 were thus included in the survival analysis (). All patients were included in the analyses of body composition variables in relation to tumor stage and site.
CT measurements
The most caudal single CT slice at the L3 level including both transverse processes was used to measure the cross-sectional area of fat and muscle in cm2 (median section thickness 3 mm, interquartile range 3–5 mm). The use of L3 as a landmark for body composition analysis has previously been validated against bioimpedance analysis and dual X-ray absorptiometry in both healthy populations and patients with advanced cancer [Citation38–40]. Two physician scientists and trained image analysts (BG, FA) under the supervision of a senior consultant radiologist (KR) identified muscle area and subcutaneous (SAT), visceral (VAT) and intramuscular (IMAT) fat area (Supplemental Figure 1) using tissue-specific Hounsfield Unit (HU) ranges using imlook4d software (Umeå, Sweden) with manual corrections [Citation41]. HU ranges were 150 to −30 for muscle tissue and −30 to −180 for fat tissue as used previously in a pancreatic cancer cohort [Citation42]. To ensure consistency, 20 cases were assessed by both analysts (coefficient of variation of <1% for VAT, SAT and muscle areas), and another 10 cases were reevaluated with the same method and the outcomes were compared (test–retest coefficient of variation of <1% for VAT, SAT and muscle areas). The image analysts had no access to outcome data while performing analyses.
Total adipose tissue (TAT) was calculated as SAT + VAT + IMAT. Skeletal muscle radiodensity (SMR) was assessed as mean HU across the delineated muscle area. Exclusions for SMR included 124 patients (n = 89 included in the survival analysis) with significantly altered muscle radiodensity due to non-intravenously enhanced CT scans or CT colonoscopy (CTC) [Citation43]. Skeletal muscle index was calculated as the muscle area in cm2 adjusted for height squared (m2), and two cases were excluded due to missing data for height. Eleven patients had a substantial amount of body tissue outside of the field-of-view of the CT scanner and therefore SAT and TAT could not be quantified in these patients. Four of these patients also had a substantial amount of abdominal wall muscle outside of the field-of-view and were excluded from SMI. Substantial amount of body tissue was defined as any part of lateral abdominal muscle wall outside of the field-of-view for SAT and TAT, and any part of lateral VAT outside of the field-of-view for SMI.
Follow-up and survival data
Patients were followed from baseline, defined as the time of diagnosis, until the time of death, censoring or the end of the study (January 8, 2019). The median follow-up time for the included patients in the survival analysis and alive at the end of follow-up (n = 495 out of 728 patients) was 6.2 years (interquartile range: 4.7 − 10.9 years). We performed a sensitivity analysis excluding all patients alive at the final date of entry with less than 4 years of follow-up (n = 84). Cancer-specific mortality was defined as death with known disseminated or recurrent disease, and cases were censored at the end of follow-up or at time of death by other causes, judged by a senior consultant colorectal surgeon using data from the Cancer Registry of Northern Sweden and medical records.
Statistical analysis
Our primary outcome is cancer-specific survival and overall survival of the secondary outcome. In the primary analysis, CT variables were analyzed in sex-specific tertile groups to preserve statistical power for subgroup analysis. Survival estimates per tertiles of CT variables were estimated using Kaplan–Meier estimator. Differences in estimated survival curves were tested using log-rank tests. Missing values in CT variables were assumed to be missing completely at random, and therefore complete-case analysis was conducted with missing observations omitted.
Multivariable hazard ratios (HRs) and 95% confidence intervals (CI) for the risk of cancer-specific and overall death by sex-specific tertiles of CT variables were estimated using Cox proportional hazards models adjusted for traditional prognostic factors (age at diagnosis (linear), sex, tumor stage and tumor site). The proportional hazards assumption was checked by visually examining time-dependent log (HRs) versus time and in Schoenfeld residual-based tests. No violations were observed for HRs within subgroups. Consistency of association across subgroups was evaluated by including interaction terms between CT variables and subgroup variables (TAT tertiles, sex, tumor stage, tumor site and age at diagnosis). To evaluate dose–response, we also modeled the CT variables as continuous variables using restricted cubic splines (with knots at the 5th, 50th and 95th percentiles). Nonlinearity in the spline models was tested with a likelihood ratio test comparing the spline model to a linear model.
Given previous evidence of a threshold effect [Citation9,Citation20], as an exploratory analysis, we created dichotomous low/high variables using optimal stratification [Citation44]. Sex-specific cutoffs for these variables were defined as the cutoffs which resulted in the largest difference in cancer-specific survival between the low/high groups (defined as having the lowest p-value in log-rank tests). All calculations were conducted in R v.3.5.0 (R Foundation for Statistical Computing, Vienna, Austria). All tests were two-sided when applicable.
Results
Baseline characteristics
Body composition variables were analyzed in 974 patients and describes the baseline characteristics of these patients. The median values for the body composition variables were, for SMI: 39.4 cm2/m2, for SMR: 41.0 HU, for VAT: 125.1 cm2, and for SAT: 162.4 cm2. There were 462 male patients (47.4%) and 512 female patients (52.6%).
Table 1. Baseline characteristics of all 974 patients.
SMI (but no other variable) was weakly associated with stage (p < .05), independently of age or sex. Associations were also tested with respect to tumor site and both SMI and SMR were associated with right-sided colon cancers (p < .0001 and p < .0001, respectively), independently of age or sex.
Association of sarcopenia and myosteatosis with survival outcomes
Both sarcopenia, defined as the lowest tertile of SMI, and myosteatosis, defined as the lowest tertile of SMR, were associated with decreased cancer-specific survival (log-rank p-value = .056 and .0041, respectively, ) and overall survival (log-rank p-value = .00062 and .0023, respectively, ), with the exception of the border-line significant result for cancer-specific survival for SMI. However, after adjusting for established prognostic factors, SMI was associated with both cancer-specific survival (lowest versus highest tertile HR: 1.67 [95% CI: 1.08–2.58], ) and overall survival (lowest versus highest tertile HR: 1.54 [95% CI: 1.10–2.15], ). SMR was associated with cancer-specific survival (lowest versus highest tertile HR: 2.03 [95% CI: 1.20–3.44], ) and not significantly with overall survival (lowest versus highest tertile HR: 1.36 [95% CI: 0.92–1.99], ). Using optimal stratification, both sarcopenia and myosteatosis were associated with decreased cancer-specific and overall survival (). No adipose tissue measurements were associated with any survival outcome. Sensitive analyses limited to the time period after full implementation of digital radiology (from 2003), excluding CT colonoscopy, excluding post-surgery CT scans, limiting the time from diagnosis to CT scan to within 4 weeks, or alive patients with less than 4 years of follow-up from diagnosis to the final date of entry did not materially change the results. Restricted cubic spline analyses revealed no evident non-linear relationship for any of the body composition measurements or survival outcomes (Supplementary Figure 2).
Figure 2. Kaplan–Meier curves for cancer-specific and overall survival by skeletal muscle index (SMI) and skeletal muscle radiodensity (SMR) tertiles. Differences in estimated survival curves were tested using log-rank tests.
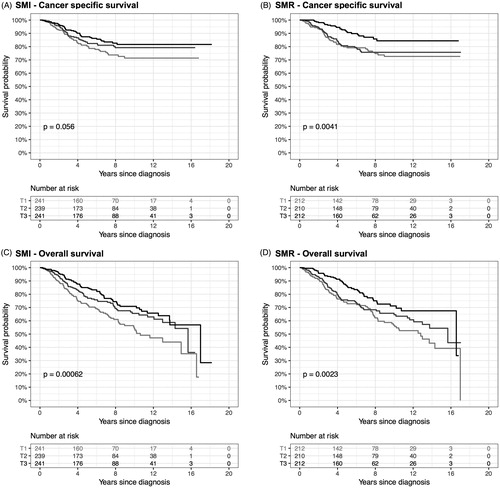
Table 2. Hazard ratios by SMI, SMR, VAT and SAT tertiles, as well as optimal stratification groups (sarcopenia or myosteatosis yes/no).
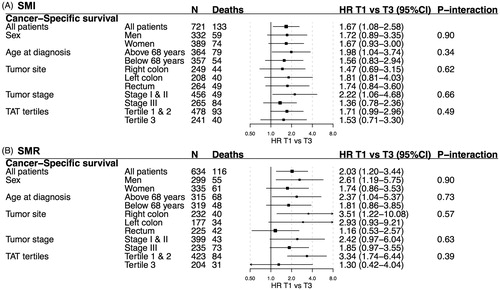
Survival estimates for SMI and SMR were similar for cancer-specific () and total survival (Supplemental Figure 3) across subgroups based on sex, age, tumor site, tumor stage and amount of TAT. For cancer-specific survival, the strongest associations were observed for SMI in tumor stages I–II (HR 2.22, 95% CI: 1.06–4.68), and for SMR; in right-sided colon cancer (HR 3.51, 95% CI: 1.22–10.08) and TAT tertile 1–2 (HR 3.34, 95% CI: 1.74–6.44), but tests for heterogeneity of survival estimates were not statistically significant.
Figure 3. Hazard ratios (HR, 95% CI) for cancer-specific survival by skeletal muscle index (SMI) and skeletal muscle radiodensity (SMR) tertiles in selected subgroups. All estimates are adjusted for sex, age at diagnosis, tumor stage and tumor site (when applicable). T1: tertile 1; T3: tertile 3; TAT: total adipose tissue; TAT: total adipose tissue.
Discussion
The results of this study were congruent with our hypothesis and with previous research—sarcopenia and myosteatosis, but not measures of visceral, subcutaneous or TAT, were associated with decreased prognosis in non-metastatic CRC () [Citation8,Citation12]. For SMI, the association with cancer-specific survival was particularly strong in patients with stages I–II tumors (). Both SMI and SMR were increased along the colorectal continuum, from the right-sided colon to the rectum, and SMI was weakly, but significantly, inversely associated with higher stage ().
Many previous studies that report significant associations for SMI and SMR in relation to CRC prognosis have used cohort-specific optimal stratification to define cutoffs for sarcopenia and myosteatosis. Cohorts and techniques used to study body composition differ in many respects (e.g. types of cancer, software used, stage, and patient ethnicity) [Citation9,Citation12,Citation20], and using optimal stratification may alleviate some of these differences [Citation8]. However, the risk of attaining spurious correlations could increase when using optimal stratification, and generalization of results can be limited. [Citation45] We, therefore, used both sex-specific tertiles and optimal stratification to define cutoffs for sarcopenia and myosteatosis, and the results were similar but predictably stronger for optimal stratification. Our results regarding both SMI and SMR were comparable to the large C-SCANS cohort, in which the lowest tertile of muscle area and sarcopenia defined by optimal stratification and the lowest quartile of SMR were significantly associated with poor cancer-specific survival [Citation9,Citation20].
In this study, low SMI was associated with decreased cancer-specific survival in patients with stages I–II tumors (). To the best of our knowledge, this is the first such analysis for CRC, and it is consistent with the results of a recent meta-analysis of sarcopenia in solid tumors [Citation19]. Cachexia can also be measured by changes in BMI, and a previous study on weight-loss after CRC diagnosis did not observe an increased cancer-specific mortality in stages I or II CRC for a modest weight loss (5–9.9% of BMI), while a weight loss of >10% was associated with increased mortality in stages I or II CRC [Citation46]. Thus, radiological methods could potentially identify many patients with early-stage disease at risk of increased cancer-specific mortality that repeated BMI measurements after diagnosis cannot.
Identifying prognostic factors in early-stage disease is a pertinent clinical question. Whereas the survival benefit of adjuvant chemotherapy in stage III CRC is well established, survival rates in stage II CRC vary widely, and even high-risk stage II patients are less likely to receive chemotherapy [Citation7,Citation47]. On the other hand, patients with sarcopenia may be less likely to benefit from adjuvant chemotherapy due to continued muscle-wasting and increased treatment-related toxicity [Citation5]. Thus, in parallel with efforts to translate tumor prognostic biomarkers to the clinical selection of stage II patients for chemotherapy, sarcopenia might be used to identify patients in need of early nutritional support, and to select patients for potential anti-sarcopenic drugs. Currently, several strategies to alleviate cancer cachexia are being investigated, with ghrelin receptor agonists showing promising results [Citation48]. However, no single treatment may be able to prevent or reverse cancer cachexia, as the mechanisms behind it appears to be complex and multifactorial. Instead a combination of nutritional support, pharmacological interventions and physical exercise, which has been observed to be associated with positive effects on muscle function, may be needed for treating cancer cachexia [Citation49–51].
SMI and SMR were both found to be strongly associated with right-sided tumors as compared to left-sided and rectal cancers (), independently of patient age and sex. The proportion of tumors with mutations in the KRAS or BRAF oncogenes, both important for prognosis and treatment in CRC, is higher in right-sided colon cancer [Citation34]. KRAS mutation is found in almost all cases of pancreatic ductal adenocarcinoma, a highly aggressive and lethal form of adenocarcinoma that is strongly associated with cachexia [Citation52,Citation53]. In lung cancer patients, KRAS mutation is associated with cachexia, and cachexia and tumor growth are dependent on pro-cachectic IL-6 signaling in a KRAS-mutated lung cancer mouse model [Citation54,Citation55]. Therefore, relating tumor characteristics in biopsies or surgical specimens to CT-based measures of body composition could help elucidate mechanisms behind cancer cachexia and sarcopenia, with the potential for drug development [Citation56,Citation57].
Myosteatosis was observed to be strongly associated with poorer prognosis in patients with right-sided tumors, and for those in the lowest and middle tertile of TAT. Taken together this indicates that the archetypal patient with myosteatosis in our cohort would have a right-sided tumor, and be of a higher risk of CRC mortality, especially if not overweight. However, Hopkins et al. [Citation12] recently investigated the associations between SMR and cancer-specific survival in the rectum and colon, respectively, and found that myosteatosis defined by optimal stratification was associated with decreased cancer-specific survival in rectal cancer, and not colon cancer. The reason for these divergent results is unclear and could be explained by differences in cohort characteristics. In comparison, this study included a higher proportion of women and patients with stages I–II tumors, while a lower proportion had rectal cancers.
SMI was weakly but significantly inversely associated with higher stage (p < .05; ). Similar findings were observed in a cohort with a smaller proportion of stage IV CRC patients (74 out of 856 patients) than in this study (p = .056) [Citation30], whereas a null association was reported from a cohort of 322 stages I–III CRC patients [Citation21]. In a post hoc analysis including only stages I–III patients, we found no statistically significant association between stage and SMI (p = .078). Thus, any association between prediagnostic SMI and stage of CRC at diagnosis may depend primarily on more advanced (stage IV) disease. To further examine this, we performed a survival analysis including stage IV and missing stage, and found a similar but stronger association to cancer-specific survival than when using only stages I–III CRC (Supplementary Figure 3). However, the difference was not statistically significant.
Limitations of this study include the retrospective design, and the high proportion of patients with missing CT scans in the early stages of digital storage of radiological images and patient records. However, the proportion of patients with missing or unusable CT scans were similar to other cohorts [Citation9,Citation21], and, moreover, the NSHDS is population-based and has a very high participant rate [Citation36]. Furthermore, the sensitivity analyses excluding the years prior to full implementation of digital radiology in 2003 yielded similar results to the full analysis. In some cases, marginal amounts of subcutaneous adipose tissue were outside of the field-of-view and therefore SAT should be interpreted with caution. Previous studies have not observed an association between SAT and survival estimates in multivariable analyses, and our results are in concordance with this essentially null [Citation26]. A potential weakness is that we lacked data on co-morbidity at diagnosis. In a previous study, co-morbidities defined by the Charlson co-morbidity index score were not associated with SMI, while low SMR was associated with an increased score [Citation58]. Thus, co-morbidities could potentially be related to SMR in this study. However, we excluded all stage IV tumors from survival analysis, many of which were not eligible for surgery due to frailty, and also all patients who died within 30 days of surgery. Moreover, our primary outcome is not overall survival, but cancer-specific survival and survival data were collected by an experienced colorectal surgeon using medical records, and not exclusively from registries, which can be misleading [Citation59]. This is particularly important when studying sarcopenia since it is a risk factor for all-cause mortality [Citation60,Citation61], postoperative complications [Citation62,Citation63], and CRC patients with sarcopenia are at a higher risk of cardiovascular events [Citation64]. Furthermore, clinical data for all patients were verified by a gastrointestinal pathologist specialized in CRC, regarding tumor stage and site, and date of surgery and diagnosis. Another major strength of our study is the population-based nature of the NSHDS cohorts, reducing the risk of selection bias [Citation65,Citation66].
In summary, we found that sarcopenia and myosteatosis, but not adiposity measures, were associated with decreased cancer-specific survival in non-metastatic, also early-stage, CRC. Sarcopenia measured by CT may thus have potential clinical utility, for prognostication, therapeutic decision making and the identification of patients in need of early nutritional or pharmacological anti-sarcopenic intervention. Our finding of lower SMI and SMR in right-sided CRC, independent of clinical stage at diagnosis, hints toward molecular pathological traits, such as KRAS mutations, of potential interest with respect to mechanisms of cancer cachexia.
Supplemental Material
Download Zip (2.5 MB)Acknowledgments
The authors thank Dr. Åke Öberg for excellent assistance.
Disclosure statement
The authors report no conflicts of interest.
Additional information
Funding
References
- Ma Y, Yang Y, Wang F, et al. Obesity and risk of colorectal cancer: a systematic review of prospective studies. PLoS One. 2013;8(1):e53916.
- Singla P, Bardoloi A, Parkash AA. Metabolic effects of obesity: a review. World J Diabetes. 2010;1(3):76–88.
- Jinjuvadia R, Lohia P, Jinjuvadia C, et al. The association between metabolic syndrome and colorectal neoplasm: systemic review and meta-analysis. J Clin Gastroenterol. 2013;47(1):33–44.
- Cespedes Feliciano EM, Kroenke CH, Caan BJ. The obesity paradox in cancer: how important is muscle? Annu Rev Nutr. 2018;38:357–379.
- Prado CM, Antoun S, Sawyer MB, et al. Two faces of drug therapy in cancer: drug-related lean tissue loss and its adverse consequences to survival and toxicity. Curr Opin Clin Nutr Metab Care. 2011;14(3):250–254.
- Joglekar S, Nau PN, Mezhir JJ. The impact of sarcopenia on survival and complications in surgical oncology: a review of the current literature. J Surg Oncol. 2015;112(5):503–509.
- da Rocha IMG, Marcadenti A, de Medeiros GOC, et al. Is cachexia associated with chemotherapy toxicities in gastrointestinal cancer patients? A prospective study. J Cachexia Sarcopenia Muscle. 2019;10(2):445–454.
- Hopkins JJ, Skubleny D, Bigam DL, et al. Barriers to the interpretation of body composition in colorectal cancer: a review of the methodological inconsistency and complexity of the CT-defined body habitus. Ann Surg Oncol. 2018;25(5):1381–1394.
- Caan BJ, Meyerhardt JA, Kroenke CH, et al. Explaining the obesity paradox: the association between body composition and colorectal cancer survival (C-SCANS Study). Cancer Epidemiol Biomarkers Prev. 2017;26(7):1008–1015.
- Martin L, Birdsell L, Macdonald N, et al. Cancer cachexia in the age of obesity: skeletal muscle depletion is a powerful prognostic factor, independent of body mass index. J Clin Oncol. 2013;31(12):1539–1547.
- Feliciano EMC, Kroenke CH, Meyerhardt JA, et al. Association of systemic inflammation and sarcopenia with survival in nonmetastatic colorectal cancer: results from the C SCANS study. JAMA Oncol. 2017;3(12):e172319.
- Hopkins JJ, Reif RL, Bigam DL, et al. The impact of muscle and adipose tissue on long-term survival in patients with stage I to III colorectal cancer. Dis Colon Rectum. 2019;62(5):549–560.
- Grossberg AJ, Chamchod S, Fuller CD, et al. Association of body composition with survival and locoregional control of radiotherapy-treated head and neck squamous cell carcinoma. JAMA Oncol. 2016;2(6):782–789.
- Caan BJ, Cespedes Feliciano EM, Prado CM, et al. Association of muscle and adiposity measured by computed tomography with survival in patients with nonmetastatic breast cancer. JAMA Oncol. 2018;4(6):798–804.
- Aust S, Knogler T, Pils D, et al. Skeletal muscle depletion and markers for cancer cachexia are strong prognostic factors in epithelial ovarian cancer. PLoS One. 2015;10(10):e0140403.
- Akahori T, Sho M, Kinoshita S, et al. Prognostic significance of muscle attenuation in pancreatic cancer patients treated with neoadjuvant chemoradiotherapy. World J Surg. 2015;39(12):2975–2982.
- Rier HN, Jager A, Sleijfer S, et al. Low muscle attenuation is a prognostic factor for survival in metastatic breast cancer patients treated with first line palliative chemotherapy. Breast. 2017;31:9–15.
- van Dijk DP, Bakens MJ, Coolsen MM, et al. Low skeletal muscle radiation attenuation and visceral adiposity are associated with overall survival and surgical site infections in patients with pancreatic cancer. J Cachexia Sarcopenia Muscle. 2017;8(2):317–326.
- Shachar SS, Williams GR, Muss HB, et al. Prognostic value of sarcopenia in adults with solid tumours: a meta-analysis and systematic review. Eur J Cancer. 2016;57:58–67.
- Kroenke CH, Prado CM, Meyerhardt JA, et al. Muscle radiodensity and mortality in patients with colorectal cancer. Cancer. 2018;124(14):3008–3015.
- McSorley ST, Black DH, Horgan PG, et al. The relationship between tumour stage, systemic inflammation, body composition and survival in patients with colorectal cancer. Clin Nutr. 2018;37(4):1279–1285.
- Yamamoto N, Fujii S, Sato T, et al. Impact of body mass index and visceral adiposity on outcomes in colorectal cancer. Asia Pac J Clin Oncol. 2012;8(4):337–345.
- Cespedes Feliciano EM, Kroenke CH, Meyerhardt JA, et al. Metabolic dysfunction, obesity, and survival among patients with early-stage colorectal cancer. JCO. 2016;34(30):3664–3671.
- Doyle SL, Bennett AM, Donohoe CL, et al. Establishing computed tomography-defined visceral fat area thresholds for use in obesity-related cancer research. Nutr Res. 2013;33(3):171–179.
- Brown JC, Caan BJ, Prado CM, et al. The association of abdominal adiposity with mortality in patients with stage I-III colorectal cancer. J Natl Cancer Inst. 2019. DOI:10.1093/jnci/djz150
- Black D, Mackay C, Ramsay G, et al. Prognostic value of computed tomography: measured parameters of body composition in primary operable gastrointestinal cancers. Ann Surg Oncol. 2017;24(8):2241–2251.
- Yang J, Zhang T, Feng D, et al. A new diagnostic index for sarcopenia and its association with short-term postoperative complications in patients undergoing surgery for colorectal cancer. Colorectal Dis. 2019;21(5):538–547.
- Martin L, Hopkins J, Malietzis G, et al. Assessment of computed tomography (CT)-defined muscle and adipose tissue features in relation to short-term outcomes after elective surgery for colorectal cancer: a multicenter approach. Ann Surg Oncol. 2018;25(9):2669–2680.
- van Vugt JLA, Coebergh van den Braak RRJ, Lalmahomed ZS, et al. Impact of low skeletal muscle mass and density on short and long-term outcome after resection of stage I-III colorectal cancer. Eur J Surg Oncol. 2018;44(9):1354–1360.
- Malietzis G, Currie AC, Johns N, et al. Skeletal muscle changes after elective colorectal cancer resection: a longitudinal study. Ann Surg Oncol. 2016;23(8):2539–2547.
- Prado CM, Lieffers JR, McCargar LJ, et al. Prevalence and clinical implications of sarcopenic obesity in patients with solid tumours of the respiratory and gastrointestinal tracts: a population-based study. Lancet Oncol. 2008;9(7):629–635.
- Miyamoto Y, Baba Y, Sakamoto Y, et al. Sarcopenia is a negative prognostic factor after curative resection of colorectal cancer. Ann Surg Oncol. 2015;22(8):2663–2668.
- Ulanja MB, Rishi M, Beutler BD, et al. Colon cancer sidedness, presentation, and survival at different stages. J Oncol. 2019;2019:1–12.
- Yamauchi M, Lochhead P, Morikawa T, et al. Colorectal cancer: a tale of two sides or a continuum? Gut. 2012;61(6):794–797.
- Lodewick TM, van Nijnatten TJ, van Dam RM, et al. Are sarcopenia, obesity and sarcopenic obesity predictive of outcome in patients with colorectal liver metastases? HPB (Oxford). 2015;17(5):438–446.
- Norberg M, Wall S, Boman K, et al. The Västerbotten Intervention Programme: background, design and implications. Global Health Action. 2010;3. DOI:10.3402/gha.v3i0.4643
- Benckert M, Lilja M, Soderberg S, et al. Improved metabolic health among the obese in six population surveys 1986 to 2009: the Northern Sweden MONICA study. BMC Obes. 2015;2(1):7.
- Mourtzakis M, Prado CM, Lieffers JR, et al. A practical and precise approach to quantification of body composition in cancer patients using computed tomography images acquired during routine care. Appl Physiol Nutr Metab. 2008;33(5):997–1006.
- Shen W, Punyanitya M, Wang Z, et al. Visceral adipose tissue: relations between single-slice areas and total volume. Am J Clin Nutr. 2004;80(2):271–278.
- Prado CM, Birdsell LA, Baracos VE. The emerging role of computerized tomography in assessing cancer cachexia. Curr Opin Support Palliat Care. 2009;3(4):269–275.
- Axelsson J. 2019. imlook4d. [cited 2009 Sep 13] Available from: https://sites.google.com/site/imlook4d/
- Danai LV, Babic A, Rosenthal MH, et al. Altered exocrine function can drive adipose wasting in early pancreatic cancer. Nature. 2018;558(7711):600–604.
- van Vugt JLA, Coebergh van den Braak RRJ, Schippers HJW, et al. Contrast-enhancement influences skeletal muscle density, but not skeletal muscle mass, measurements on computed tomography. Clin Nutr. 2018;37(5):1707–1714.
- Yong FH, Tian L, Yu S, et al. Optimal stratification in outcome prediction using baseline information. Biometrika. 2016;103(4):817–828.
- Giannoni A, Baruah R, Leong T, et al. Do optimal prognostic thresholds in continuous physiological variables really exist? Analysis of origin of apparent thresholds, with systematic review for peak oxygen consumption, ejection fraction and BNP. PLoS One. 2014;9(1):e81699.
- Meyerhardt JA, Kroenke CH, Prado CM, et al. Association of weight change after colorectal cancer diagnosis and outcomes in the kaiser permanente Northern California Population. Cancer Epidemiol Biomarkers Prev. 2017;26(1):30–37.
- Meyers BM, Cosby R, Quereshy F, et al. Adjuvant chemotherapy for stage II and III colon cancer following complete resection: a cancer care ontario systematic review. Clin Oncol. 2017;29(7):459–465.
- Advani SM, Advani PG, VonVille HM, et al. Pharmacological management of cachexia in adult cancer patients: a systematic review of clinical trials. BMC Cancer. 2018;18(1):1174.
- Strasser B, Steindorf K, Wiskemann J, et al. Impact of resistance training in cancer survivors: a meta-analysis. Med Sci Sports Exerc. 2013;45(11):2080–2090.
- Prado CM, Purcell SA, Laviano A. Nutrition interventions to treat low muscle mass in cancer. J Cachexia Sarcopenia Muscle. 2020. DOI:10.1002/jcsm.12525
- Aversa Z, Costelli P, Muscaritoli M. Cancer-induced muscle wasting: latest findings in prevention and treatment. Ther Adv Med Oncol. 2017;9(5):369–382.
- Kamphorst JJ, Nofal M, Commisso C, et al. Human pancreatic cancer tumors are nutrient poor and tumor cells actively scavenge extracellular protein. Cancer Res. 2015;75(3):544–553.
- Teunissen SC, Wesker W, Kruitwagen C, et al. Symptom prevalence in patients with incurable cancer: a systematic review. J Pain Symptom Manage. 2007;34(1):94–104.
- Shiono M, Huang K, Downey RJ, et al. An analysis of the relationship between metastases and cachexia in lung cancer patients. Cancer Med. 2016;5(9):2641–2648.
- Miller A, McLeod L, Alhayyani S, et al. Blockade of the IL-6 trans-signalling/STAT3 axis suppresses cachexia in Kras-induced lung adenocarcinoma. Oncogene. 2017;36(21):3059–3066.
- Baracos VE. Bridging the gap: are animal models consistent with clinical cancer cachexia?. Nat Rev Clin Oncol. 2018;15(4):197–198.
- Hamada T, Nowak JA, Milner DA, Jr, et al. Integration of microbiology, molecular pathology, and epidemiology: a new paradigm to explore the pathogenesis of microbiome-driven neoplasms. J Pathol. 2019;247(5):615–628.
- Xiao J, Caan BJ, Weltzien E, et al. Associations of pre-existing co-morbidities with skeletal muscle mass and radiodensity in patients with non-metastatic colorectal cancer. J Cachexia Sarcopenia Muscle. 2018;9(4):654–663.
- Okuyama A, Shibata A, Nishimoto H. Critical points for interpreting patients’ survival rate using cancer registries: a literature review. J Epidemiol. 2018;28(2):61–66.
- Brown JC, Harhay MO, Harhay MN. Sarcopenia and mortality among a population-based sample of community-dwelling older adults. J Cachexia Sarcopenia Muscle. 2016;7(3):290–298.
- Zhang X, Wang C, Dou Q, et al. Sarcopenia as a predictor of all-cause mortality among older nursing home residents: a systematic review and meta-analysis. BMJ Open. 2018;8(11):e021252.
- Jochum SB, Kistner M, Wood EH, et al. Is sarcopenia a better predictor of complications than body mass index? Sarcopenia and surgical outcomes in patients with rectal cancer. Colorectal Dis. 2019;21(12):1372–1378.
- Lieffers JR, Bathe OF, Fassbender K, et al. Sarcopenia is associated with postoperative infection and delayed recovery from colorectal cancer resection surgery. Br J Cancer. 2012;107(6):931–936.
- Brown JC, Caan BJ, Prado CM, et al. Body composition and cardiovascular events in patients with colorectal cancer: a population-based retrospective cohort study. JAMA Oncol. 2019;5(7):967.
- Pukkala E, Andersen A, Berglund G, et al. Nordic biological specimen banks as basis for studies of cancer causes and control–more than 2 million sample donors, 25 million person years and 100,000 prospective cancers. Acta Oncol. 2007;46(3):286–307.
- Weinehall L, Hallgren CG, Westman G, et al. Reduction of selection bias in primary prevention of cardiovascular disease through involvement of primary health care. Scand J Prim Health Care. 1998;16(3):171–176.