
Abstract
Background
Typically, cardiac substructures are neither delineated nor analyzed during radiation treatment planning. Therefore, we developed a novel machine learning model to evaluate the impact of cardiac substructure dose for predicting radiation-induced pericardial effusion (PCE).
Materials and methods
One-hundred and forty-one stage III NSCLC patients, who received radiation therapy in a prospective clinical trial, were included in this analysis. The impact of dose-volume histogram (DVH) metrics (mean and max dose, V5Gy[%]–V70Gy[%]) for the whole heart, left and right atrium, and left and right ventricle, on pericardial effusion toxicity (≥grade 2, CTCAE v4.0 grading) were examined. Elastic net logistic regression, using repeat cross-validation (n = 100 iterations, 75%/25% training/test set data split), was conducted with cardiac-based DVH metrics as covariates. The following model types were constructed and analyzed: (i) standard model type, which only included whole-heart DVH metrics; and (ii) a model type trained with both whole-heart and substructure DVH metrics. Model performance was analyzed on the test set using area under the curve (AUC), accuracy, calibration slope and calibration intercept. A final fitted model, based on the optimal model type, was developed from the entire study population for future comparisons.
Results
Grade 2 PCE incidence was 49.6% (n = 70). Models using whole heart and substructure dose had the highest performance (median values: AUC = 0.820; calibration slope/intercept = 1.356/−0.235; accuracy = 0.743) and outperformed the standard whole-heart only model type (median values: AUC = 0.799; calibration slope/intercept = 2.456/−0.729; accuracy = 0.713). The final fitted elastic net model showed high performance in predicting PCE (median values: AUC = 0.879; calibration slope/intercept = 1.352/−0.174; accuracy = 0.801).
Conclusions
We developed and evaluated elastic net regression toxicity models of radiation-induced PCE. We found the model type that included cardiac substructure dose had superior predictive performance. A final toxicity model that included cardiac substructure dose metrics was developed and reported for comparison with external datasets.
Background
Radiation therapy (RT) is a standard treatment modality for most types of thoracic cancer (e.g. esophageal, Hodgkin’s lymphoma, breast, lung). In particular, most patients with non-small-cell lung cancer (NSCLC) will receive RT as part of their overall treatment strategy. However, these patients are at risk for various radiation-induced toxicities that affect the normal lung, esophagus, and heart. These normal tissue toxicities can have life-threatening consequences and affect patient outcomes by reducing quality-of-life and limiting radiation dose.
Pericardial effusion (PCE) is one of the most common thoracic RT-related cardiac toxicities [Citation1]. Severe cases of PCE can result in cardiac tamponade, which requires immediate medical intervention [Citation2]. While RT-related cardiac toxicities were thought to be of minor concern in the treatment approach for NSCLC patients, recent studies have disputed this notion. Results of the RTOG-0617 trial [Citation3] showed cardiac dose to be an independent predictor of overall survival in RT-treated NSCLC patients, in whom cardiac toxicities were persistent. In addition, a pooled analysis of multiple RT dose-escalation trials for NSCLC demonstrated that cardiac toxicities may occur earlier than previously thought [Citation4]. Taken together, these findings, as well as an anticipated improvement in the survival of NSCLC patients due to more efficacious treatment, demonstrate the importance of understanding cardiac dose-response, and more specific to this study, how to accurately model and predict radiation-induced PCE.
Traditionally, cardiac toxicity models consider clinicopathologic factors and dose-volume histogram (DVH) metrics from the whole heart [Citation1,Citation5,Citation6]. However, studies on lymphoma [Citation7,Citation8] and breast cancer [Citation9–11] have demonstrated that cardiac substructure anatomy have important dose-response characteristics that are not reflected by the whole-heart dose. To date, no study has examined the influence of cardiac substructures on the toxicity modeling process using a cross-validated, dose-response modeling methodology for PCE in a cohort of NSCLC patients.
The aim of this study was to develop an elastic net logistic regression toxicity model and apply this model to determine if the inclusion of cardiac substructure dose increased predictive performance. We hypothesized that including cardiac substructure dose in the toxicity modeling process would optimize models, as compared to traditional models that rely solely on whole-heart dose. A secondary aim of this study was to develop a toxicity model based on our findings, which can be compared in future analyses using external datasets.
Material and methods
Patient population
All patients were retrospectively analyzed from a prospective clinical trial comparing intensity modulated radiation therapy (IMRT) and passively scattered proton therapy (PSPT) for NSCLC treatment [Citation12]. Patients with a history of thoracic RT or those lacking follow-up computed tomography (CT) imaging were excluded. A total of 141 patients were included in the analysis.
All patients were treated with either PSPT or IMRT, using a prescription dose of ≥60 Gy to 95% of the planning target volume (PTV) in 2-Gy daily fractions. RT treatment planning was conducted with Pinnacle (Philips Healthcare, Bothell, WA) for IMRT patients and Eclipse (Varian Medical Systems, Palo Alto, CA) for those receiving PSPT. Concurrent chemotherapy (paclitaxel and carboplatin) was administered to all patients.
Follow-up evaluation consisted of CT imaging at 6 weeks after completing RT, every 3–6 months for 2 years post-RT, and then once every 6–12 months thereafter. The presence of PCE was evaluated on every follow-up CT by a radiologist and independently confirmed by a radiation oncologist. PCE was graded according to the Common Terminology Criteria for Adverse Events (CTCAE) version 4.0 and defined as an asymptomatic, small-to-moderate sized effusion [Citation13]. This study was approved by the University of Texas-MD Anderson Institutional Review Board, with written informed consent being obtained from all patients. For all analyses, the endpoint was ≥ grade 2 PCE.
Heart contouring and dose-volume histogram metrics
A previously validated [Citation14,Citation15] in-house multi-atlas contouring service software was utilized to automatically delineate cardiac structures on the RT planning CT. All contours were reviewed by an experienced radiation oncologist and manually adjusted when necessary.
The dose-volume histogram (DVH) metrics for the whole heart, left atrium (LA), left ventricle (LV), right atrium (RA), and right ventricle (RV) were extracted for each patient; these metrics included the mean and maximum dose, as well as the relative volume receiving at least a given dose (e.g. V50Gy[%] for the percent volume of a given structure receiving at least 50 Gy), from 5–70 Gy in 5 Gy increments.
Univariate analysis
DVH metrics from the heart and substructures, as well clinicopathological factors (age, sex, smoking status, diabetes, heart disease, GTV, performance status, stage, histology, tumor location, RT modality, and induction chemotherapy), were analyzed between patient groups according to PCE grade.
To analyze differences in the DVH metrics of patients based on PCE incidence, the Mann–Whitney U-test was utilized. For clinicopathologic covariates, the Mann–Whitney U-test and Fisher’s exact test was used for continuous and categorical variables, respectively.
Statistical modeling
The toxicity modeling approach utilized for this study was elastic net logistic regression, which is a type of penalized logistic regression [Citation16,Citation17]. Least absolute shrinkage and selection operator (LASSO) logistic regression is another widely used penalized regression method that robustly models RT toxicity prediction [Citation18–20]. LASSO uses an L1 penalty on the regression covariates to derive the model [Citation21]; however, this method is suboptimal when multiple correlated covariates are present, which is typical in RT modeling [Citation16]. Elastic net regression improves the LASSO technique by adding a penalty term for the L2 norm and including a mixing parameter that defines the proportion of penalty applied to the covariates between both L1 and L2 norms. Taken together, the elastic net regression method allows retention of correlated covariates, but also regularizes model predictors in a manner that allows for improved prediction performance. More details on elastic net logistic regression are included in the Supplementary Materials.
Elastic net regression models were constructed for the prediction of PCE using a repeated cross-validation methodology; this approximates the generalizability of the modeling process when lacking an external validation dataset [Citation22–24]. To determine the importance of cardiac substructures in modeling PCE, we developed several model types, which included a whole-heart dose only model type and a whole-heart plus cardiac substructures model type. More specifically, the ‘whole heart-only’ model type, which is considered the standard model type for PCE toxicity analysis, can only include DVH metrics of the whole heart. Conversely, the ‘whole heart plus cardiac substructures’ model type can include any DVH metric of the whole heart, as well as any DVH metric from all of the 4 cardiac substructures in the model building process.
The model development and analysis workflow is illustrated in . The clinicopathologic data, as well as the relevant dosimetric data (after filtering for a specific model type) from the entire study cohort were included in the repeated cross-validation, model-building process. Each iteration of cross-validation creates a unique model, with the overall process creating 100 unique models for a given model type. The data are randomly split into test and training sets using a 25%/75% respective split prior to model construction. These datasets were then separately preprocessed and standardized. The ith model of the 100 iterations is trained using an inner 5-fold cross-validation procedure, which selects both the optimal hyperparameters and model covariates. Next, model performance is assessed using the test set, which was blinded from model construction. A number of metrics were calculated at each iteration of the repeated cross-validation process. To assess model calibration, the calibration slope and intercept were calculated. To quantify discrimination and accuracy, area under curve (AUC) from receiver operating characteristic analysis and confusion matrix-derived accuracy were utilized, respectively.
Figure 1. Overview of the model construction and analysis workflow.
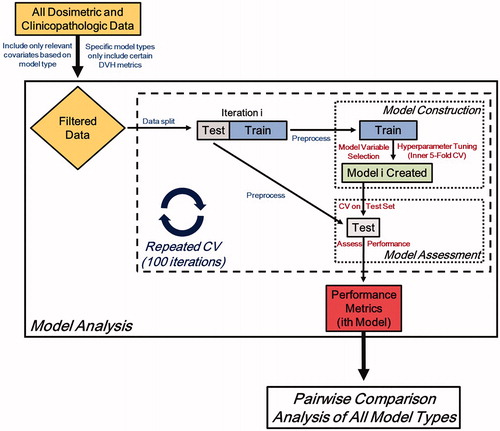
Model types were then analyzed using a pairwise comparison of each performance metric from all iterations of cross-validation using the paired Wilcoxon signed-rank test. It should be noted that the random split of data was initialized with a unique random seed, which permitted the pairwise comparisons of all model types and removes random selection bias in the analysis.
Fitted elastic net model
A final model was fitted to the entire cohort data (n = 141) using a similar approach to the statistical modeling of the above subsection. For this final model, we allowed the model variables to be selected using the elastic net penalization from any DVH metric from the whole-heart, LA, RA, LV, and/or RV. The model performance metrics were then computed and analyzed (AUC, accuracy, and calibration slope and intercept). A crucial difference in the approach of the final model fit is that cross-validation was not conducted, as the entire patient cohort comprised of the training set.
Statistical considerations
A p-value of p < .05 was considered statistically significant. All statistical analyses were conducted in R (version 3.2.3, R Development Core Team, Vienna, Austria). The R package Caret was used to implement elastic net logistic regression modeling.
Results
Patient characteristics
The clinicopathologic characteristics of the study patients are shown in Supplementary Table 1. The median time to PCE was 9.9 months (range, 0.7–56.3 months). In addition, the median follow-up time was 28.6 months (range, 6.1–72.8 months).
Univariate analysis
The mean and max dose of the whole heart and cardiac substructures (grouped according to PCE severity) are shown in . Most cardiac substructure DVH metrics were significantly higher in the grade 2 PCE cohort (Supplementary Table 2). Of all the cardiac substructures, the LA received the highest mean and max dose.
Figure 2. Boxplot of (A) mean and (B) max dose for the whole heart and each cardiac substructure, grouped according to PCE grade (grade 0, n = 71; ≥grade 2, n = 70). Average DVH plots of the study cohort, as grouped according to PCE incidence (blue, grade 0; red ≥ grade 2), for the (C) PTV, (D) whole heart, (E) left atrium, (F) right atrium, (G) left ventricle, and (H) right ventricle are shown. The solid line represents the mean DVH value and the shaded regions indicate the 95% CIs.
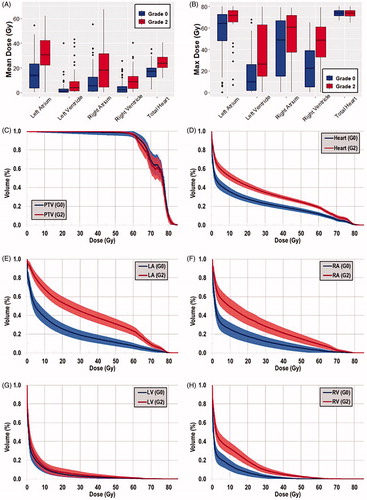
The mean DVHs of the study patients, as grouped by PCE severity, are shown in . There were large differences between the average DVHs of the whole heart and each of the cardiac substructures. Moreover, when examining the distribution of PCE severity, as stratified by mean whole heart and mean cardiac substructure dose in a pairwise manner, many patients had large dosimetric differences in the heart and each respective substructure (Supplementary Figure 1). Notably, the whole heart mean dose was less than the mean dose to either atria for many patients.
Statistical modeling
The results of the elastic net regression modeling are shown in . The whole-heart plus cardiac substructures model type, which included DVH metrics from the whole heart and cardiac substructures, had the highest performance for all evaluation metrics.
Table 2. Final PCE prediction model.
Performance metrics were analyzed according to paired ranks from each iteration of cross-validation (. For each performance metric, the percentage in which the whole-heart plus cardiac substructures model type ranked higher than the whole-heart only model type was calculated for all 100 iterations of cross-validation. For all 4 evaluation metrics, the whole-heart plus cardiac substructures model type significantly outperformed the standard whole-heart only model type.
Table 1. Results of the elastic net regression modeling analysis.
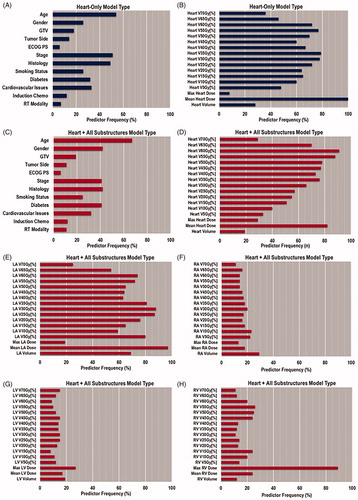
The importance of individual covariates for both model types is illustrated in . The typical predictors of PCE were often found in the heart-only model type, namely, mean heart dose and V35Gy[%] [Citation7–11]. When comparing this result with those of the whole heart plus cardiac substructures model type, we found that LA mean dose and RV max dose became highly recurring features.
Figure 3. The percent occurrence of covariates from the 100 iterations of the toxicity modeling for the (A,B) heart-only and (C–H) heart plus all substructures model types.
Fitted elastic net model
The final fitted PCE toxicity model was allowed to select any of the whole-heart and cardiac substructure DVH metric during model construction. Ultimately, the final model consisted of only clinicopathologic factors, as well as whole heart, LA, and RV DVH metrics (). The model showed strong performance with an AUC, accuracy, and calibration slope/intercept of 0.879, 0.801, and 1.352/−0.175, respectively.
Discussion
In this study, we examined the impact of including cardiac substructure dose on toxicity modeling of PCE for 141 NSCLC patients, who were treated with RT. We developed several elastic net logistic regression toxicity models; some included cardiac substructure dose, while a traditional whole-heart dose only model type did not. We confirmed our hypothesis that including cardiac substructure dose would improve toxicity modeling of PCE in our cohort. The primary findings of this study were that the inclusion of cardiac substructure dose metrics optimized our PCE prediction model. In addition, we developed a predictive model for PCE toxicity that had strong performance. The necessary characteristics of this model for reproduction in future studies are reported.
We found considerable heterogeneity in the dose distribution between the cardiac substructures based on patient groupings of PCE grade (, Supplementary Figure 1, and Supplementary Table 2). Regarding treatment technique, IMRT patients had higher dose-volumes at lower dose levels, but PSPT patients had higher dose-volumes at higher doses (Supplementary Figures 2 and 3, Supplementary Table 3). However, when analyzing dose differences for patients with grade 2 PCE, most DVH metrics were not significantly different between RT modality (Supplementary Table 3). The differences in dose distribution of the cardiac substructures between IMRT and PSPT modalities were found to be similar to a previous study of esophageal cancer patients [Citation14].
Among our study population, LA had the highest dose-volume of any substructure and the whole heart. These findings are consistent with a previous study of PCE incidence in a cohort of 112 patients, where both atria received significantly higher doses than the whole heart for patients with PCE (mean doses: LA, 49.4 Gy; RA, 37.8 Gy; whole heart, 24.5 Gy) [Citation25]. Moreover, DVH metrics of patients with and without PCE in the previous report were quite similar to our study (e.g. mean heart dose: all patients, 12.3 vs. 20.6 Gy; ≥grade 2, 24.5 vs. 24.7 Gy); however, the LA dose was lower in our cohort (e.g. LA mean dose: all patients, 24.7 vs. 23.1 Gy; ≥grade 2, 49.4 vs. 31.3 Gy).
Our statistical modeling results demonstrate the utility and necessity of cardiac substructure dose for optimizing PCE toxicity models. The most striking finding was that for each performance metric (AUC, accuracy, calibration intercept and slope), the standard whole heart-only model type was significantly outperformed by the whole heart plus cardiac substructures model type (). These findings emphasize the importance of including substructure dose for PCE prediction modeling.
LA mean dose was an important feature in the modeling process since this was the most recurring predictor in the highest performing model type (). In a pooled analysis of cardiac toxicity in stage III NSCLC patients, the only DVH parameter found to have marginal significance with PCE was V5Gy[%] of the whole heart [Citation4]; however, the only substructure analyzed dosimetrically was the LV. In another study by the same group, LA mean dose was one of several DVH metrics (whole heart, RA, and LA) that was correlated to PCE in stage III NSCLC patients (RV dose was not analyzed) [Citation25]. However, the aforementioned study only analyzed mean and max dose, as well as V5Gy[%], V30Gy[%], and V60Gy[%]. In our cohort, LA mean doses were found to be 15.2 Gy and 31.3 Gy for patients with grade 0 and 2 PCE, respectively. Furthermore, patients with grade 2 PCE had mean LA doses of 29.4 Gy and 34.9 Gy for IMRT and PSPT techniques, respectively. Taken together with the results of the statistical modeling, LA mean dose appears to be a dominant feature of PCE in our cohort. Therefore, a dose constraint on the LA may be useful in preventing PCE (e.g. LA mean dose of no more than 27 Gy), but this hypothesis would have to be verified in future studies.
After determining that the whole heart plus all cardiac substructures model type was optimal, a PCE prediction model was developed on the using the entire patient cohort. The final model included whole-heart, LA, and RV DVH metrics. Of the substructure metrics, LA mean dose was an important feature. All model performance metrics achieved encouraging values during model assessment; however, this model should be analyzed using another patient cohort for validation. To our knowledge, this is the first logistic regression model for radiation-induced PCE to be developed from a large cohort of NSCLC patients.
This study raises several questions regarding the clinical implications of our findings including: (i) the dose-response characteristics of each of these cardiac substructures; (ii) the recommended dose limits to avoid PCE; (iii) the expected reduction in toxicity is reasonably achievable given this data and (iv) how can this new information be efficiently incorporated into the clinical workflow. Due to the development of advanced auto-contouring techniques, clinical implementation of cardiac substructures being included in the RT planning process should not be burdensome [Citation14,Citation15]. Items ii–iv will require future studies using large cohorts; moreover, additional validation studies will be necessary to confirm any substructure dose constraint. Little is known about the precise radiation-response mechanism of pericardial effusion [Citation26]. Furthermore, how this normal tissue injury relates to cardiac substructure irradiation is not well understood. Further elucidation of the radiation-response mechanism in the individual cardiac substructures should be examined in future studies.
This work had some limitations. Since this study was conducted retrospectively, there may be some selection bias. However, the data was collected as part of a prospective clinical trial, which strengthens the quality of the data. Another limitation was the lack of an external validation set for modeling testing. While external validation is considered the gold standard of statistical modeling, the availability of such a dataset is rare. Therefore, this work is the first step in the development of this model and our findings should be verified in other datasets. This is particularly important for the final fitted model, as it should be tested in other datasets to determine its validity. Finally, this was primarily a model optimization analysis and did not examine the potential radiosensitivity of each substructure; therefore, a future study using a mechanistic approach should be conducted to examine this phenomenon.
In conclusion, radiation-induced PCE model types that utilized cardiac substructure dose outperformed the traditional model type that only incorporated whole-heart dose metrics. Moreover, future studies should examine the radiosensitivity of the cardiac substructures to determine dose constraints. Our final elastic-net toxicity model might be useful for predicting PCE in future studies.
Supplemental Material
Download PDF (979.5 KB)Disclosure statement
There are no conflicts of interest associated with this work.
Additional information
Funding
References
- Gagliardi G, Constine LS, Moiseenko V, et al. Radiation dose-volume effects in the heart. Int J Radiat Oncol Biol Phys. 2010;76(3 Suppl):S77–S85.
- Osawa S, Yamada T, Saitoh T, et al. Treatment with corticosteroid for pericardial effusion in a patient with advanced synchronous esophageal and gastric cancers following chemoradiotherapy. Case Rep Gastroenterol. 2010;4(2):229–237.
- Bradley JD, Paulus R, Komaki R, et al. Standard-dose versus high-dose conformal radiotherapy with concurrent and consolidation carboplatin plus paclitaxel with or without cetuximab for patients with stage IIIA or IIIB non-small-cell lung cancer (RTOG 0617): a randomised, two-by-two factorial phase 3 study. Lancet Oncol. 2015;16(2):187–199.
- Wang K, Eblan MJ, Deal AM, et al. Cardiac toxicity after radiotherapy for stage III non-small-cell lung cancer: pooled analysis of dose-escalation trials delivering 70 to 90 Gy. JCO. 2017;35(13):1387–1394.
- He L, Chapple A, Liao ZX, et al. Bayesian regression analyses of radiation modality effects on pericardial and pleural effusion and survival in esophageal cancer. Radiother Oncol. 2016;121(1):70–74.
- Ning MS, Tang L, Gomez DR, et al. Incidence and predictors of pericardial effusion after chemoradiation therapy for locally advanced non-small cell lung cancer. Int J Radiat Oncol Biol Phys. 2017;99(1):70–79.
- Cella L, Liuzzi R, Conson M, et al. Multivariate normal tissue complication probability modelling of heart valve dysfunction in Hodgkin lymphoma survivors. Int J Radiat Oncol Biol Phys. 2013;87(2):304–310.
- Moignier A, Broggio D, Derreumaux S, et al. Coronary stenosis risk analysis following Hodgkin lymphoma radiotherapy: a study based on patient specific artery segments dose calculation. Radiother Oncol. 2015;117(3):467–472.
- Correa CR, Litt HI, Hwang WT, et al. Coronary artery findings after left-sided compared with right-sided radiation treatment for early-stage breast cancer. J Clin Oncol. 2007;25(21):3031–3037.
- Nilsson G, Holmberg L, Garmo H, et al. Distribution of coronary artery stenosis after radiation for breast cancer. J Clin Oncol. 2012;30(4):380–386.
- Correa CR, Das IJ, Litt HI, et al. Association between tangential beam treatment parameters and cardiac abnormalities after definitive radiation treatment for left-sided breast cancer. Int J Radiat Oncol Biol Phys. 2008;72(2):508–516.
- Liao Z, Lee JJ, Komaki R, et al. Bayesian adaptive randomization trial of passive scattering proton therapy and intensity-modulated photon radiotherapy for locally advanced non-small-cell lung cancer. J Clin Oncol. 2018;36(18):1813–1822.
- National Cancer Institute. Common terminology criteria for adverse events v4.0 (NIH publication #09e7473). Bethesda, MD: National Cancer Institute, National Institutes of Health, US Department of Health and Human Services; 2009.
- Shiraishi Y, Xu C, Yang J, et al. Dosimetric comparison to the heart and cardiac substructure in a large cohort of esophageal cancer patients treated with proton beam therapy or intensity-modulated radiation therapy. Radiother Oncol. 2017;125(1):48–54.
- Yang J, Amini A, Williamson R, et al. Automatic contouring of brachial plexus using a multi-atlas approach for lung cancer radiation therapy. Pract Radiat Oncol. 2013;3(4):e139–e147.
- Zou H, Hastie T. Regularization and variable selection via the elastic net. J Royal Statistical Soc B. 2005;67(2):301–320.
- Hastie T, Tibshirani R, Friedman J. The elements of statistical learning: data mining, inference, and prediction. 2nd ed. New York, NY: Springer; 2009.
- Niedzielski JS, Yang J, Liao Z, et al. 18F-Fluorodeoxyglucose positron emission tomography can quantify and predict esophageal injury during radiation therapy. Int J Radiat Oncol Biol Phys. 2016;96(3):670–678.
- Dean JA, Wong KH, Welsh LC, et al. Normal tissue complication probability (NTCP) modelling using spatial dose metrics and machine learning methods for severe acute oral mucositis resulting from head and neck radiotherapy. Radiother Oncol. 2016;120(1):21–27.
- Dean JA, Wong K, Gay H, et al. Incorporating spatial dose metrics in machine learning-based normal tissue complication probability (NTCP) models of severe acute dysphagia resulting from head and neck radiotherapy. Clin Transl Radiat Oncol. 2018;8:27–39.
- Tibshirani R. Regression shrinkage and selection via the lasso. J R Statist Soc B. 1996;58(1):267–288.
- Niedzielski JS, Yang J, Stingo F, et al. A novel methodology using CT imaging biomarkers to quantify radiation sensitivity in the esophagus with application to clinical trials. Sci Rep. 2017;7(1):6034
- Deist TM, Dankers F, Valdes G, et al. Machine learning algorithms for outcome prediction in (chemo)radiotherapy: an empirical comparison of classifiers. Med Phys. 2018;45(7):3449–3459.
- Xu CJ, van der Schaaf A, Schilstra C, et al. Impact of statistical learning methods on the predictive power of multivariate normal tissue complication probability models. Int J Radiat Oncol Biol Phys. 2012;82(4):e677–e684.
- Wang K, Pearlstein KA, Patchett ND, et al. Heart dosimetric analysis of three types of cardiac toxicity in patients treated on dose-escalation trials for Stage III non-small-cell lung cancer. Radiother Oncol. 2017;125(2):293–300.
- Imazio M, Adler Y. Management of pericardial effusion. Eur Heart J. 2013;34(16):1186–1197.