
Abstract
Background
Predicting oncologic outcomes is essential for optimizing the treatment for patients with cancer. This review examines the feasibility of using Computed Tomography (CT) images of fat density as a prognostic factor in patients with cancer.
Methods
A systematic literature search was performed in PubMed, Embase and Cochrane up to March 2020. All studies that mentioned using subcutaneous or visceral adipose tissue (SAT and VAT, respectively) CT characteristics as a prognostic factor for patients with cancer were included. The primary endpoints were any disease-related outcomes in patients with cancer.
Results
After screening 1043 studies, ten studies reporting a total of 23 – ten for SAT and thirteen for VAT – comparisons on survival, tumor recurrence and postsurgical infection were included. All ten studies included different types of malignancy: six localized, two metastatic disease, and two both. Five different anatomic landmarks were used to uniformly measure fat density on CT: lumbar (L)4 (n = 4), L3 (n = 2), L4-L5 intervertebral space (n = 2), L5-S1 intervertebral space (n = 1), and the abdomen (n = 1). Overall, six of ten SAT comparisons (60%) and six of thirteen VAT comparisons (46%) reported a significant (p < .05) association of increased SAT or VAT density with an adverse outcome. All remaining nonsignificant comparisons, except one, deviated in the same direction of being predictive for adverse outcomes but failed to reach significance. The median hazard ratio (HR) for the nine SAT and thirteen VAT associations where HRs were given were 1.45 (95% confidence interval [CI] 1.01–1.97) and 1.90 (95% CI 1.12–2.74), respectively. The binomial sign test and Fisher’s method both reported a significant association between both SAT and VAT and adverse outcomes.
Conclusion
This review may support the feasibility of using SAT or VAT on CT as a prognostic tool for patients with cancer in predicting adverse outcomes such as survival and tumor recurrence. Future research should standardize radiologic protocol in prospective homogeneous series of patients on each cancer diagnosis group in order to establish accurate parameters to help physicians use CT scan defined characteristics in clinical practice.
Introduction
Although the treatment of malignant disease is rapidly advancing, the number of cases continues to rise with a 20% increase in the past ten years [Citation1]. Due to the increased need for management of this patient group, accurate prediction of survival, complications, and tumor recurrence can be valuable tools to aid physicians in optimizing treatment for their patients.
Predicting oncologic outcomes are difficult since multiple factors play a role. Most prediction models include clinical variables such as age, comorbidities, and functional status [Citation2], but there has been a trend in recent studies of using computed tomography (CT) acquired body composition characteristics as a prognostic tool to predict outcomes for patients undergoing oncologic treatment [Citation3–8]. CT scans are often utilized in patients with malignant disease; using the extra information from previously obtained CT scans could be an efficient way to increase the accuracy of prognostication with minimal patient demand. Cross-sectional imaging using CT has recently been shown to be useful for quantitatively assessing muscle and adipose tissue areas as predictive factors for various complications and survival in patients with malignant disease [Citation3,Citation6,Citation9]. Qualitative measurements, expressed as the radiodensity or attenuation in Hounsfield Units (HU) of tissue, have also recently been described for muscle tissue as a novel imaging biomarker that is highly correlated with various outcomes in patients with cancer [Citation4,Citation5]. However, qualitative measurements of subcutaneous and visceral adipose tissue (SAT and VAT, respectively) density have been described as well, but the results vary [Citation4,Citation5,Citation7,Citation8,Citation10]. Recent studies have shown that the metabolic changes associated with malignant disease can result in changes to adipocytes, including adipocyte shrinkage and increases in fibrosis [Citation11]. In turn, smaller adipocytes and increased fibrosis have also been shown to be associated with increased density of abdominal fat on CT [Citation12]. Increased adipose density means that the composition of the tissue is relatively low in lipid content, high in vascularity and high in extracellular matrix [Citation13]. Therefore, increased SAT or VAT density may be correlated with more profound cancer associated metabolic changes and adverse outcomes. The aim of this systematic review was to assess the current literature on the feasibility of using qualitative characteristics SAT and VAT density on CT as a prognostic factor for patients with malignant disease ().
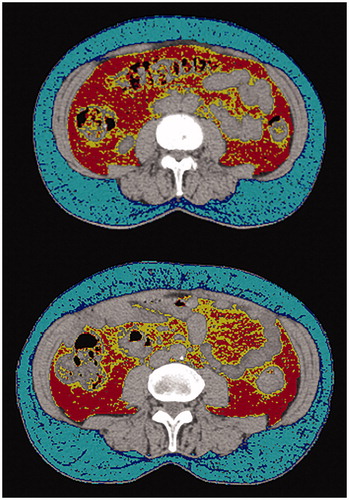
Figure 1. Example of axial computed tomography (CT) at the fourth lumbar vertebrae used for Subcutaneous Adipose Tissue (SAT) and Visceral Adipose Tissue (VAT) density (attenuation) measurements. Abdominal adipose tissue is identified using threshold density cutoffs. For this figure, the cut off values used for SAT were -50 to -150 HU, with -99 to -150 HU shown in dark blue and -50 to -99 HU shown in light blue. The cut off values for VAT were -50 to -150 HU, with -97 to -150 HU shown in yellow and -50 to -97 HU shown in red. Cut off values vary slightly between studies but methodology remains similar. A HU value less negative (closer to zero), indicates that the tissue is more radio dense. Adipose tissue is generally manually highlighted, and mean density can be automatically computed.
Material and methods
Systematic literature search
In accordance with the PRISMA (Preferred Reporting Items for Systematic Reviews and Meta-Analyses) systematic review guidelines, a systematic literature search was performed in PubMed, Embase and Cochrane without date restriction (last search on March 1, 2020) [Citation14]. Each database was systematically searched for studies with patients with localized or metastatic malignant disease who had their adipose tissue density measured by CT-attenuation (Supplementary Appendix 1).
After duplicate removal, all studies were screened on title and abstract by two independent reviewers (NDK, PKT) and all disagreements were resolved by discussion with a third reviewer (OQG). Studies that included mention of using adipose tissue CT characteristics as a prognostic factor for patients with malignant disease were included. References used in relevant studies were also screened for potential studies missed by the literature search. Mendeley Desktop Version 1.19.4 (Mendeley Ltd., London, UK) was used as reference management software [Citation15]. Standardized forms were used to extract and record data using an electronic database (Microsoft Excel Version 16.21; Microsoft Inc, Redmond, WA, USA).
Eligibility criteria
All studies that assessed the effect of SAT or VAT density on any outcome in patients with malignant disease, were included in our review. Studies in which (1) SAT or VAT density was not used as a predictive variable, or (2) the outcome was not studied in a population of patients with malignant disease were excluded ().
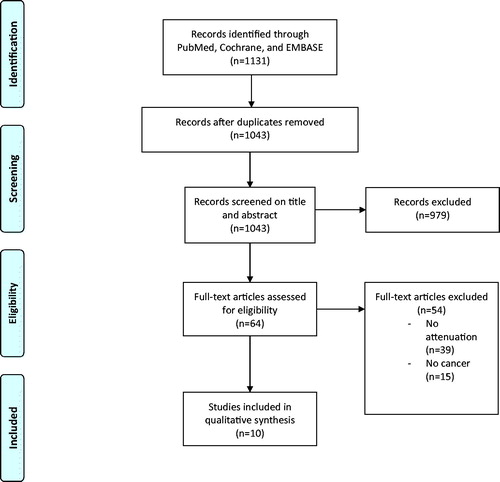
Figure 2. Flowchart of study selection.
Assessment of methodological quality
Both reviewers (PKT, NDK) independently assessed all included studies using a modified version of the Newcastle-Ottawa quality assessment scale for cohort studies tailored to our topic by adding reported disclosure, clear study aim, explanation of CT density methods, clear outcome comparison, sensible statistical analysis, and adequate follow-up length for the outcome of interest [Citation16]. These categories were graded on a binary scale of 0 (unclear, not reported, or inadequately reported) or 1 (clear or adequately reported). Any disagreements were resolved by consulting a third reviewer (OQG). A full description of the assessment strategy is available in Supplementary Appendix 2.
Data extraction
Data was independently collected from each study using a standardized form by both reviewers. Variables extracted were (1) cancer type, (2) outcome, (3) number of patients, (4) anatomic region of CT measurement, mean density with standard deviation or range for both (5) SAT and (6) VAT, (7) hazard ratio (HR) associated with SAT and VAT density and outcome with each corresponding p-values, and (8) whether the study treated density as a continuous variable or used cutoff values to establish a dichotomous variable. Means in HU for adipose tissue are negative due to fat being less dense than water. The HR was transformed in studies where the ratio was reported as the inverse to the other studies. The HR corresponding to the final multivariable model with the most co-variables was used in cases where multiple HRs were reported.
Statistical analysis
We considered a quantitative meta-analysis for pooling HRs to be inappropriate due to the heterogeneity in patient populations, CT protocols, cancer types and outcomes. Providing a pooled HR with the data for different outcomes and types of cancers would result in hazard ratios with minimal clinical validity. To summarize the findings in a quantitative form, the associations between fat density and outcome, and the median HR with 95% confidence interval (CI) was calculated for all studies. Two meta-analysis methods were performed which are commonly used when the data underlying the tests are difficult to combine: binomial sign test and Fisher’s method. The binomial sign test will assess the favorability of one particular direction in repeated measurements by comparing the ratios of positive and negative HRs, irrespective of whether the results are significant [Citation17]. Fisher’s method will test the null hypothesis that all of the separate null hypotheses from each study are true by computing a combined p-value for all available p-values [Citation18].
Results
The conducted search yielded 1043 unique studies. Sixty-four potentially eligible studies were selected by title and abstract screening, of which ten remained after full-text screening (). Ten studies were scrutinized in the critical appraisal process (Supplementary Appendix 2) [Citation4,Citation5,Citation9,Citation12,Citation13,Citation19–24]. One study did not have adequate follow-up because the median time to outcome was 32 months and the median follow-up for patients without the event was only 33 months [Citation20]. Three studies did not adequately explain the CT protocols and whether contrast was used [Citation19,Citation23,Citation24]. After critical appraisal, all 10 studies were included in this review [Citation4,Citation5,Citation9,Citation12,Citation13,Citation19–24]. The design of the included studies was retrospective in eight [Citation4,Citation5,Citation9,Citation12,Citation20–24] and prospective in two [Citation13,Citation19].
Three different outcomes were used by the ten studies: five studies used survival [Citation4,Citation9,Citation20,Citation21,Citation24], five studies used recurrence [Citation5,Citation9,Citation19,Citation21,Citation23], and one study used post-surgical infections [Citation4] ().There is overlap between these outcomes as two studies assessed two different outcomes [Citation4,Citation21]. Both SAT and VAT were assessed as input variables in seven studies [Citation4,Citation5,Citation9,Citation13,Citation20,Citation22,Citation23], one study only assessed SAT [Citation24], and two assessed VAT [Citation19,Citation21]. Overall the ten studies had a total of 23 comparisons, 10 for SAT and 13 for VAT. The ten studies included various types of malignancies. Localized malignancy was examined in six studies: prostate cancer (n = 2) [Citation20,Citation24], extremity sarcomas (n = 1) [Citation4], head and neck squamous cell carcinoma (n = 1) [Citation9], gastric cancer (n = 1) [Citation21], and various other histological types (n = 1) [Citation13]. Two studies included only metastatic disease from colorectal malignancy [Citation19] and renal cell carcinoma [Citation23]. Two studies looked at both localized and metastatic disease in extremity sarcomas [Citation5] and pancreatic adenocarcinoma [Citation22]. Five different anatomic landmarks were used to uniformly measure fat density on CT: lumbar (L)4 (n = 4) [Citation4,Citation5,Citation9,Citation22], L3 (n = 2) [Citation19,Citation23], L4-L5 intervertebral space (n = 2) [Citation21,Citation24], L5-S1 intervertebral space (n = 1) [Citation20], and the abdomen (n = 1) [Citation13]. Three studies treated fat density as a continuous variable [Citation4,Citation5,Citation13] while the remaining seven studies dichotomized fat density using a cutoff value ranging from −85 to −104 HU [Citation9,Citation13,Citation19,Citation20,Citation22–24]. In all studies, the HR from the multivariable model which controlled for the most variables was chosen. All studies used multivariate models controlling for several possible confounders. Of note, seven of ten studies controlled for BMI in their final model [Citation4,Citation5,Citation9,Citation13,Citation19,Citation22,Citation24]. In no model, across all studies, did controlling for BMI cause SAT or VAT to lose significance as a predictor for adverse outcomes.
Table 1. Characteristics of the ten included studies.
All studies contained multivariate corrections, with age being controlled for in seven of ten studies [Citation4,Citation5,Citation9,Citation13,Citation19,Citation22,Citation23], BMI in seven of ten studies [Citation5,Citation9,Citation13,Citation19,Citation20,Citation22,Citation24], and sex in five of ten studies [Citation5,Citation9,Citation13,Citation22,Citation23]. A full description of each studies’ multivariate corrections is available in Supplementary Appendix 3. Six of ten studies used non-contrast CT scans to measure fat density [Citation4,Citation5,Citation9,Citation20–22], while the remaining studies did not specify. CT protocol was described in seven out of ten studies [Citation4,Citation5,Citation9,Citation13,Citation21,Citation22,Citation24]. Three of ten studies specified a 100 mA, 120kVp, attenuation correction [Citation9,Citation21,Citation22] and two out of ten studies specified a slice thickness of 5 mm; table feed per rotation of 18 mm; time per table rotation of 0.5 s; tube voltage of 120 kVp; tube current of 11 mAs; and field of view of 50 cm, attenuation correction [Citation4,Citation5]. Three of ten studies used a Biograph mCT 128 scanner [Citation9,Citation21,Citation22] and two of ten studies used a Biograph 16 or 64 scanner [Citation4,Citation5]. The remaining studies did not report what CT equipment they used [Citation13,Citation19,Citation20,Citation23,Citation24]. Four of ten studies included patients that underwent surgery, radiotherapy and/or chemotherapy [Citation4,Citation5,Citation9,Citation22] two of ten studies included patients that only underwent chemotherapy [Citation19,Citation23], one study included patients who had surgery with radiotherapy [Citation20], one study included patients who had surgery with or without chemotherapy [Citation21] one study only included patients who had radiotherapy [Citation24] and one study did not report the therapy the patients underwent [Citation13].
In one study, the HR was originally reported as the ratio of recurrence in the quartile with the lowest density (farthest from zero) when compared with the three quartiles with the highest density (closest to zero) [Citation24]. We inverted this HR in order to be consistent with the other reported HRs.
Quantitative analysis
Increased SAT density was significantly (p < .05) associated as a predictor for decreased survival in three out of four comparisons [Citation5,Citation13,Citation22], increased tumor recurrence in two out of five comparisons [Citation4,Citation24], and higher incidence of post-surgical wound infection in one out of one comparison [Citation4]. Overall, six of ten SAT comparisons (60%) [Citation4,Citation5,Citation13,Citation22,Citation24] reported a significant association between SAT as an independent variable for an adverse outcome (death, complication, or tumor recurrence) The overall median HR for all nine comparisons where an HR was given was 1.45 (95% CI 1.01–1.97) [Citation4,Citation5,Citation9,Citation13,Citation22–24].
Increased VAT density was significantly associated as a predictor for decreased survival in four of out six comparisons [Citation13,Citation19,Citation21,Citation22], increased tumor recurrence in two out of six comparisons [Citation9,Citation21], and higher incidence of post-surgical wound infection in zero out of one comparison [Citation4]. Overall, six of thirteen VAT comparisons (46%) [Citation9,Citation13,Citation19,Citation21,Citation22] reported a significant association between VAT as an independent variable for an adverse outcome (death, complication, or tumor recurrence). The overall median HR for all thirteen comparisons was 1.90 (95% CI 1.12–2.74) [Citation4,Citation5,Citation9,Citation13,Citation19–23].
The binomial sign test was ten out of ten (p = .002) in the same direction for SAT and twelve out of thirteen (p = .002) in the same direction for VAT that increased fat density is associated with an adverse outcome [Citation4,Citation5,Citation9,Citation13,Citation19–23]. The Fisher’s method was a combined p < .001 for SAT and p = .003 for VAT.
Discussion
The use of CT scan acquired body composition characteristics for prognostication in patients with malignant disease has gained traction in recent literature [Citation3–8]. This systematic review may support the feasibility of using SAT or VAT density on CT as a prognostic tool for patients with malignancy in predicting adverse outcomes such as survival and tumor recurrence. It may augment existing prognostication tools and the decision-making capacity of clinicians in oncology.
Six out of ten comparisons that used SAT as an independent variable and six out of thirteen using VAT found that increased adipose density was significantly associated with adverse outcomes. All remaining comparisons, except for one, deviated in the same direction of being predictive for adverse outcomes but failed to reach significance. This trend is represented by significant binomial sign tests for both SAT and VAT. Although our data are not uniform, the aggregate of these studies suggests that there is validity to the claim that SAT and VAT on CT can be used in prognostication for patients with malignant disease. This finding is supported in non-oncologic populations, including a large, international multicenter cohort study of 7000 adults that demonstrated that increased adipose tissue density is associated with decreased survival [Citation13]. With only one study looking at post-surgical wound infections, it was not possible to make any greater conclusion on this topic from this literature search [Citation4].
The methodology and interpretation of tissue quantification from CT scan requires scrutiny. Different CT protocols, such as use of contrast and variability between different types of scanners can affect the measurements of tissue density [Citation25]. In this review, four studies did not specify whether contrast was used in their CT protocol [Citation19,Citation23,Citation24] and only five studies reported the scanner type used, with no more than three studies using the same type of scanner. Furthermore the physiological density of SAT and VAT are likely dependent on population characteristics such as sex, age, and race [Citation6]. In this review, each study controlled for different parameters with multivariable correction. With the variability in the corrected parameters between each study, it further emphasizes the heterogeneity of the studies being compared. The studies in this review also included several different types of both localized and metastatic cancer. It is possible that gastric or pancreatic malignancies might affect nutritional status and therefore adipose tissue in different ways than non-gastrointestinal malignancies. Metastatic disease may also present with altered metabolic states that could affect fat density in other ways than localized disease. Cachexic cancer patients have been shown to have altered metabolic pathways in adipose tissue [Citation26]. The metabolic ramifications of localized- versus metastatic disease could also potentially play a role in the increase in fat density seen in patients with adverse outcomes. There are multiple hypotheses for the causes of increased fat density in cancer patients [Citation13]. Promotion of fibrosis formation in adipose tissue has similar characteristics to those in tumorigenesis [Citation27–30]. There may also be an association between the vascularity of dysregulated adipose and a microenvironment that includes growth factors favorable for cancer cells [Citation13,Citation31]. Therefore, further studies are needed to determine the effects of these clinical variables on SAT and VAT and how generalizable they are throughout various populations with different types of malignancies. In this field of research, standardized radiologic reporting for specific populations is crucial in determining clinically applicable SAT and VAT values. In addition, the variability in the chosen radiological landmarks for each study further complicates drawing a robust conclusion from this data since five different landmarks were used by the ten studies.
The underlying mechanism for the relationship between adipose tissue density and outcomes in the oncologic population remains ambiguous, although some consensus exists. Cancer cells have been shown to catabolize host adipose tissue to fuel their growth [Citation29,Citation32]. In addition, adipose cells in patients with malignant disease altered their expression of genes involved in fat catabolism and extracellular matrix regulation when compared to non-cachectic patients with malignant disease [Citation11]. Adipose tissue in cachectic patients with malignant disease has been shown to consist of shrunken cells with increased intracellular fibrosis when compared to non-cachectic patients with malignant disease [Citation11]. An increased fat density on CT was also associated with shrunken adipocytes in a biopsy study in non-human primates [Citation12]. These morphological and genetic changes suggest that cancer cells increase catabolism of adipose tissue to fuel their growth, and the adipose tissue responds by shrinking of its cell size and increased extracellular fibrosis. Increased fibrosis, in turn, has been shown to correlate with increased density of adipose tissue on CT, suggesting a possible explanation for the correlation between adipose tissue density and cancer progression [Citation5,Citation12]. The studies in this review, together with the review by Bajestani et al. [Citation6] support the idea that qualitative (expressed e.g. by the density) and quantitative measurements (expressed as the cross sectional area) of CT evaluation of abdominal fat may be clinically useful in patients with cancer. CT evaluation of abdominal fat composition characteristics as a prognostic tool is desirable because the often already available and accessible scans provide a way to estimate outcome. However, correlating this with specific outcomes does not answer what the exact relationship is between those outcomes and the quality and quantity of adipose tissue [Citation6]. Being able to relate weight loss and cancer cachexia to CT-measured composition and quality of fat may provide a window into predicting mortality in these populations [Citation12]. Future studies should elucidate this relationship and broaden our understanding of the effects of adipose tissue quality and quantity in the complex cancer patient populations.
This review has several limitations. First, the studies were heterogeneous in nature resulting in a limited quantitative meta-analysis. However, we provided some quantitative measures in order to represent a summary of the performance overall, such as the median HR with 95% CI, binomial sign test, and Fisher’s method. Also, summarizing the results with medians does not provide adequate weight to each study based on quality, size and amount of comparisons made. First, all 10 studies were of comparable quality to justify the pooling, although two studies had a prospective design [Citation13,Citation19]. Second, the sample size ranged from 60 to 201 patients and no correction was made for this imbalance. However, 22 out of 23 comparisons across all studies demonstrated deviation in the same direction of being predictive for adverse outcomes and no differences could be detected in amount of significant associations between the smaller and larger studies. Third, three studies contributed multiple comparisons resulting in an overrepresentation of these associations [Citation4,Citation9,Citation21]. In addition, the actual association between fat density and an adverse outcome is still dependent on the characteristics such as primary tumor type and CT protocol. However, the heterogeneity of the studies also added validation to the hypotheses that increased SAT and VAT is associated with adverse outcomes because the effect is present in distinct populations of patients with different forms of malignant disease. Substantial publication and/or outcome bias could be present in this review as studies demonstrating associations might be published more often. Twenty-three outcomes from ten studies inherently limits the strength of the relationship we can describe between fat density and outcomes. Nevertheless, we deemed the limitations proportionate to the strength of this review. This review provides–to our knowledge–the first thorough overview of the applicability of SAT and VAT on CT as a prognostic factor in the oncologic population and its potential future role in clinical practice.
The use of CT acquired body composition characteristics is attractive because they are readily available and could increase the accuracy of prognostication. This review provides an overview of the associations between increased adipose tissue density and adverse outcomes including poor survival, increased tumor recurrence rate, and postoperative wound infection in patients with malignant disease. CT-defined fat composition could be increasingly incorporated in daily clinical practice since they are readily available in the oncologic population and can augment existing prognostication tools. However, the range of different CT protocols/diverse scanners/populations/etc. warrant several considerations for future research. First, uniform radiologic protocols should elucidate the exact relationship while controlling for confounding variables. Second, future studies need to include prospective homogeneous series of patients on each cancer diagnosis group and compare the added value of CT characteristics to current standard prognostication tools. This is necessary in order to establish accurate parameters to help physicians use CT scan defined characteristics in clinical practice.
Supplemental Material
Download MS Word (15.1 KB)Supplemental Material
Download MS Word (15.3 KB)Supplemental Material
Download MS Word (12.7 KB)Disclosure statement
The authors report no conflicts of interest. Each author certifies that he or she has no commercial associations (e.g. consultancies, stock ownership, equity interest, patent/licensing arrangements, etc.) that might pose a conflict of interest in connection with the submitted article.
Investigation performed at Massachusetts General Hospital, Boston USA.
References
- Weir HK, Thompson TD, Soman A, et al. The past, present, and future of cancer incidence in the United States: 1975 through 2020. Cancer. 2015;121(11):1827–1837.
- Fahy BN. Prognostication in oncology. J Surg Oncol. 2019;120(1):10–16.
- Joglekar S, Nau PN, Mezhir JJ. The impact of sarcopenia on survival and complications in surgical oncology: a review of the current literature. J Surg Oncol. 2015;112(5):503–509.
- De Amorim Bernstein K, Bos SA, Veld J, et al. Body composition predictors of therapy response in patients with primary extremity soft tissue sarcomas. Acta Radiol. 2018;59(4):478–484.
- Veld J, Vossen JA, De Amorim Bernstein K, et al. Adipose tissue and muscle attenuation as novel biomarkers predicting mortality in patients with extremity sarcomas. Eur Radiol. 2016;26(12):4649–4655.
- K-B SMR, M VC, B V, et al. Computed tomography-defined muscle and fat wasting are associated with cancer clinical outcomes. Semin Cell Dev Biol. 2016;54:2–10.
- Zakaria HM, Massie L, Basheer A, et al. Application of morphometrics as a predictor for survival in female patients with breast cancer spinal metastasis: a retrospective cohort study. Spine J. 2018;18(10):1798–1803.
- Zakaria HM, Schultz L, Mossa-Basha F, et al. Morphometrics as a predictor of perioperative morbidity after lumbar spine surgery. Neurosurg Focus. 2015;39(4):E5.
- L JW, B MJ, P JH, et al. Visceral adipose tissue volume and CT-attenuation as prognostic factors in patients with head and neck cancer. Head Neck. 2019;41:1605–1614.
- Zakaria HM, Massie L, Basheer A, et al. Application of morphometrics as a predictor for survival in patients with prostate cancer metastasis to the spine. World Neurosurg. 2018;114:e913–e919.
- Mracek T, Stephens NA, Gao D, et al. Enhanced ZAG production by subcutaneous adipose tissue is linked to weight loss in gastrointestinal cancer patients. Br J Cancer. 2011;104(3):441–447.
- Murphy RA, Register TC, Shively CA, et al. Adipose tissue density, a novel biomarker predicting mortality risk in older adults. J Gerontol A Biol Sci Med Sci. 2014;69(1):109–117.
- Rosenquist KJ, Massaro JM, Pedley A, et al. Fat quality and incident cardiovascular disease, allcause mortality, and cancer mortality. J Clin Endocrinol Metab. 2015;100(1):227–234.
- Moher D, Liberati A, Tetzlaff J, The PRISMA Group, et al. Preferred reporting items for systematic reviews and meta-analyses: the PRISMA statement. PLoS Med. 2009;6(7):e1000097.
- Mendeley - Reference Management Software & Researcher Network [Internet]. Mendeley Ltd. Available from: https://www.mendeley.com/
- Wells GA, Shea B, O’Connell D, et al. The Newcastle-Ottawa Scale (NOS) for assessing the quality of nonrandomised studies in meta-analyses. [Internet]. Ottawa Hospital Research Institute. Available from: http://www.ohri.ca/programs/clinical_epidemiology/oxford.asp
- Abdi H. The binomial distribution the binomial and sign tests. In: Salkind NJ, editor. Encycl Meas Stat. Newbury Park, CA: SAGE Publications Inc.; 2007. p. 87–89.
- Ra F. Statistical methods for research workers. 5th ed. London: Oliver & Boyd; 1934.
- Charette N, Vandeputte C, Ameye L, et al. Prognostic value of adipose tissue and muscle mass in advanced colorectal cancer: a post hoc analysis of two non-randomized phase II trials. BMC Cancer. 2019;19(1):134.
- Zimmermann M, Delouya G, Barkati M, et al. Impact of visceral fat volume and fat density on biochemical outcome after radical prostatectomy and postoperative radiotherapy. Horm Mol Biol Clin Investig. 2016;26(3):173–178.
- Lee JW, Son MW, Chung IK, et al. Significance of CT attenuation and F-18 fluorodeoxyglucose uptake of visceral adipose tissue for predicting survival in gastric cancer patients after curative surgical resection. Gastric Cancer. 2020;23(2):273–284.
- Lee JW, Lee SM, Chung YA. Prognostic value of CT attenuation and FDG uptake of adipose tissue in patients with pancreatic adenocarcinoma. Clin Radiol. 2018;73(12):1056.e1–1056.e10.
- Gu W, Zhu Y, Wang H, et al. Prognostic value of components of body composition in patients treated with targeted therapy for advanced renal cell carcinoma: a retrospective case series. PLoS One. 2015;10(2):e0118022.
- Mcdonald AM, Fiveash JB, Kirkland RS, et al. Subcutaneous adipose tissue characteristics and the risk of biochemical recurrence in men with high-risk prostate cancer. Urol Oncol Semin Orig Investig. 2017;35(11):663.e15-663–e21.
- Boutin RD, Kaptuch JM, Bateni CP, et al. Influence of IV contrast administration on ct measures of muscle and bone attenuation: Implications for sarcopenia and osteoporosis evaluation. Am J Roentgenol. 2016;207(5):1046–1054.
- Dahlman I, Mejhert N, Linder K, et al. Adipose tissue pathways involved in weight loss of cancer cachexia. Br J Cancer. 2010;102(10):1541–1548.
- Divoux A, Clément K. Architecture and the extracellular matrix: the still unappreciated components of the adipose tissue. Obes Rev. 2011;12(5):e493–e503.
- Duncan MR, Berman B. Stimulation of collagen and glycosaminoglycan production in cultured human adult dermal fibroblasts by recombinant human interleukin 6. J Invest Dermatol. 1991;97(4):686–692.
- Nieman KM, Romero IL, Van Houten B, et al. Adipose tissue and adipocytes support tumorigenesis and metastasis. Biochim Biophys Acta. 2013;1831(10):1533–1541.
- Dirat B, Bochet L, Dabek M, et al. Cancer-associated adipocytes exhibit an activated phenotype and contribute to breast cancer invasion. Cancer Res. 2011;71(7):2455–2465.
- Sherwood LM, Parris EE, Folkman J. Tumor angiogenesis: therapeutic implications. N Engl J Med. 1971;285(21):1182–1186.
- Martinez-Outschoorn UE, Sotgia F, Lisanti MP. Power surge: supporting cells “fuel” cancer cell mitochondria. Cell Metab. Cell Press. 2012;15(1):4–5.