
Abstract
Purpose
Radiotherapy-related visual decline is a significant concern in survivors of childhood cancer; however, data establishing the dose-response relationship between dose to the optic apparatus and visual acuity decline in children are sparse. We aimed to determine this relationship in a cohort of children treated with proton therapy.
Material and methods
We identified 458 children with 875 eyes at risk treated with proton therapy for intracranial malignancy between December 2006 and September 2018. Eyes were considered at risk if either the ipsilateral optic nerve or optic chiasm received ≥30 GyRBE to 0.1 cm3. Kaplan–Meier and Normal Tissue Complication Probability modeling was used to establish the relationship between radiotherapy dose and risk of visual decline.
Results
Excluding children with tumor progression, no patient experienced complete vision loss. The actuarial 5-year rate of any visual acuity decline was 2.6% (95% confidence interval [CI]: 1.5%–4.6%). The dose to 0.1 cm3 of the ipsilateral optic nerve or optic chiasm resulting in a 1%, 5%, and 10% risk of acuity decline were 52.7 GyRBE, 56.6 GyRBE, and 58.3 GyRBE. Visual decline was only seen in children with primary tumors of the optic pathway or suprasellar region.
Conclusions
Visual acuity decline following radiotherapy for intracranial malignancies in children is rare. A dose of approximately 56 GyRBE to 0.1 cm3 results in an approximately 5% risk of visual acuity decline for children with suprasellar or optic pathway tumors. A dose to 0.1 cm3 of 56 GyRBE appears to be safe for children with tumors elsewhere in the brain.
Introduction
Tumors of the central nervous system (CNS) are the most common type of solid tumors in children. While survival following a cancer diagnosis in childhood has drastically improved in the last several decades, there is an increasing focus on the long-term consequences of cancer therapy. Based on historical data, nearly early every survivor of a childhood brain tumor will develop a severe, life-threatening or fatal chronic health condition with the average survivor developing six conditions by their fiftieth birthday [Citation1]. Given their often long survival, this has broad implications; long-term survivors have lower incomes in adulthood compared to peers without a history of cancer, and even compared to survivors of childhood lymphoma [Citation2,Citation3].
The dose-response relationships between radiotherapy (RT) dose to various intracranial substructures and the risk of several late effects in childhood cancer survivors – including endocrinopathy, cognitive decline, brainstem toxicity, and auditory decline – are well-established [Citation4–10]. However, data characterizing the dose-response relationship between radiation to the optic nerves and risk of visual acuity decline in children are sparse. Currently available data on dose-response relationships are largely derived from adult studies. Investigators of the Quantitative Analyses of Normal Tissue Effects in the Clinic (QUANTEC) study evaluating this relationship found that doses below a maximum point dose to the optic nerve of 50 Gy (in 2 Gy/day fractions) resulted in a ‘near zero’ incidence of radiation-induced optic neuropathy (RION) and that, following a dose of 55 Gy, RION was unusual [Citation11]. Yet this conclusion is entirely based on a series of adult patients, treated primarily without modern radiation technology such as intensity-modulated RT or proton therapy [Citation11]. Studies evaluating this relationship in a strictly pediatric population are limited to small analyses of children treated for a single diagnosis and, therefore, fail to establish comprehensive or quantitative dose-volume relationships [Citation12,Citation13].
To fill this crucial gap, our study analyzes the dose-response relationship between radiation dose to the optic nerves and risk of clinically significant decline in visual acuity in survivors of childhood cancer. Quantitative models are critical for informed discussions with patients and their families at the time of consultation, rational RT treatment plan development, post-therapy screening, and treatment protocol development.
Material and methods
Under an institutional review board-approved prospective outcome study (UF #IRB201703048), we evaluated children (age <22 years) treated at the University of Florida Health Proton Therapy Institute (Jacksonville, FL) between December 2006 and September 2018 for intracranial malignancies. All children were treated with double-scattered proton therapy with fraction sizes ≤2.0 GyRBE. We included only children who received at least 30 GyRBE to 0.1 cm3 of either the optic nerve or the optic chiasm as we children receiving less than this dose have a near-zero risk of decline based on prior data in adult populations [Citation11]. We contoured the optic nerve and chiasm based on a co-registered T1 magnetic resonance image. The optic chiasm was initially localized using a T1-sequence contrast-enhanced high-resolution MRI fused to a CT simulation. The final volume was then refined based on the CT scan windowed to maximum contrast resolution. Typically, these three structures (right optic nerve, left optic nerve, and optic chiasm) were included in plan optimization with the goal of delivering a dose of <55 GyRBE to 0.1 cm3; intermittent physician-guided adjustments were made to balance the risk of tumor control against late effects, altering these goals. Our contours of the optic structures were consistent with those in the contouring atlas for ACNS1721 and ACNS 1723 [Citation14]. We did not include the anterior optic nerves nor segments of the optic radiations lying posteriorly to the chiasm. We identified 458 children at risk. We defined the dose to each individual eye as the maximum dose to 0.1 cm3 to the ipsilateral optic nerve or the optic chiasm. We excluded from the analysis eyes that had no light perception at the time of treatment.
Visual acuity is a continuous outcome measure; however, for pragmatic analysis, we converted it to a categorical variable. We classified eyes as ‘impaired’ if the acuity of that eye was 20/40 (or equivalent) or worse, or if any visual field deficit was present. We classified eyes as ‘functionally blind’ if the acuity of that eye was 20/200 or worse but retained light perception. We classified eyes without any light perception as ‘completely blind.’ These definitions are based on relevant state and federal regulations [Citation15,Citation16]. A second physician reviewed each potential instance of visual decline and all reported incidents of visual decline received mutual agreement. Age permitting, all patients in this series underwent baseline ophthalmologic evaluation prior to RT. We additionally recommend at least yearly ophthalmologic evaluation after treatment in all children receiving intracranial radiation, guidelines that were in place for the entire duration of this study period. These recommendations were consistent regardless of tumor histology or location within the brain. All children (age permitting) received, at minimum, a clinical evaluation able to categorize the vision in each eye into the 4 categories used at the time of initial consultation. To assess the optic nerve and chiasm anatomy, all patients underwent high-resolution (1–1.5 mm) magnetic resonance imaging with intravenous contrast prior to treatment.
For analysis, eyes were censored at the time of local progression of the primary tumor, death of the patient, or time of last follow-up. We abstracted additional information regarding demographic data and other treatment received (non-biopsy surgeries and/or chemotherapy) from the patient chart. We used Kaplan–Meier and logistic regression modeling to describe the cumulative incidence and establish dose-response relationships between RT dose and risk of visual decline. All statistical analysis was performed on SAS software (Cary, NC).
Results
We identified 458 children with 875 eyes at risk. The median age at the time of treatment was 9.6 years (range, 1.3–21.8 years). The median follow-up of patients was 3.1 years (range, 0.1–11.8 years). shows the demographic, tumor, and treatment characteristics of the children in this study. A slight majority of children were male; a significant majority were white. The majority of patients had tumors of the suprasellar or optic pathway region. The most common histology was craniopharyngioma. Most children had a single operative procedure prior to RT, and most did not receive chemotherapy.
Table 1. Demographic and treatment characteristics of pediatric brain tumor patients at risk of visual decline (n = 458).
We identified 15 eyes in 11 children that showed improved vision following treatment. In contrast, there were 17 events of visual acuity decline in 13 children throughout the follow-up period. As a result, the 5-year actuarial incidences of visual acuity decline was 2.6% (95% confidence interval [CI]: 1.5–4.6%). The median time to visual acuity decline was 3.3 years (range, 0.5 years–6.3 years). shows the cumulative incidence of visual acuity decline throughout the study period. Of the 17 events, 14 led to an eye with normal or impaired vision becoming impaired (or more impaired). One event resulted in a functionally blind eye becoming more functionally blind. There were 2 events of eyes with impaired vision becoming functionally blind. No eyes at risk became completely blind in the follow-up period. describes these events.
Figure 1. Cumulative incidence of visual acuity decline in the eyes of children treated with radiotherapy for intracranial tumors and at high risk of acuity decline.
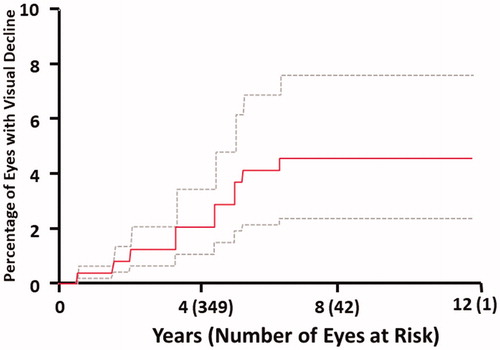
Table 2. Incidence of visual acuity decline among 13 patients (17 events) throughout the study period.
shows an logistic regression model for the relationship between the risk of visual decline and RT dose. This relationship is statistically significant (p = .04). The doses to 0.1 cm3 resulting in a 1%, 5%, and 10% risk of visual acuity decline in this cohort were 52.7 GyRBE, 56.6 GyRBE, and 58.3 GyRBE, respectively. shows univariate analyses of risk factors for visual acuity decline among survivors. The only factor that was significantly correlated with risk of visual acuity decline was the anatomic location of the primary tumor: Only children with tumors of the optic pathway or suprasellar fossa experienced acuity decline. Therefore, we generated a model including only eyes in children with suprasellar or optic pathway tumors. Among this population, the doses to 0.1 cm3 resulting in a 1%, 5%, and 10% risk of visual acuity were 52.5 GyRBE, 56.1 GyRBE, and 58.3 GyRBE. The lack of events and small number of children receiving doses in excess of 56 GyRBE to 0.1 cm3 of the optic pathway (8) in those with tumors of other anatomic regions precluded further analysis in that population. Neither the receipt of chemotherapy, the number of prior surgeries, race, nor baseline visual status was a significant predictors of visual decline.
Figure 2. Logistic regression model of the risk of visual acuity decline by radiotherapy dose to 0.1 cm3 of the ipsilateral optic nerve or optic chiasm.
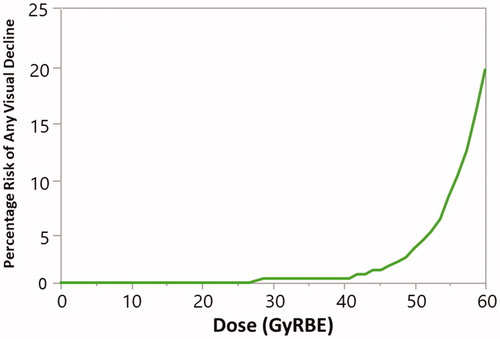
Table 3. Univariate analysis of risk factors for visual acuity decline in survivors of pediatric brain tumor (n = 875 eyes).
Discussion
In seeking to characterize the relationship between optic nerve radiation dose and risk of visual acuity decline in children with brain tumors receiving at least 30 GyRBE to 0.1 cm3 of the optic pathway, we found that the overall incidence of visual deterioration is low (2.6% at 5 years) and no child developed complete blindness. We also found that tumor location significantly correlated with risk, which may simply be evidence of bivariate confounding as patients with tumors of the optic pathway or suprasellar fossa generally received higher doses to the optic pathway. Alternatively, children with tumors infiltrating, displacing, or intrinsic to the optic nerves may truly be more sensitive to irradiation. Our low rate of events and high correlation between optic nerve dose and tumor location prohibit a multivariate analysis to better characterize this interaction. In patients with optic pathway or suprasellar fossa tumors, our data suggest limiting the optic nerve/chiasm dose to 56 GyRBE to 0.1 cm3 to keep the risk of visual acuity decline below 5%. For children with tumors arising elsewhere in the brain, no toxicity was observed and, therefore, the optic nerve tolerance may be higher. However, only 8 patients in our cohort with tumors beyond the sella/optic pathway received >56 GyRBE to the optic nerves/chiasm; so, our data cannot be used to specify an upper dose limit or explicit treatment recommendation for non-sellar/optic pathway tumors.
Our data should be interpreted within the context of existing literature on radiation-induced visual decline. The QUANTEC evaluation of optic nerve dose suggests that for maximum doses below 55 Gy (delivered with standard fractionation at daily doses <2.0 Gy) the risk of radiation-induced optic neuropathy approaches zero in adults [Citation11], an estimate generally consistent with our findings. The Children’s Oncology Group (COG) adopted a maximum dose of 54 Gy in the recently published ACNS0331 trial [Citation17] for medulloblastoma, a posterior fossa tumor. This dosimetric threshold has become commonly used in RT treatment planning in children and adults and may be too conservative, particularly for tumors that do not arise from the suprasellar/optic pathway region. Other studies suggest that a volume-based constraint, rather than maximum dose, serves as a better predictor, but these are studies on adult populations [Citation18]. The chiasm, as anatomically defined, is a small structure and thus not suitable for a reliable volumetric analysis.
Given the relatively high incidence of pediatric tumors arising near the optic pathway (such as optic pathway/hypothalamic gliomas, craniopharyngioma, germ cell tumors, and pituitary adenoma), models assessing the relationship between radiation dose to the optic nerves and risk of functional visual acuity decline are critical for decision-making but do not yet exist. An analysis of the Childhood Cancer Survivor Study showed a dose-response relationship between maximum dose to the ‘eye’ and risk of legal blindness, with an increased risk beyond 5 Gy. However, this finding relies on post-hoc dose reconstruction and represents a cohort of children treated prior to the adoption of modern RT techniques like intensity modulation and proton therapy [Citation19]. Further, the investigators grouped a broad spectrum of pathophysiology resulting in visual decline, including cataractogenesis, which are unrelated to optic nerve or optic chiasm dose.
Factors beyond the radiation dose likely influence visual acuity decline. We show that tumor location influences risk, and that the greatest risk is found in children with tumors of the suprasellar region or optic pathway. Investigators at St. Jude Children’s Research Hospital (Memphis, TN) published a small series including children with optic pathway glioma and describe visual acuity decline in 15 of 40 eyes among 20 patients, which is broadly consistent with what we observed. In these patients, pre-RT progression, pre-RT chemotherapy, and lack of pre-RT surgery appeared to increase the risk of visual decline in the ‘worse eye.’ [Citation12] We did not find a relationship between surgical intervention or chemotherapy (regardless of timing in relation to RT) with risk of visual decline. Nevertheless, over half of the patients in our series had a craniopharyngioma (51.1%), which is not treated with chemotherapy, thereby limiting our ability to detect an interaction. A more contemporary analysis of the St. Jude optic pathway glioma population found a 5-year cumulative incidence of visual decline of 17.9% – higher than our reported incidence. However, this is likely due to the enriched population of patients with optic pathway tumors and the use of an eight point scale for visual acuity that would be inherently more sensitive in catching visual decline [Citation20].
Treatment decisions in children with brain tumors, especially very young children, are challenging, and the toxicities associated with both chemotherapy and RT must be considered, especially in diseases such as optic pathway glioma where the primary risk of disease progression is vision loss. Data regarding visual acuity after chemotherapy for optic pathway glioma vary widely. A study regarding the impact of chemotherapy on visual acuity from Dodgshun et al. reported a 74% risk of visual decline, while a separate study from Shofty et al. reported only a 9% risk [Citation21,Citation22]. Rakotonjanahary et al. reported that 46.2% of patients treated with upfront chemotherapy had impaired vision at last follow-up [Citation23]. Vision is a vital sense, particularly during childhood development, and such wide variability in reported visual outcomes following chemotherapy is unsettling for families and their doctors who guide treatment decisions. It also underscores the urgent need for robust research into the late visual effects of chemotherapy for optic pathway gliomas in children. For example, if chemotherapy is only associated with a 10% risk of visual decline, its use is a reasonable alternative to first-line radiation in children with optic pathway tumors, particularly prepubescent patients. Alternately, if chemotherapy is instead associated with a 75% risk of vision loss – compared to <5% following radiation – then radiation should be considered among the first-line therapies for all pediatric optic pathway gliomas.
Our analysis is limited by several factors. First, the reliability of visual acuity and visual field examination in very young children is low. We tried to minimize this unreliability by applying pragmatic definitions of vision loss intended to capture only clinically relevant changes. Nonetheless, there are drawbacks to converting the continuous variable of visual acuity to a categorical variable. We censored children at the time of last follow-up and are confident that in that last follow-up we obtained relevant information to categorize each eye into the visual acuity bins that we use in this study. We recognize the imperfect nature of this method, but feel that the novelty and importance of the information presented herein compensates for its limitations. The frequency and detail of ophthalmologic follow-up among children is an uncontrolled, heterogenous factor based on individual practice patterns, both within and outside of North America. To mitigate the impact of this variability, we intentionally chose to categorize visual outcomes into 4 pragmatic groups that are most meaningful to patients and families. In addition, there is likely an interplay of several factors on the risk of visual decline, including tumor proximity to or involvement of the neve, volume of nerve irradiated, prior therapies, hydrocephalus, and potential as-yet-unknown factors. It is possible in selecting the variables included in this analysis that we unknowingly omitted an important predictor of visual decline. This analysis also represents a population of children treated entirely with proton therapy. There exists some controversy regarding the relative biologic effectiveness of proton therapy, especially at the distal end of the range, which may contribute to a higher than anticipated biologically effective dose in the optic structures in children where the end of range of an individual beam may be within or adjacent to the optic structures [Citation24]. Although photon data are limited, the similarity of dose-effect data reassuringly suggest our findings are applicable across radiation modalities.
We report that the risk of visual acuity decline following RT for brain tumors in children is low, and, within the typical doses used for common pediatric brain tumors, the risk of complete blindness is extremely small. Children with tumors of the suprasellar or the optic pathway region are at greatest risk and a dose of 56 GyRBE to the optic nerve or optic chiasm will result in ≤5% risk of decline in visual acuity. For children with tumors arising elsewhere in the brain, no toxicity was observed and, therefore, the optic nerve tolerance may be higher. However, we cannot make definitive recommendations given the small number of children (n = 8) with tumors outside of the suprasellar fossa or optic pathway receiving 56 GyRBE or more to 0.1 cm3 of the optic pathway. Despite limitations, our practical guidelines will be useful in an area where little dose-effect data exist, informing treatment planning for radiation oncologists and guiding complicated interdisciplinary decisions in these challenging cases.
This study was presented at the annual meeting of the American Society of Radiation Oncology (ASTRO), 18 September 2019, Chicago, IL.
Acknowledgments
This research was made possible through the support of the William and Joan Mendenhall Endowed Professorship.
Disclosure statement
The authors have no conflicts of interest to disclose.
References
- Bhakta N, Liu Q, Ness KK, et al. The cumulative burden of surviving childhood cancer: an initial report from the St Jude Lifetime Cohort Study (SJLIFE. Lancet (London, England). 2017;390(10112):2569–2582.
- Teckle P, Peacock S, McBride ML, et al. Long-term effects of cancer on earnings of childhood, adolescent and young adult cancer survivors – a population-based study from British Columbia, Canada. BMC Health Serv Res. 2018;18(1):826.
- Williams NL, Rotondo RL, Bradley JA, et al. Late effects after radiotherapy for childhood low-grade glioma. Am J Clin Oncol. 2018;41(3):307–312.
- Lawrence YR, Li XA, el Naqa I, et al. Radiation dose-volume effects in the brain. Int J Radiat Oncol Biol Phys. 2010;76(3):S20–S7.
- Mulhern RK, Palmer SL, Merchant TE, et al. Neurocognitive consequences of risk-adapted therapy for childhood medulloblastoma. J Cin Oncol. 2005;23(24):5511–5519.
- Vatner RE, Niemierko A, Misra M, et al. Endocrine deficiency as a function of radiation dose to the hypothalamus and pituitary in pediatric and young adult patients with brain tumors. J Cin Oncol. 2018;36(28):2854–2862.
- Indelicato DJ, Flampouri S, Rotondo RL, et al. Incidence and dosimetric parameters of pediatric brainstem toxicity following proton therapy. Acta Oncologica (Stockholm, Sweden). 2014;53(10):1298–1304.
- Vieira WA, Weltman E, Chen MJ, et al. Ototoxicity evaluation in medulloblastoma patients treated with involved field boost using intensity-modulated radiation therapy (IMRT): a retrospective review. Radiat Oncol. 2014;9(1):158.
- Scobioala S, Parfitt R, Matulat P, et al. Impact of radiation technique, radiation fraction dose, and total cisplatin dose on hearing: Retrospective analysis of 29 medulloblastoma patients. Strahlenther Onkol. 2017;193(11):910–920.
- Bass JK, Hua CH, Huang J, et al. Hearing loss in patients who received cranial radiation therapy for childhood cancer. J Clin Oncol. 2016;34(11):1248–1255.
- Mayo C, Martel MK, Marks LB, et al. Radiation dose-volume effects of optic nerves and chiasm. Int J Radiat Oncol Biol Phys. 2010;76(3 Suppl):S28–S35.
- Awdeh RM, Kiehna EN, Drewry RD, et al. Visual outcomes in pediatric optic pathway glioma after conformal radiation therapy. Int J Radiat Oncol Biol Phys. 2012;84(1):46–51.
- Greenberger BA, Pulsifer MB, Ebb DH, et al. Clinical outcomes and late endocrine, neurocognitive, and visual profiles of proton radiation for pediatric low-grade gliomas. Int J Radiat Oncol Biol Phys. 2014;89(5):1060–1068.
- Lucas JT, Perkins SM, Raleigh DR, et al. ACNS1721 and ACNS1723 Contouring Atlas. 2019. [cited 2020 Jun 28]. Available from: https://www.qarc.org/cog/ACNS1721_Contouring_Guidelines_20190306.pdf.
- Social Security Administration. § 404.1581. Meaning of blindness as defined in the law. Code of Federal Regulations1983 [cited 2019 Jul 1]. Available from: https://www.ssa.gov/OP_Home/cfr20/404/404-1581.htm.
- State of California Department of Motor Vehicles. Vision Requirements for Driving Class C Vehicles 2011 [cited 2019 Jul 1]. Available from: https://www.flhsmv.gov/pdf/opengov/vision_ca.pdf.
- Michalski J, Vezina G, Burger P, et al. MB-109: preliminary results of COG ACNS0331: a phase III trial of involved field radiotherapy (IFRT) and low dose craniospinarl irradiation (LD-CSI) with chemotherapy in average risk medulloblastoma: a report from the children's oncology group. Neuro Oncol. 2016;18(suppl 3):iii122.
- Martel MK, Sandler HM, Cornblath WT, et al. Dose-volume complication analysis for visual pathway structures of patients with advanced paranasal sinus tumors. Int J Radiat Oncol Biol Phys. 1997;38(2):273–284.
- Whelan KF, Stratton K, Kawashima T, et al. Ocular late effects in childhood and adolescent cancer survivors: a report from the childhood cancer survivor study. Pediatr Blood Cancer. 2010;54(1):103–109.
- Acharya S, Quesada S, Coca K, et al. Long-term visual acuity outcomes after radiation therapy for sporadic optic pathway glioma. J Neurooncol. 2019;144(3):603–610.
- Dodgshun AJ, Elder JE, Hansford JR, et al. Long-term visual outcome after chemotherapy for optic pathway glioma in children: Site and age are strongly predictive. Cancer. 2015;121(23):4190–4196.
- Shofty B, Ben-Sira L, Freedman S, et al. Visual outcome following chemotherapy for progressive optic pathway gliomas. Pediatr Blood Cancer. 2011;57(3):481–485.
- Rakotonjanahary J, Gravier N, Lambron J, et al. Long-term visual acuity in patients with optic pathway glioma treated during childhood with up-front BB-SFOP chemotherapy – analysis of a French pediatric historical cohort. PLoS One. 2019;14(3):e0212107.
- Mohan R, Peeler CR, Guan F, et al. Radiobiological issues in proton therapy. Acta Oncol. 2017;56(11):1367–1373.