
Abstract
Background
Inter-observer variations (IOVs) arising during contouring can potentially impact plan quality and patient outcomes. Regular assessment of contouring IOV is not commonly performed in clinical practice due to the large time commitment required of clinicians from conventional methods. This work uses retrospective information from past treatment plans to facilitate a time-efficient, evidence-based intervention to reduce contouring IOV.
Methods
The contours of 492 prostate cancer treatment plans created by four radiation oncologists were analyzed in this study. Structure volumes, lengths, and DVHs were extracted from the treatment planning system and stratified based on primary oncologist and inclusion of a pelvic lymph node (PLN) target. Inter-observer variations and their dosimetric consequences were assessed using Student’s t-tests. Results of this analysis were presented at an intervention meeting, where new consensus contour definitions were agreed upon. The impact of the intervention was assessed one-year later by repeating the analysis on 152 new plans.
Results
Significant IOV in prostate and PLN target delineation existed pre-intervention between oncologists, impacting dose to nearby OARs. IOV was also present for rectum and penile-bulb structures. Post-intervention, IOV decreased for all previously discordant structures. Dosimetric variations were also reduced. Although target contouring concordance increased significantly, some variations still persisted for PLN structures, highlighting remaining areas for improvement.
Conclusion
We detected significant contouring IOV in routine practice using easily accessible retrospective data and successfully decreased IOV in our clinic through a reflective intervention. Continued application of this approach may aid improvements in practice standardization and enhance quality of care.
Introduction
Radiotherapy treatment planning requires accurate delineation of target and organ at risk (OAR) volumes. Although guidelines for volume delineation are commonly used, the subjective nature of contouring nevertheless results in inter-observer variation (IOV). IOV has been observed for all major treatment sites [Citation1–5] and is regarded as a major source of uncertainty in radiotherapy delivery [Citation6,Citation7]. Minimization of IOV is important in the age of highly conformal radiotherapy as inaccurate volume delineation may result in geometric misses that may potentially negatively impact patient outcomes. Both modeling [Citation8] and clinical trial studies [Citation9–11] have demonstrated that patients treated with plans that are non-compliant with treatment standards (e.g., incorrectly defined target volumes) have higher rates of locoregional failure and lower overall survival compared to those treated in compliance.
Prostate cancer is one of the most-studied tumor sites for IOV assessment [Citation12]. Numerous publications exist on prostate and rectum IOV quantification [Citation4,Citation13,Citation14], their variation with imaging modality [Citation15,Citation16], and their reduction with clinical interventions [Citation17–19]. The literature is relatively sparse, however, with regard to structures such as the pelvic lymph node (PLN) CTV and penile bulb [Citation20–22], and relatively few studies report on the dosimetric impact of IOV [Citation21,Citation23–25]. Moreover, there is a lack of studies quantifying IOV in actual clinical practice [Citation26], as conventional IOV research usually involves multiple observers contouring the same dataset of images in a supervised and controlled setting [Citation12]. With increasing efforts to standardize and structure radiotherapy data for big data initiatives [Citation27,Citation28], there is not only a rising need for standardized data organization, but also for structure delineation in order to assure high-quality comparable data sets [Citation29].
Contouring IOV has long been regarded as comprising two parts: a random component encompassing intra-observer variations that average out in large datasets, and a systematic component encompassing individual observer biases that persists [Citation6]. Based on this, we hypothesized that systematic IOV can be detected in clinical practice using the contours of a population of preexisting treatment plans. In the work described herein, we tested our hypothesis and showed it to be true by introducing a patterns-of-practice analysis methodology. We also demonstrated the dosimetric effects of contouring IOV and showed how our methodology can guide an intervention to reduce IOV and its dosimetric consequences in clinical practice.
Methods
Clinical context
For this study, we examined contouring IOV for a well-established hypofractionated prostate cancer treatment protocol at our center [Citation30]. The protocol prescribes 60 Gy in 20 fractions and has two variations: prostate irradiation alone for moderate-risk patients, and prostate plus nodal irradiation for high-risk patients, both of which are examined in this work. At our center, four radiation oncologists (ROs) who specialize in genitourinary malignancies treat prostate cancer patients with a varying workload.
To begin, patients are imaged with a 3 mm slice thickness helical 120 kV, 300 mAs CT scan with an empty rectum and comfortably full bladder. OAR and CTV structures are then contoured. Institutional guidelines require that the whole rectum, bladder, femoral heads, and penile bulb are delineated according to the Radiation Therapy Oncology Group (RTOG) guidelines for a normal male pelvis [Citation31] in addition to the prostate and PLN CTVs as appropriate. Prostate and PLN PTVs comprise their respective CTV volumes plus a 7.0 mm isotropic expansion margin. At our center, any structures drawn by professionals other than the primary RO require the RO’s approval or adjustment before dose calculation.
All patients on the protocol are treated using a 7-field 6 MV IMRT technique requiring minimum PTV coverage of V95%≥prescription dose (60 Gy for prostate targets, 44 Gy for lymph nodes), as previously reported [Citation30]. Planning constraints differ slightly between risk groups in order to account for the PLN PTV in high-risk patients and are shown in . At our institution, treatment planning is undertaken by a team of dosimetrists and plans are assigned to dosimetrists on a first-come-first-served basis without regard to the treating RO.
Table 1. Planning constraints for the hypofractionated prostate radiotherapy protocol at our institution.
Patient selection
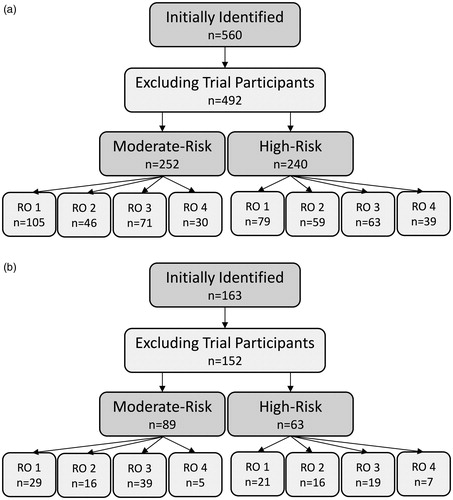
Patients included in our retrospective patterns-of-practice study were treated between October 2009 and March 2018. Eligible patients were those treated using one of the two hypofractionation protocols described above and not enrolled in a clinical trial (in case they were planned differently from local convention). Four hundred and ninety-two patients met these criteria. We stratified these patients based on risk (to account for dosimetric differences between moderate and high-risk plans), and further stratified them based on primary RO in order to test our hypothesis. A detailed breakdown of the cohort is presented in .
Figure 1. (a) Distribution of patients in the retrospective cohort used for this study, stratified based on risk and primary radiation oncologist. (b) Distribution of patients in the post-intervention cohort, as described in section ‘Intervention’.
Data collection and statistical analysis
Structure names, volumes, lengths (defined here as the extent of the structure along the craniocaudal axis), and dose-volume histograms (DVHs) were collected from the Eclipse treatment planning system (Varian Medical Systems, Palo Alto, CA, USA) using a custom script written in the Eclipse Scripting API and stored in a local MySQL database. Structures were re-labeled with standard, TG-263-compliant [Citation27], identifiers to facilitate aggregation.
The possibility of bias existing in the assignment of patients based on risk to different oncologists was assessed using a Chi-square test. Systematic IOV between oncologists was assessed by comparing structure volumes, lengths, and certain clinically relevant DVH points. No reference oncologist was selected. Instead, each individual oncologist was compared to the group of their peers using two-tailed t-tests. Patient risk level was also investigated as a potential confounding factor in the contouring habits of the oncologists. Statistical significance was defined as p < .0125 when comparing interobserver variations (Bonferroni’s correction, n = 4), and p < .05 when comparing intraobserver variations (moderate versus high risk and pre versus post intervention).
Intervention
Following our retrospective study, our ROs met and were asked to reach a consensus on contouring practice standardization based on the results of our analyses. To assess the impact of this intervention, a second, post-intervention group of patients treated between May 2018 and May 2019 was identified using the same selection criteria as before. The composition of this post-intervention group is presented in . Reduction of IOV was assessed on a structure-by-structure basis with F-tests comparing the overall variance in contour volumes and lengths between the pre- and post-intervention cohorts.
Results
Target contouring IOV
Pre-intervention, significant variability in the contouring of target volumes was detected for both prostate and PLN CTV structures (). As evident in ,for both targets, the most prominent inter-observer disagreement was attributable to a single RO (RO 3) delineating significantly smaller target volumes than their peers. On average, this oncologist’s prostate volumes were smaller than the group mean by 20% (p=.002) and PLN volumes were smaller by 38% (p < .001). We also observed that although most oncologists contoured prostate volumes consistently across patient risk level, RO 3 delineated significantly smaller prostate volumes for their high-risk patients when compared to their moderate-risk ones (p=.034, ).
Figure 2. Mean structure volumes and lengths (with standard uncertainty of the mean) for (a, b) prostate and (c, d) PLN CTVs, stratified by RO and risk level. Initial and post-intervention cohorts are presented together for comparison. (e) Examples of representative mean PLN structures drawn by each RO in the retrospective cohort. (f) Examples of representative PLN contours drawn by RO 4 and RO 3 in the post-intervention cohort. Differences are indicated with arrows and structure limits with bounding boxes.
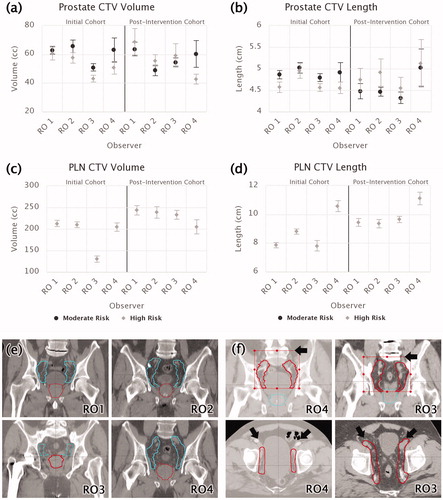
While no significant variation in prostate CTV length was observed between oncologists or across risk levels, there was a high degree of variability in PLN lengths (defined for high-risk patients only, p≤.003). As shown in ,observers fell into three categories. ROs 1 and 3 had the smallest mean PLN length (7.8 cm), RO 4 the largest (10.6 cm), and RO 2 in-between (8.8 cm). Based on visual inspection (), these differences in PLN CTV contour lengths were found to be predominantly related to differing superior limits of the PLN targets. As per the Chi-square test, no significant relationship between patient risk level and primary oncologist was observed (p=.08).
OAR contouring IOV
Inter-observer variability in the OAR contours was less pronounced than for the targets (). No significant variations were found for the bladder or femoral head structures of either risk level. While no variations in rectal volume existed, significant rectum length variations were observed in the high-risk cohort. One observer (RO 4) drew significantly shorter rectums than their peers and another (RO 3) drew significantly longer ones (p≤.001, ). Additionally, RO 3 was found to draw significantly longer rectums on average when treating high-risk patients compared to moderate-risk patients (11 cm compared to 10.25 cm, p=.02).
Figure 3. Mean contour volumes and lengths by radiation oncologist (RO) and risk level for the rectum (a, b), bladder (c, d), and penile bulb (e, f) structures. Error bars indicate standard uncertainty of the mean. Initial and post-intervention cohorts are presented together for comparison.
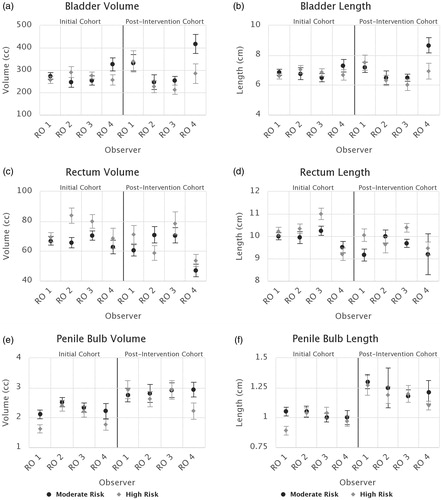
The only other significant instances of OAR contouring IOV detected in our cohort were variations in the penile bulb volumes and lengths of high-risk patients. Two oncologists (ROs 1 and 4) drew significantly smaller volumes on average (p=.009) than their peers (). RO 1 was also found to have different penile bulb contouring practices for the different risk levels, drawing smaller volumes and lengths for high-risk patients than for moderate-risk (p=.02, .004).
Dosimetric variations
The impact of systematic contouring IOV on planned dose to delineated structures was assessed by comparing the mean DVHs of the various structures of interest between oncologists. While no statistically significant DVH variations were found for the targets, there were significant variations in mean DVHs of the OARs.
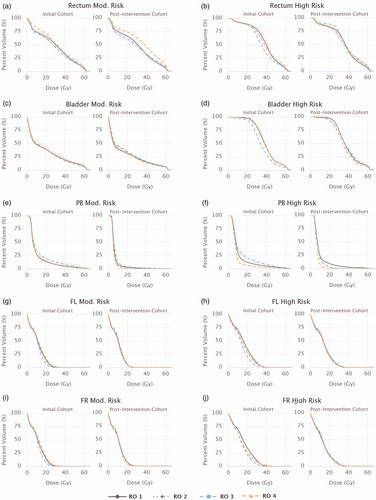
presents the mean DVHs for each oncologist for the rectum, bladder, penile bulb, and femoral head structures. Significantly lower mean DVHs were observed for several OARs for the oncologist previously observed to have drawn smaller target volumes (RO 3). For this oncologist, for both risk cohorts, the mean V25Gy for both femoral heads was at least half that of the group mean (p≤.011). In the high-risk cohort, the mean rectum and bladder DVHs for this oncologist were both significantly lower than their peers across the majority of the DVH range examined (p≤.002). For the remaining moderate-risk OARs (rectum, bladder, and penile bulb), no oncologists emerged as outliers, though some minor peer-to-peer variations did exist for certain DVHs parameters for the rectum and bladder.
Figure 4. Mean DVHs for each radiation oncologist (RO) for the rectum (a, b), bladder (c, d), penile bulb (e, f), and femoral head (g–j) structures of the initial and post-intervention studies. DVHs are separated based on patient risk levels.
Impact of intervention
Following review of the preceding IOV results, participating oncologists agreed to adopt the RTOG PLN target volume definition and more stringent adherence to RTOG OAR definitions [Citation31]. The impact of this decision on clinical practice was subsequently evaluated by reviewing plans created in the following year.
While the variance in prostate sizes did not decrease by a significant degree, no significant prostate contouring variations persisted post-intervention. The previously non-conforming oncologist (RO 3) increased their mean prostate volume for both risk levels to a sufficient degree that they no longer differed from their peers (). In contrast, variance in PLN volumes and lengths significantly reduced by 44% and 72%, respectively (p=.005, p < .001), due to all observers except RO 4 significantly increasing contour volumes and lengths (p < .05) to meet the new guidelines. However, RO 4 was observed to delineate significantly larger PLN CTV lengths (p < .001) after the intervention. This discrepancy may have been due to either uncancelled random variations in the data due to a low sample size for this oncologist, or a tendency to draw the superior limit closer to the L4 vertebrae instead of L5, as shown in .
As shown in ,OAR contouring consensus overall increased in the post-intervention cohort. Variance of rectal volumes and lengths greatly reduced post-intervention (p < .008), leading to no significant IOV between oncologists. Consistency of femoral head contouring increased, with variance in contour lengths decreasing by at least 50% (p < .001). No significant changes in the variance of bladder or penile bulb sizes were observed, however, observers did increase mean penile bulb volumes and lengths compared to the pre-intervention period (ROs 1 and 3 significantly so).
All significant dosimetric variations suspected to be related to target contouring discrepancies (lower femoral head, rectum, and bladder DVHs for high-risk patients, and lower femoral head DVHs for moderate-risk patients) were not present in the post-intervention cohort (). Overall, the only significant dosimetric variation that existed post-intervention was a higher mean rectum DVH for RO 4’s moderate-risk patients, which may have been related to a lower mean rectum volume.
Discussion
Conventional IOV studies typically utilize image datasets contoured by multiple observers to quantify variability in structure delineation. Although popular, this approach is not practical for regular assessment of IOV in real-world practice due to the large time and resource commitment required of clinicians. Here, we present the first study, to our knowledge, that assesses contouring IOV and its dosimetric consequences in routine clinical practice, using a methodology that does not create additional workload for clinicians.
Using retrospective data, we were able to detect significant systematic IOV in prostate and PLN structure delineation and show these variations influenced the planned dose distributions for various OARs. Specifically, our data showed reduced rectum and bladder DVHs were associated with smaller PLN CTV volumes, and reduced femoral head DVHs with smaller prostate volumes. These results are in line with other reports of the impact of target contouring on OAR dose [Citation25,Citation32,Citation33].
Our work also relates to and expands upon a recent study from the HYPRO trial [Citation34]. Using an analysis method similar to our own, Wortel et al. confirmed the existence of prostate contouring IOV between different participating institutions with known protocol variations and showed that these variations influenced anorectal dose and toxicity incidence in patients. In this work, we have gone further and demonstrated that population-based analysis approaches are not only capable of confirming, but detecting IOV at a single institution level in routine clinical practice. Our analysis also extends to and demonstrates applicability for all relevant targets and OARs, not just prostate and rectum.
We are also, to our knowledge, the first group to report any instances of prostate cancer OAR delineation varying based on patient risk levels, possibly because most investigations tend to look at observer factors rather than patient ones [Citation35,Citation36]. Delineation of smaller penile bulbs in high-risk patients may have been related to subjective adjustments in prostate apex delineation [Citation15,Citation23] based on increased risk, and increased high-risk rectal lengths possibly due to the presence of the nearby PLN CTV.
Based on the results of our initial analysis, we implemented a consensus-meeting type intervention at our institution that reduced the interobserver variance of PLN, rectum, and femoral head contouring significantly, as well as prostate contouring to a lesser degree. In general, most interventions to reduce contouring IOV in the literature are successful in some regard, although some more so than others [Citation37]. Our findings are consistent with other studies that have shown that consensus interventions increase contouring consistency, particularly for challenging target structures [Citation38,Citation39].
While our methodology was able to identify systematic IOV, it is important to recognize the assumption it is founded upon and scenarios where it may not always apply. In order for this methodology to work, the dataset used must be sufficiently large so that the random IOV component averages out and the systematic IOV component persists. When small sample sizes, like those of RO 4 in the post-intervention cohort, are used, this assumption may not hold and erroneous results may occur due to non-cancelled random effects. In the case of our work, while we can still point to physical examples of how RO 4 differed from their peers, we cannot say definitively if the significant results from our statistical tests were due to IOV alone, or IOV and random variations. This also raises the importance of considering other sources of variation besides contouring when interpreting results. While not found to be an issue in our study, observer expertise or frequency at treating different risk-levels patients could influence contouring practices. Likewise, although the assignment of dosimetrists, who may have planning optimization biases, to treatment plans at our institution is assumed to be independent of treating oncologist, we did not test this assumption and it may not be applicable to other institutions, representing a limitation of our method. A more universally relevant source of additional variability in delineated structure size and shape that is especially important for bladder and rectum structures is organ filling. As filling may also have random and systematic variations, it is entirely possible that significant variations detected with our methodology could reflect filling differences rather than IOV. For this reason, we advise other researchers using population-based approaches like our own to account for factors like those suggested in their own studies when interpreting results, and, where possible, give more weight to results that use metrics less sensitive to these factors (such rectal length in the context of filling variations).
Conclusion
We have demonstrated that systematic inter-observer contouring bias is detectable in large datasets whereas random variations cancel out. Through a patterns-of-practice based approach, we were able to detect IOVs in target delineation that influenced the calculated dose to nearby OAR structures and used this information to guide changes to clinical practice that improved inter-observer contouring agreement.
Disclosure statement
No potential conflict of interest was reported by the author(s).
References
- Vorwerk H, Beckmann G, Bremer M, et al. The delineation of target volumes for radiotherapy of lung cancer patients. Radiother Oncol. 2009;91(3):455–460.
- Coles CE, Hoole ACF, Harden SV, et al. Quantitative assessment of inter-clinician variability of target volume delineation for medulloblastoma: quality assurance for the SIOP PNET 4 trial protocol. Radiother Oncol. 2003;69(2):189–194.
- Nelms BE, Tomé WA, Robinson G, et al. Variations in the contouring of organs at risk: test case from a patient with oropharyngeal cancer. Int J Radiat Oncol Biol Phys. 2012;82(1):368–378.
- Seddon B, Bidmead M, Wilson J, et al. Target volume definition in conformal radiotherapy for prostate cancer: quality assurance in the MRC RT-01 trial. Radiother Oncol. 2000;56(1):73–83.
- Li XA, Tai A, Arthur DW, et al. Variability of target and normal structure delineation for breast cancer radiotherapy: an RTOG Multi-Institutional and Multiobserver Study. Int J Radiat Oncol Biol Phys. 2009;73(3):944–951.
- Weiss E, Hess CF. The impact of gross tumor volume (GTV) and clinical target volume (CTV) definition on the total accuracy in radiotherapy theoretical aspects and practical experiences. Strahlenther Onkol. 2003;179(1):21–30.
- Njeh CF. Tumor delineation: the weakest link in the search for accuracy in radiotherapy. J Med Phys. 2008;33(4):136–140.
- Jameson MG, Kumar S, Vinod SK, et al. Correlation of contouring variation with modeled outcome for conformal non-small cell lung cancer radiotherapy. Radiother Oncol. 2014;112(3):332–336.
- Peters LJ, O'Sullivan B, Giralt J, et al. Critical impact of radiotherapy protocol compliance and quality in the treatment of advanced head and neck cancer: results from TROG 02.02. J Clin Oncol. 2010;28(18):2996–3001.
- Crane CH, Winter K, Regine WF, et al. Phase II study of bevacizumab with concurrent capecitabine and radiation followed by maintenance gemcitabine and bevacizumab for locally advanced pancreatic cancer: Radiation Therapy Oncology Group RTOG 0411. J Clin Oncol. 2009;27(25):4096–4102.
- Zhong H, Wang J, van Soest J, et al. The evidence driven dosimetric constraints from outcome analysis of H&N patients’ data from NRG Oncology RTOG 0522 Trial. Int J Radiat Oncol Biol Phys. 2017;99(2):S137.
- Jameson MG, Holloway LC, Vial PJ, et al. A review of methods of analysis in contouring studies for radiation oncology. J Med Imaging Radiat Oncol. 2010;54(5):401–410.
- Roach D, Holloway LC, Jameson MG, et al. Multi-observer contouring of male pelvic anatomy: highly variable agreement across conventional and emerging structures of interest. J Med Imaging Radiat Oncol. 2019;63(2):264–271.
- Nyholm T, Jonsson J, Söderström K, et al. Variability in prostate and seminal vesicle delineations defined on magnetic resonance images, a multi-observer, -center and -sequence study . Radiat Oncol. 2013;8(1):126.
- Villeirs GM, Van Vaerenbergh K, Vakaet L, et al. Interobserver delineation variation using CT versus combined CT + MRI in intensity-modulated radiotherapy for prostate cancer. Strahlenther Onkol. 2005;181(7):424–430.
- Choi HJ, Kim YS, Lee SH, et al. Inter- and intra-observer variability in contouring of the prostate gland on planning computed tomography and cone beam computed tomography. Acta Oncol. 2011;50(4):539–546.
- Szumacher E, Harnett N, Warner S, et al. Effectiveness of educational intervention on the congruence of prostate and rectal contouring as compared with a gold standard in three-dimensional radiotherapy for prostate. Int J Radiat Oncol Biol Phys. 2010;76(2):379–385.
- Khoo EL, Schick K, Plank AW, et al. Prostate contouring variation: can it be fixed? Int J Radiat Oncol Biol Phys. 2012;82(5):1923–1929.
- Breunig J, Hernandez S, Lin J, et al. A system for continual quality improvement of normal tissue delineation for radiation therapy treatment planning. Int J Radiat Oncol Biol Phys. 2012;83(5):e703–e708.
- Lawton CA, Michalski J, El-Naqa I, et al. Variation in the definition of clinical target volumes for pelvic nodal conformal radiation therapy for prostate cancer. Int J Radiat Oncol Biol Phys. 2009;74(2):377–382.
- Perna L, Cozzarini C, Maggiulli E, et al. Inter-observer variability in contouring the penile bulb on CT images for prostate cancer treatment planning. Radiat Oncol. 2011;6:123.
- Carillo V, Cozzarini C, Perna L, et al. Contouring variability of the penile bulb on CT images: quantitative assessment using a generalized concordance index. Int J Radiat Oncol Biol Phys. 2012;84(3):841–846.
- Livsey JE, Wylie JP, Swindell R, et al. Do differences in target volume definition in prostate cancer lead to clinically relevant differences in normal tissue toxicity? Int J Radiat Oncol Biol Phys. 2004;60(4):1076–1081.
- Foppiano F, Fiorino C, Frezza G, et al. The impact of contouring uncertainty on rectal 3D dose-volume data: results of a dummy run in a multicenter trial (AIROPROS01-02). Int J Radiat Oncol Biol Phys. 2003;57(2):573–579.
- Rasch C, Remeijer P, Koper PC, et al. Comparison of prostate cancer treatment in two institutions: a quality control study. Int J Radiat Oncol Biol Phys. 1999;45(4):1055–1062.
- Cacicedo J, Navarro-Martin A, Gonzalez-Larragan S, et al. Systematic review of educational interventions to improve contouring in radiotherapy. Radiother Oncol. 2020;144:86–92.
- Mayo CS, Moran JM, Bosch W, et al. American Association of Physicists in Medicine Task Group 263: standardizing nomenclatures in radiation oncology. Int J Radiat Oncol Biol Phys. 2018;100(4):1057–1066.
- Mayo CS, Kessler ML, Eisbruch A, et al. The big data effort in radiation oncology: data mining or data farming? Adv Radiat Oncol. 2016;1(4):260–271.
- Traverso A, Kazmierski M, Welch ML, et al. Sensitivity of radiomic features to interobserver variability and image pre-processing in apparent diffusion coefficient (ADC) maps of cervix cancer patients. Radiother Oncol. 2020;143:88–94.
- Barbosa Neto O, Souhami L, Faria S. Hypofractionated radiation therapy for prostate cancer: the McGill University Health Center experience. Cancer Radiother. 2015;19(6–7):431–436.
- Gay HA, Barthold HJ, O’Meara E, et al. Pelvic normal tissue contouring guidelines for radiation therapy: a radiation therapy oncology group consensus panel atlas. Int J Radiat Oncol Biol Phys. 2012;83(3):1–86.
- Myrehaug S, Chan G, Craig T, et al. A treatment planning and acute toxicity comparison of two pelvic nodal volume delineation techniques and delivery comparison of intensity-modulated radiotherapy versus volumetric modulated arc therapy for hypofractionated high-risk prostate cancer radiotherapy. Int J Radiat Oncol Biol Phys. 2012;82(4):e657–e662.
- Fiorino C, Reni M, Bolognesi A, et al. Intra- and inter-observer variability in contouring prostate and seminal vesicles: implications for conformal treatment planning. Radiother Oncol. 1998;47(3):285–292.
- Wortel RC, Heemsbergen WD, Smeenk RJ, et al. Local protocol variations for image guided radiation therapy in the multicenter Dutch hypofractionation (HYPRO) trial: impact of rectal balloon and MRI delineation on anorectal dose and gastrointestinal toxicity levels. Int J Radiat Oncol Biol Phys. 2017;99(5):1243–1252.
- Ost P, De Meerleer G, Vercauteren T, et al. Delineation of the postprostatectomy prostate bed using computed tomography: interobserver variability following the EORTC delineation guidelines. Int J Radiat Oncol Biol Phys. 2011;81(3):e143–e149.
- Stanley J, Dunscombe P, Lau H, et al. The effect of contouring variability on dosimetric parameters for brain metastases treated with stereotactic radiosurgery. Int J Radiat Oncol Biol Phys. 2013;87(5):924–931.
- Vinod SK, Min M, Jameson MG, et al. A review of interventions to reduce inter-observer variability in volume delineation in radiation oncology. J Med Imaging Radiat Oncol. 2016;60(3):393–406.
- Nijkamp J, de Haas-Kock DFM, Beukema JC, et al. Target volume delineation variation in radiotherapy for early stage rectal cancer in the Netherlands. Radiother Oncol. 2012;102(1):14–21.
- Lobefalo F, Bignardi M, Reggiori G, et al. Dosimetric impact of inter-observer variability for 3D conformal radiotherapy and volumetric modulated arc therapy: the rectal tumor target definition case. Radiat Oncol. 2013;8(1):176.