
 ?Mathematical formulae have been encoded as MathML and are displayed in this HTML version using MathJax in order to improve their display. Uncheck the box to turn MathJax off. This feature requires Javascript. Click on a formula to zoom.
Abstract
Purpose
To evaluate the LETd-weighted biological dose to OARs in proton therapy for breast cancer and to study the relationship of the LETd-weighted biological dose relative to the standard dose (RBE = 1.1) and thereby to provide estimations of the biological dose uncertainties with the standard dose calculations (RBE = 1.1) commonly used in clinical practice.
Method
This study included 20 patients who received IMPT treatment to the whole breast/chest wall and regional lymph nodes. The LETd distributions were calculated along with the physical dose using an open-source Monte Carlo simulation package, MCsquare. Using the McMahon linear model, the LETd-weighted biological dose was computed from the physical dose and LETd. OAR doses were compared between the Dose (RBE = 1.1) and the LETd-weighted biological dose, on brachial plexus, rib, heart, esophagus, and Ipsilateral lung.
Results
On average, the LETd-weighted biological dose compared to the Dose (RBE = 1.1) was higher by 8% for the brachial plexus D0.1 cc, 13% for the ribs D0.5 cc, 24% for mean heart dose, and 10% for the esophagus D0.1 cc, respectively. The LETd-weighted doses to the Ipsilateral lung V5, V10, and V20 were comparable to the Dose (RBE = 1.1). No statistically significant difference in biological dose enhancement to OARs was observed between the intact breast group and the CW group, with the exception of the ribs: the CW group experienced slightly greater biological dose enhancement (13% vs. 12%, p = 0.04) to the ribs than the intact breast group.
Conclusion
Enhanced biological dose was observed compared to standard dose with assumed RBE of 1.1 for the heart, ribs, esophagus, and brachial plexus in breast/CW and regional nodal IMPT plans. Variable RBE models should be considered in the evaluation of the IMPT breast plans, especially for OARs located near the end of range of a proton beam. Clinical outcome studies are needed to validate model predictions for clinical toxicities.
Introduction
The proton relative biological effectiveness (RBE) is the ratio of absorbed doses of 60Co radiation and proton radiation that produces the same biologic effect. A constant RBE of 1.1, based on in vivo and in vitro measurements, is conservatively used for treatment planning with proton therapy to ensure that an adequate dose is delivered to the tumor [Citation1]. However, the slowing down of protons with increasing depth in a pristine Bragg curve results in increasing linear energy transfer (LET). The increase in LET with depth causes two effects: (1) an increase in the RBE at the distal end of the proton range [Citation2–6] and (2) a shift of the biologically effective range by ∼2mm [Citation7].
Recently, the use of proton therapy for the treatment of breast cancer has been dramatically increasing [Citation8,Citation9], because of the sharp dose falloff beyond the target and consequent sparing of underlying organs-at-risk (OAR) such as heart and lung [Citation10–14]. However, in those studies and in most clinical practices, the enhanced RBE effect at the distal edge of the pristine peak is not taken into account. The increased LET and RBE at the end of the range may be of concern for critical structures immediately beyond the target area. In very recent years, the variable RBE is increasingly recognized as an important factor that might ultimately affect clinical outcomes in patients who have undergone proton therapy [Citation15–20]. Current understanding of the relationship between radiation dose and normal tissue effects is derived from the clinical outcomes with photon therapy. Therefore, to avoid unanticipated normal tissue effects with proton therapy, it is essential to account for a correct variable RBE. However, in routine clinical practice, the constant RBE of 1.1 is used for optimizing and evaluating treatment plans. RBE-weighted biological dose evaluation is not readily available in the commercial treatment planning systems (TPS). As a result, the routinely used and reported doses from the proton literature may not reflect true biological doses; potential biologic dose hot spots may not be appreciated in the treatment planning and plan evaluation process and, hence we may not be optimizing proton therapy to its full potential of target coverage and OAR avoidance.
So far, a systematic study of the biological dose relative to the standard dose (RBE = 1.1) to OARs in breast IMPT has not been thoroughly reported. Using an open-source Monte Carlo (MC) simulation package, MCsquare [Citation21,Citation22], we adopted a recent published dose-averaged linear energy transfer (LETd)-based biological dose model to calculate voxel-by-voxel LETd-weighted biological doses in a series of IMPT plans for breast cancer treatment. The purposes of this study are 1) to evaluate the LETd-weighted biological dose of the OARs for proton therapy in breast cancer treatment, and 2) to study the relationship between LETd-weighted biological dose and standard dose calculations using a constant RBE of 1.1 and thereby provide estimations of the biological dose uncertainties in common clinical practice.
Method and materials
Patient selection and treatment planning
This study included 20 (10 post-mastectomy and 10 post-lumpectomy) patients treated from 2018 to 2019 who provided informed consent for our institutional review board (IRB# 201702651) approved outcome tracking protocol. All patients received intensity-modulated proton therapy (IMPT) to the regional nodes and either whole breast or chest wall (CW).
The patient simulation and treatment planning techniques have been described in a previous publication [Citation23]. Briefly, patients were simulated in the supine position with arms above the head. Treatment planning was conducted on a RayStation TPS (RaySearch Laboratories, Sweden) using the MC dose algorithm. The dose prescription was 50 Gy (RBE = 1.1) in 25 fractions. Two slightly anterior oblique en-face beam angles were used. Robust optimization was performed on clinical target volume (CTV) structure with 5 mm setup uncertainty and 3.5% range uncertainty. The target coverage of V95% ≥ 95% and D95% ≥ 95% was regarded as ideal, but V90% ≥ 90% and D90% ≥ 90 was accepted. The doses to the OARs were evaluated using our institutional evaluation matrices as shown in . In addition, the D0.5 cc dose to the ribs was also evaluated as the rib fracture predictive parameter [Citation24,Citation25]. The ribs were not contoured at the time of treatment planning and no rib constraint was used for these patients.
Table 1. The OAR dose evaluation matrices.
Validation of the MCsquare Monte Carlo simulation
In the current study, MCsquare [Citation21,Citation22] was used to calculated the Dose (RBE = 1.1) and LETd. MCsquare is an established open-source Monte Carlo simulation engine previously reported with promising dose calculation accuracy for clinical use [Citation26–28]. In our institute, MCsquare was commissioned and validated for our proton beam delivery system and the detailed commissioning and validation results were submitted for a separate publication. For the current study, additional validation was performed by comparing the MCsquare simulation results with the well-benchmarked RayStation MC calculations on the studied 20 patients using the patient CT geometry, applying a constant RBE value of 1.1 to both. 3D gamma analysis with 3%/3 mm and 2%/2 mm criteria was conducted to compare these two dose calculation systems and to validate MCsquare.
Calculation of LETd-weighted dose
LETd distributions and the physical dose distribution on a voxel-by-voxel basis was simulated by MCsquare. The primary protons, nuclear interactions, secondary protons, secondary deuterons and secondary alphas were simulated in MCsquare to score LETd. For each voxel of the computer tomography (CT) data set, the LETd-weighted biological dose was then computed from physical dose and LETd, using the linear model published by McMahon et al. [Citation29], as described in EquationEquation (1)(1)
(1) .
(1)
(1)
where 0.055 is the empirical fitting parameter with units of μm/KeV.
Results
Validation of the MCsquare simulation on the 20 patients
Supplementary Table S1 shows the 3D gamma analysis results comparing the MCsquare simulations and the RayStation TPS calculations. Excellent 3D gamma passing rates were achieved, with median (range) values of 99.9% (98.5−100%) and 97.6% (93.3−98.8%) for 3%/3 mm and 2%/2 mm criteria, respectively. The minimal differences could be attributable to intrinsic differences between the two MC algorithms and material handling methods. In order to make a fair comparison for the LETd-weight dose and the standard dose (RBE = 1.1), throughout the remainder of the study, the standard dose (RBE = 1.1) from the MCsquare simulation was used to compare with the LETd-weighted biological dose that was calculated from the MCsquare simulated physical dose and LETd.
The LETd-weighted biological dose to the OARs
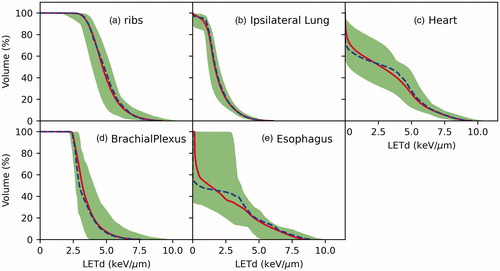
shows the color-wash isodose distribution of a representative breast patient planned with the (a) RayStation Dose(RBE = 1.1), (b) MCsqsuare Dose(RBE = 1.1), and (c) LETd-weighted dose. The color-washed LETd is displayed in panel (d). The dose and LETd profiles are displayed in panel (e). The DVH is shown in panel (f). For an intact breast, our treatment plan spares the first 5 mm inside the skin. Then the dose reaches the 50 Gy prescription dose to the target. In the target region, the LETd started with approximately 2 KeV/µm and gradually increased with the depth. The maximum LETd reached >5 KeV/μm a few millimeters beyond the target. As a result, a 2-3mm range extension and an enhanced biological dose at the end of the range were observed. A noticeable increase in target dose (LETd) was also observed in the distal portion of the breast. Our focus of the current study is on the biological dose to the OARs. The LETd volume histograms for all 20 patients are plotted in . Inter-patient LETd variations were observed, in which the variations were smaller on ribs and lung than on other structures. This was unsurprising since en-face beams were used for planning and, therefore, the ribs and lung were directly downstream of the breast target, which can result in relatively similar spot placements around these two structures across different patients.
Figure 1. The color-washed isodose distribution of a representative breast patient planned with (a) RayStation Dose(RBE = 1.1), (b) MCsquare Dose(RBE = 1.1), and (c) LETd-weighted dose. The beam angles of 355 and 325 degrees for this plan are indicated in panel (a). The color-washed LETd is displayed in panel (d). The red contour is the target volume. The dose profiles of the MCsquare Dose(REB = 1.1), the LETd-weighted dose, and the LETd are displayed in panel (e) and the profile line is indicated in panel (d). The DVH is shown in panel (f).
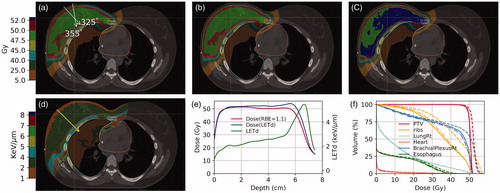
Figure 2. LETd volume histograms on OARs for all 20 patients. The blue and red line represent the population median and mean values, respectively. The shaded bands represent the range of the variation within the 20 patients.
shows the box plot of the ratio of the Dose(LETd)/Dose(RBE = 1.1). With the exception of the ipsilateral lung for which the Dose(LETd) was almost identical to Dose(RBE = 1.1), all OARs had a greater than 1 Dose(LETd)/Dose(RBE = 1.1) ratio, indicating a higher LETd-weighted dose than the standard Dose (RBE = 1.1). Although the magnitude of the Dose(LETd)/Dose(RBE = 1.1) ratio varies among patients, an increased LETd-weighted dose was observed across all the patients. The median (range) and mean (SD) of OAR doses are summarized in . The patients were also divided into two groups – the breast patient group (n = 10) and the CW patient group (n = 10) – to assess for a difference in the RBE dose enhancement between these two groups. No statistically significant difference was observed between the intact breast group and the CW group, except for the rib dose. The CW group experienced a slightly greater (13% vs. 12%, p = 0.04) biological dose enhancement in the ribs than the intact breast group patients. This can be explained by the target delineation, for which the pectoral muscle is typically included in the CTV for post-mastectomy radiation but not for intact breast radiation (except in cases of advanced T stage disease). Although the difference on the rib RBE dose enhancement between these two groups is statistical significant, the magnitude of 1% difference is unlikely to be clinical significant.
Figure 3. Box plot of the ratio of the Dose(LETd) over the Dose(RBE = 1.1).
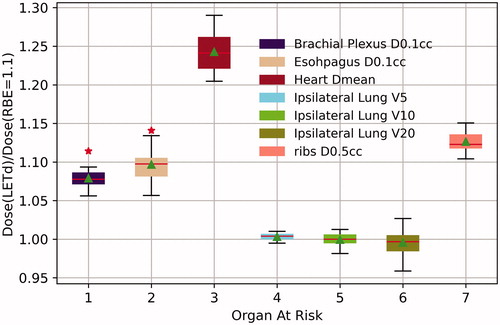
Table 2. The median (range) and mean (SD) of the OAR dose.
On average, compared to the standard dose (RBE = 1.1), the LETd-weighted dose was 8% higher in the 0.1 cc brachial plexus, 13% higher in the ribs, 10% higher in the esophagus, and 24% higher in mean heart dose. As one would expect, the heart dose to the left-sided patients (n = 8) was found to be higher than that for the overall patients (1.8 Gy vs. 1.3 Gy). However, the ratio of the Dose(LETd) over the Dose(RBE = 1.1) was about the same for left-sided patients as that for the overall patients. For ipsilateral lung, the LETd-weighted dose was the same as that with a constant RBE of 1.1. Because our treatment planning procedures sparing of the OARs as much as achievable while maintaining target coverage, although an increased LETd-weighted biological dose was observed for most of the OARs, the plans of all 20 patients met our institutional dose limitation criteria except for two cases. In both cases the OAR of concern was the esophagus. In Patient #10, the esophagus D0.1 cc was 48.2 Gy (RBE = 1.1), well within our dose limitation of 52.5 Gy, but the LETd-weighted dose increased to 53.0 Gy, resulting in a minor deviation. In Patient #19, the esophagus dose was 50.1 Gy (RBE = 1.1), also within the planning constraint, but the LETd-weighted dose of 55.2 Gy just exceeded the limit of 55 Gy, resulting in a major deviation per our institutional evaluation criteria. In both cases, the area of esophagus of concern was immediately adjacent to the CTV for the supraclavicular fossa lymph nodes (SCV).
Discussion
Although greater than 1.1 RBE at the end of the range have been reported in previous studies, a constant RBE of 1.1 is commonly used in the proton clinic. With the current clinical treatment planning and evaluation practice, the enhanced RBE at the end of the range is not taken into account. The dose estimated on a TPS in the area affected by this end of range effect is likely an underestimation of the biological dose. The increase in LET and RBE at the Bragg peak and distal falloff is concerning, as it typically occurs in normal tissue [Citation30]. A plan optimized and evaluated based on a validated RBE model would be ideal. However, current RBE models are lack of clinical validation. Therefore, caution must be exercised when using a RBE model for plan optimization because of the RBE uncertainties. A recently published AAPM Task Group Report-256 concluded the treatment optimization based on biological dose is currently not feasible with acceptable uncertainties, but it recommended to develop clinical tools to evaluate LETd or RBE doses [Citation31]. Incorporation of variable RBE in plan evaluation could reduce treatment uncertainties and potentially identify unintended high biological doses in OARs, thereby averting unexpected adverse events. Many different proton RBE models based on LET and the α/β of the linear-quadratic model have been proposed for biological dose calculation [Citation30,Citation32–37]. In the current study, we adopted a linear model that was recently published by McMahon et al. [Citation29]. In the McMahon model, the coefficient was obtained by fitting the clonogenic cell survival data. This RBE-LETd metric was then evaluated on SOBP using RBE-weighted doses based on experimentally-determined parameters using the published empirical model for AGO-1522 and U87 cells. The model was further evaluated on clinical cases (one medulloblastoma and one prostate) using the previously published phenomenological McNamara model [Citation36] and found to achieve less than 1% biological uncertainty across the whole dose range in each plan [Citation29]. Therefore, although it is not a full RBE model, this simplified metric can be used to account for the majority of variability which arises from the LET-dependence of RBE [Citation29]. It needs to be noted that although uncertainties exist in RBE modeling, the LETd is a physical quantity that can be accurately predicted by Monte Carlo simulations [Citation38]. Studies have shown LETd can potentially link the physical and biologic doses [Citation39,Citation40]. In the current study, we evaluated the LETd-weighted dose to critical OARs for breast IMPT treatment. compares the current study’s results with previous relevant publications. The details will be discussed in the following paragraphs.
The heart dose and the resulting side effects have been a major concern for radiation treatment to the breast and regional lymph nodes. Darby et al. [Citation41] reported that the rate of major coronary events was 7.4% per Gy, with no apparent threshold. Proton therapy has the advantage of reducing heart dose owning the rapid dose falloff of protons. Dosimetric studies [Citation10,Citation11,Citation13] have demonstrated superior dose-sparing to the heart for proton therapy compared to photon therapy. However, the variable RBE was not considered in these studies. The heart is located immediately beyond the internal mammary nodes (IMN) CTV. Therefore, the areas of high LETd and RBE may fall in the heart. In the current study, we found that for the mean heart dose, the biological dose, on average, is 24% higher than that assumed with treatment plans using a constant RBE of 1.1. Therefore, the LETd should be considered when evaluating plans, and the cardiac biological hot spot should be avoided, maximizing the organ sparing potential of proton therapy.
The ribs comprise another structure that lay immediately beyond the target volume. The risk of a radiation-induced rib fracture following standard whole breast radiation with photon therapy is between 0.3 and 1.8% [Citation42]. Recently, Wang et al. [Citation20] reported the incidence rib fracture with proton therapy to reach 7%, suggesting this may be caused by the increased RBE at the distal edge of proton beams. In their study, the dose was converted to the biological effective dose (BED) with an α/β ratio of 3 and they found an approximately 20% increase in the LETd-weighted dose. In the current study, we observed an increase of 13%, which is equivalent to an approximately 18% increase when converted to the BED using the same equation as Wang et al. for the LETd-weighted biological dose.
Brachial plexopathy is an uncommon, late toxicity of radiotherapy for breast cancer. The brachial plexus courses through the SCV and axillary CTVs, in the flat region of the physical dose profile. In our study, the LETd in the brachial plexus was approximately 3.5KeV/μm, which led to an LET-weighted dose 8% higher than the standard dose (RBE = 1.1). Mutter et al. [Citation19] conducted a prospective study of 56 breast IMPT patients, focused on the brachial plexus biological dose. In their study, the patients were grouped into two groups – cohort A to whom no brachial plexus dose constraint was applied and cohort B to whom a maximum brachial plexus dose constraint was applied during plan optimization. They converted the dose to 2 Gy equivalent dose (EQD2) assuming an α/β ratio of 2 and found a 15.3% (111 Gy vs. 128 Gy) and a 12.6% (103 Gy vs. 116 Gy) higher biological dose than the Dose(RBE = 1.1) in the 0.01 cc brachial plexus for cohort A and cohort B, respectively. In our study cohort, a max dose constraint was applied to the brachial plexus during plan optimization. We found that Dose(RBE = 1.1) vs. Dose(LETd) in the 0.1 cc brachial plexus was 49.8 Gy vs. 53.8 Gy, corresponding to 49.7 Gy vs. 55.8 Gy EQD2 . Therefore, in our study cohort, when converted to EQD2, the LETd-weighted biological dose was 12.3% higher than the Dose(RBE = 1.1) in 0.1 cc brachial plexus, comparable to the study by Mutter et al. [Citation19]
One of the known side effects of radiation treatment to the breast cancer is radiation-induced pneumonitis [Citation43]. Typically, there is 5−15 mm of non-target tissue between the posterior edge of the CTV and the anterior edge of lung. Not surprising, the LETd-weighted biological doses for lung V20, V10, and V5 were similar to the standard doses using a constant RBE 1.1. Similar findings, i.e. no difference between the biological dose and the Dose(RBE = 1.1) in the ipsilateral lung V20, was reported in the previous breast IMPT study [Citation19].
Part of the esophagus is in very close proximity to the SCV CTV, and dose to the esophagus can result in temporary esophagitis. The D0.1 cc esophagus was 10% higher with the LETd-weighted biological dose compared to the standard dose calculated using a constant RBE of 1.1. In the studied cohort, we have observed two cases for which the Dose(RBE = 1.1) met the evaluation criteria, but the LETd-weighted biological dose exceeded the dose limitation.
The use of IMPT for breast cancer offers better skin-sparing than the passive scattered proton therapy but adds another layer of complexity; the region of increased LET is not as predictable compared to passive scattered proton therapy [Citation44]. In order to better take advantage of the IMPT, it is important to understand and account for the variable RBE on a voxel-by-voxel basis of the CT data set. In the current study, we incorporated the LET-weighted biological dose in the evaluation of breast IMPT plans and found that the LETd values can be > 5 KeV/μm in the distal falloff. The high LETd led to enhanced biological dose to the OARs, which may result in an unacceptable biological hotspot to the critical structures, not predicted by the current commercial TPS using a constant RBE = 1.1. Using a 20-patient cohort, our study results provide a spectrum of clinical breast IMPT cases in which the LETd-weighted biological dose were compared against standard dose calculations using a constant RBE of 1.1. These results will provide critical information to clinicians on areas of biological dose uncertainty and potential biologic hot spots that could result in unanticipated OAR effects.
Similar to any other biological dose studies, one limitation of the current study is the uncertainties associated with the RBE model. RBE varies with LETd, dose, (α/β)x, biological endpoint, and intrinsic radiosensitivity of the tissue [Citation37,Citation45–48]. Comparative studies [Citation37,Citation45,Citation46] on RBE models observed significant variations on the estimated RBE among different models. The largest variation in the estimated RBE was found in the region with low physical doses, high LETd values, and low (α/β)x values. The greatest inter-model variations in RBE values ranged from 1.0 to 1.9 for clinical plans in the study by Rørvik et al. [Citation46], in which eleven phenomenological RBE models and two plan-based RBE models were extensively compared. Therefore, when applying RBE models in dosimetric studies, the uncertainties of the RBE models should be considered. However, despite these uncertainties, studies [Citation39,Citation49] have shown that the use of a variable RBE could help to further optimize and evaluate the proton plans. In this study, we studied the LETd-weighted dose calculated based on the McMahon model. Although there is no published report that compared the estimation from the McMahon model with the phenomenological models, the work by Rørvik [Citation46] shows that the LETd-weighted dose calculated by the Unkelbach model predicted lower biological doses compared to the phenomenological models. However, one should not translate this to our results that based on the McMahon model. Notably, the Unkelbach model coefficient was obtained by normalizing the generic SOBP to 1.1 as it was created for LET optimization rather than an accurate RBE model [Citation39]. In contrast, the McMahon model used in the current study was fit to experimental cell survival data and hence should be closer to the phenomenological model predictions. The greater fitting coefficient of the McMahon model (0.055 KeV/μm) compared with the Unkelbach model (0.04 keV/μm) indirectly proved this. Nevertheless, the LETd-weighted dose used in the current study is a simplified metric for evaluating the biological effect. Furthermore, inter-patient variations in LETd and RBE dose were observed in this study, as previously shown by the other studies [Citation50,Citation51].
Conclusion
This study found increases in LET-weighted dose compared to that of the assumed constant RBE of 1.1 for the heart, ribs, esophagus, and brachial plexus in regional node and breast or CW IMPT treatment. The biological dose enhancement to the OARs should not be ignored in the treatment plan evaluation, especially for OARs located near the end of range for a proton beam. Further validation of these findings with clinical outcomes are needed.
Supplemental Material
Download MS Word (18.6 KB)Acknowledgments
We would like to thank Jessica Kirwan for editorial assistance.
Disclosure statement
No potential conflict of interest was reported by the author(s).
Additional information
Funding
References
- Paganetti H, Niemierko A, Ancukiewicz M, et al. Relative biological effectiveness (RBE) values for proton beam therapy. Int J Radiat Oncol Biol Phys. 2002;53(2):407–421.
- Courdi A, Brassart N, Herault J, et al. The depth-dependent radiation response of human melanoma cells exposed to 65 MeV protons. Br J Radiol. 1994;67(800):800–804.
- Wouters BG, Lam GK, Oelfke U, et al. Measurements of relative biological effectiveness of the 70 MeV proton beam at TRIUMF using Chinese hamster V79 cells and the high-precision cell sorter assay. Radiat Res. 1996;146(2):159–170.
- Coutrakon G, Cortese J, Ghebremedhin A, et al. Microdosimetry spectra of the Loma Linda proton beam and relative biological effectiveness comparisons. Med Phys. 1997;24(9):1499–1506.
- Cuaron JJ, Chang C, Lovelock M, et al. Exponential increase in relative biological effectiveness along distal edge of a proton bragg peak as measured by deoxyribonucleic acid double-strand breaks. Int J Radiat Oncol Biol Phys. 2016;95(1):62–69.
- Howard ME, Beltran C, Anderson S, et al. Investigating dependencies of relative biological effectiveness for proton therapy in cancer cells. Int J Part Ther Winter. 2018;4(3):12–22.
- Paganetti H, Goitein M. Radiobiological significance of beamline dependent proton energy distributions in a spread-out Bragg peak. Med Phys. 2000;27(5):1119–1126.
- Kammerer E, Guevelou JL, Chaikh A, et al. Proton therapy for locally advanced breast cancer: a systematic review of the literature. Cancer Treat Rev. 2018;63:19–27.
- Hug EB. Proton therapy for primary breast cancer. Breast Care. 2018;13(3):168–172.
- MacDonald SM, Patel SA, Hickey S, et al. Proton therapy for breast cancer after mastectomy: early outcomes of a prospective clinical trial. Int J Radiat Oncol Biol Phys. 2013;86(3):484–490.
- Xu N, Ho MW, Li Z, et al. Can proton therapy improve the therapeutic ratio in breast cancer patients at risk for nodal disease? Am J Clin Oncol. 2014;37(6):568–574.
- Cuaron JJ, Chon B, Tsai H, et al. Early toxicity in patients treated with postoperative proton therapy for locally advanced breast cancer. Int J Radiat Oncol Biol Phys. 2015;92(2):284–291.
- Bradley JA, Dagan R, Ho MW, et al. Initial report of a prospective dosimetric and clinical feasibility trial demonstrates the potential of protons to increase the therapeutic ratio in breast cancer compared with photons. Int J Radiat Oncol Biol Phys. 2016;95(1):411–421.
- Braunstein LZ, Cahlon O. Potential morbidity reduction with proton radiation therapy for breast cancer. Semin Radiat Oncol. 2018;28(2):138–149.
- Indelicato DJ, Flampouri S, Rotondo RL, et al. Incidence and dosimetric parameters of pediatric brainstem toxicity following proton therapy. Acta Oncol. 2014;53(10):1298–1304.
- Underwood T, Paganetti H. Variable proton relative biological effectiveness: how do we move forward? Int J Radiat Oncol Biol Phys. 2016;95(1):56–58.
- Peeler CR, Mirkovic D, Titt U, et al. Clinical evidence of variable proton biological effectiveness in pediatric patients treated for ependymoma. Radiother Oncol. 2016;121(3):395–401.
- Underwood TSA, Grassberger C, Bass R, et al. Asymptomatic late-phase radiographic changes among chest-wall patients are associated with a proton RBE exceeding 1.1. Int J Radiat Oncol Biol Phys. 2018;101(4):809–819.
- Mutter RW, Jethwa KR, Wan Chan Tseung HS, et al. Incorporation of biologic response variance modeling into the clinic: limiting risk of brachial plexopathy and other late effects of breast cancer proton beam therapy. Pract Radiat Oncol. 2020;10(2):e71–e81.
- Wang CC, McNamara AL, Shin J, et al. End-of-range radiobiological effect on rib fractures in patients receiving proton therapy for breast cancer. Int J Radiat Oncol Biol Phys. 2020;107(3):449–454.
- Souris K, Lee JA, Sterpin E. Fast multipurpose Monte Carlo simulation for proton therapy using multi- and many-core CPU architectures. Med Phys. 2016;43(4):1700
- Wagenaar D, Tran LT, Meijers A, et al. Validation of linear energy transfer computed in a Monte Carlo dose engine of a commercial treatment planning system. Phys Med Biol. 2020;65(2):025006.
- Liang X, Mailhot Vega RB, Li Z, et al. Dosimetric consequences of image guidance techniques on robust optimized intensity-modulated proton therapy for treatment of breast cancer. Radiat Oncol. 2020;15(1):47.
- Miura H, Inoue T, Shiomi H, et al. Differences in rates of radiation-induced true and false rib fractures after stereotactic body radiation therapy for Stage I primary lung cancer. J Radiat Res. 2015;56(2):332–337.
- Taremi M, Hope A, Lindsay P, et al. Predictors of radiotherapy induced bone injury (RIBI) after stereotactic lung radiotherapy. Radiat Oncol. 2012;7(1):159.
- Sorriaux J, Testa M, Paganetti H, et al. Experimental assessment of proton dose calculation accuracy in inhomogeneous media. Phys Med. 2017;38:10–15.
- Huang S, Souris K, Li S, et al. Validation and application of a fast Monte Carlo algorithm for assessing the clinical impact of approximations in analytical dose calculations for pencil beam scanning proton therapy. Med Phys. 2018;45(12):5631–5642.
- Deng W, Younkin JE, Souris K, et al. Technical note: integrating an open source Monte Carlo code "MCsquare" for clinical use in intensity-modulated proton therapy. Med Phys. 2020;47(6):2558–2574.
- McMahon SJ, Paganetti H, Prise KM. LET-weighted doses effectively reduce biological variability in proton radiotherapy planning. Phys Med Biol. 2018;63(22):225009.
- Carabe A, Moteabbed M, Depauw N, et al. Range uncertainty in proton therapy due to variable biological effectiveness. Phys Med Biol. 2012;57(5):1159–1172.
- Paganetti H, Blakely E, Carabe-Fernandez A, et al. Report of the AAPM TG-256 on the relative biological effectiveness of proton beams in radiation therapy. Med Phys. 2019;46(3):e53–e78.
- Carabe-Fernandez A, Dale RG, Jones B. The incorporation of the concept of minimum RBE (RbEmin) into the linear-quadratic model and the potential for improved radiobiological analysis of high-LET treatments. Int J Radiat Biol. 2007;83(1):27–39.
- Elsasser T, Weyrather WK, Friedrich T, et al. Quantification of the relative biological effectiveness for ion beam radiotherapy: direct experimental comparison of proton and carbon ion beams and a novel approach for treatment planning. Int J Radiat Oncol Biol Phys. 2010;78(4):1177–1183.
- Friedrich T, Scholz U, Elsasser T, et al. Calculation of the biological effects of ion beams based on the microscopic spatial damage distribution pattern. Int J Radiat Biol. 2012;88(1–2):103–107.
- Wedenberg M, Lind BK, Hardemark B. A model for the relative biological effectiveness of protons: the tissue specific parameter alpha/beta of photons is a predictor for the sensitivity to LET changes. Acta Oncol. 2013;52(3):580–588.
- McNamara AL, Schuemann J, Paganetti H. A phenomenological relative biological effectiveness (RBE) model for proton therapy based on all published in vitro cell survival data. Phys Med Biol. 2015;60(21):8399–8416.
- Rørvik E, Thörnqvist S, Stokkevåg CH, et. al. A phenomenological biological dose model for proton therapy based on linear energy transfer spectra. Med Phys. 2017;44(6):2586–2594.
- Grassberger C, Paganetti H. Elevated LET components in clinical proton beams. Phys Med Biol. 2011;56(20):6677–6691.
- Unkelbach J, Botas P, Giantsoudi D, et al. Reoptimization of intensity modulated proton therapy plans based on linear energy transfer. Int J Radiat Oncol Biol Phys. 2016;96(5):1097–1106.
- Unkelbach J, Paganetti H. Robust proton treatment planning: physical and biological optimization. Semin Radiat Oncol. 2018;28(2):88–96.
- Darby SC, Ewertz M, McGale P, et al. Risk of ischemic heart disease in women after radiotherapy for breast cancer. N Engl J Med. 2013;368(11):987–998.
- Meric F, Buchholz TA, Mirza NQ, et al. Long-term complications associated with breast-conservation surgery and radiotherapy. Ann Surg Oncol. 2002;9(6):543–549.
- Omarini C, Thanopoulou E, Johnston SR. Pneumonitis and pulmonary fibrosis associated with breast cancer treatments. Breast Cancer Res Treat. 2014;146(2):245–258.
- Woodward WA, Amos RA. Proton radiation biology considerations for radiation oncologists. Int J Radiat Oncol Biol Phys. 2016;95(1):59–61.
- Giovannini G, Böhlen T, Cabal G, et al. Variable RBE in proton therapy: comparison of different model predictions and their influence on clinical-like scenarios. Radiat Oncol. 2016;11:68.
- Rørvik E, Fjaera LF, Dahle TJ, et al. Exploration and application of phenomenological RBE models for proton therapy. Phys Med Biol. 2018;63(18):185013.
- Paganetti H. Proton relative biological effectiveness – uncertainties and opportunities. Int J Part Ther. 2018;5(1):2–14.
- Paganetti H. Relative biological effectiveness (RBE) values for proton beam therapy. Variations as a function of biological endpoint, dose, and linear energy transfer. Phys Med Biol. 2014;59(22):R419–72.
- Ödén J, Eriksson K, Toma-Dasu I. Incorporation of relative biological effectiveness uncertainties into proton plan robustness evaluation. Acta Oncol. 2017;56(6):769–778.
- Ytre-Hauge KS, Fjaera LF, Rørvik E, et al. Inter-patient variations in relative biological effectiveness for cranio-spinal irradiation with protons. Sci Rep. 2020;10(1):6212.
- Yepes P, Adair A, Frank SJ, et al. Fixed- versus variable-RBE computations for intensity modulated proton therapy. Adv Radiat Oncol. 2019;4(1):156–167.