
 ?Mathematical formulae have been encoded as MathML and are displayed in this HTML version using MathJax in order to improve their display. Uncheck the box to turn MathJax off. This feature requires Javascript. Click on a formula to zoom.
Abstract
Introduction
Liver cancers are challenging to treat using image-guided radiotherapy (IGRT) due to motion and deformation of target volumes and organs at risk (OARs), as well as difficulties in visualising liver tumours using cone-beam computed tomography (CBCT) based IGRT. Liver cancer patients may thus benefit from magnetic resonance (MR)-guided daily adaptive re-planning. We evaluated the dosimetric impact of a daily plan adaptation strategy based on daily MR imaging versus CBCT-based IGRT.
Methods
Ten patients were studied who were treated with CBCT-guided five-fraction stereotactic body radiotherapy (SBRT) and underwent MR imaging before each fraction. Simulated reference plans were created on computer tomography (CT) images and adapted plans were created on the daily MR images. Two plan adaptation strategies were retrospectively simulated: (1) translational couch shifts to match liver, mimicking standard CBCT guidance and (2) daily plan adaptation based on reference plan clinical goals and daily target and OAR contours. Dose statistics were calculated for both strategies and compared.
Results
Couch shifts resulted in an average reduction in GTV D99% relative to reference plan values of 5.2 Gy (−12.5% of reference values). Daily plan adaptation reduced this to 0.8 Gy (−2.0%). For six patients who were OAR dose-limited on reference plans, couch shifts resulted in OAR dose violations in 28 out of 28 simulated fractions, respectively; no violations occurred using daily plan adaptation. No OAR dose violations occurred using either strategy for the four cases not OAR dose-limited at reference planning.
Conclusions
MR-guided daily plan adaptation ensured OAR dose constraints were met at all simulated treatment fractions while CBCT-based IGRT resulted in a systematic over-dosing of OARs in patients whose doses were limited by OAR dose at the time of reference planning.
Introduction
The integration of MR scanners into radiation treatment delivery systems promises to have a comparable impact on radiotherapy as did the introduction of CBCT imaging nearly two decades ago [Citation1]. CBCT ushered in a new era of high-precision radiotherapy by providing volumetric imaging in the treatment position. It is limited, however, by low contrast-to-noise, making it difficult to visualise target lesions and to accurately delineate OARs using this modality. Integrated MR scanners and linear accelerators (‘MR-linacs’) mitigate this shortcoming and open the door to adapting radiotherapy plans based on daily target and OAR contours while the patient is on the treatment couch. In the future, it may be possible to improve the therapeutic ratio by delivering higher doses to the tumour when OAR anatomy is favourable, and lower doses when OAR doses are not favourable.
Due to its superior soft-tissue contrast, MR-guided radiotherapy is ideally suited to tumour sites where it is difficult to visualise lesions on CBCT and where there is significant anatomic deformation. In these cases, standard CBCT-based image guidance may lead to a geometric target miss if the target has moved with respect to anatomic landmarks and an overdose of OARs if they have moved into high-dose regions.
One such site is liver, which is highly deformable [Citation2–4] and is surrounded by mobile luminal OARs: stomach, duodenum, and bowel, in particular. Méndez Romero et al. used daily CTs acquired during liver SBRT to estimate dose variations when translational couch shifts were used to accommodate tumour displacements [Citation2]. Averaged over three SBRT fractions, variations between planned and delivered OAR doses were < 1 Gy. Velec et al. used deformable image registration between planning CTs and daily CBCTs to estimate the impact of breathing motion, setup variation and anatomy changes on accumulated target and OAR doses, finding that 70% of patients had a > 5% variation in accumulated doses relative to the planned doses, including both OAR and GTV dose metrics [Citation3]. The observed variations, however, resulted in a reduction in OAR doses in approximately half the patients. Leinders and collaborators used CTs acquired before each fraction of a three-fraction liver SBRT regimen to estimate the dosimetric impact of adaptive replanning at each fraction to accommodate anatomy changes versus couch shifts to cover targets. Using couch shifts, OAR dose violations between 1 and 6 Gy per fraction occurred in half the cases studied in at least one of the fractions [Citation5]. When averaged over three fractions, however, the cumulative OAR dose violations were again largely eliminated.
Schmid et al. studied OAR dose constraint violations in liver SBRT patients when the reference plan was applied to daily CT images (with appropriate couch shifts) [Citation6]. Estimated maximum doses (D5cc) delivered to 5 cubic centimetres (cc) of OARs ranged between 50% and 150% of planned values [Citation2,Citation5,Citation6]. Henke and collaborators compared couch shifts to daily adaptive planning for patients with abdominal malignancies (including ten liver patients) undergoing SBRT with daily MR guidance on the ViewRay MRIdian system [Citation7]. Using an isotoxicity planning approach, they found OAR dose violations using a couch shift strategy in 36% of delivered liver fractions, with inter-fraction variations in OAR D0.5cc up to 20 Gy per fraction (scaled to three fractions) using couch shifts. It was not clear, however, what the residual dose variation was for each patient when averaging over all fractions.
These works have established that couch-shift image guidance consistently leads to a difference between planned and delivered doses to OARs and, to a lesser extent, targets at each treatment fraction. It is not yet clear whether these variations diminish substantially when averaged over the entire course of SBRT, however, or whether there is a cohort of patients for whom OARs are consistently over-dosed for a majority of fractions. The purpose of this study was to evaluate inter-fraction dose variations between couch-shift and adaptive replanning strategies as well as variations in the minimum straight-line (‘Euclidean’) distance between targets and OARs to clarify these issues and potentially identify such a cohort who might particularly benefit from daily MR-guided plan adaptation.
Methods
Patients and imaging
This study was approved by our institutional research ethics board and written consent was obtained from all patients. Ten patients undergoing liver SBRT on a standard linac (without onboard MR imaging) were imaged on each day of five-fraction liver SBRT on an MR scanner in addition to standard-of-care imaging: contrast-enhanced simulation CT and MRI to generate reference treatment plans and CBCT for daily image guidance.
MR imaging consisted of T1- and T2-weighted navigator-triggered exhale breath-hold (NTEBH) acquisitions on a 3 Tesla scanner (Magnetom Verio, Siemens, Erlangen, Germany). Axial slice thickness was 5 mm; spacing between slices varied from 6.5 and 7.8 mm; all imaging was performed with a 240 × 320 acquisition matrix, corresponding to in-plane pixel sizes between 1.125 mm and 1.375 mm. CT simulation images used for reference plans were exhale breath-hold helical scans acquired during arterial phase enhancement (Big Bore, Philips, Eindhoven, Netherlands). Slice thickness was 2 mm; pixel sizes varied between 0.88 mm and 1.03 mm. This simulated a clinical workflow in which patients are subject to gated delivery during the exhale breathing phase, as determined by navigator-triggered MR imaging. Although at present we are treating patients at out institution during free breathing on the Elekta Unity system, online adapted plans are generated on NTEBH T2 images and cine-MR images are acquired continuously during treatment to ensure the lesion remains localised within the PTV.
Contours and geometric properties
Large bowel, small bowel, duodenum, stomach, oesophagus, kidneys, spinal canal, and liver were contoured on CT-simulation images to generate reference plans as well as on the daily T2 MR images. To reduce the effects of inter-observer target contouring variability on daily MR, gross tumour volumes (GTVs) were contoured manually by consensus between two radiation oncologists on all data sets, using the reference CT GTV contour propagated by biomechanical deformable image registration (DIR) [Citation8,Citation9] (RayStation 6 RaySearch Laboratories, Sweden) of the liver between data sets as a guide to reduce the impact of contouring variations. To assess contouring variability, the Dice coefficient, equal to twice the volume of intersection between the DIR-propagated GTV and the contoured GTV divided by the sum of their volumes, was calculated for GTV contours at all fractions. Minimum Euclidean distances (MEDs) between GTVs and OARs were calculated in RayStation and used to interpret OAR dose results. MED is defined as the minimum three-dimensional straight-line distance between points on the surfaces of the GTV and OARs.
Simulated reference and daily adapted planning
Reference and daily plans were created in the Monaco treatment planning system (Monaco 5.19.4, Elekta Oncology). Intensity-modulated radiotherapy (IMRT) plans were generated using seven or eight flattening-filter-free photon beams of nominal peak energy 7 MV. To simulate treatment on a Unity MR-linac, dose was calculated using a Monte Carlo dose engine with a 1.5 Tesla magnetic field. Dose calculations on MR images were carried out using bulk-density assignments, with a relative electron density (tissue-to-water) override of one for non-lung tissue; 0.3 was assigned to lung tissue on all image sets. To remove the influence of bulk-density assignment on our results, this approach was also used for the CT-simulation images on which reference plans were created. Estimates of the impact of this approximation are given in the Supplementary Materials.
Reference plans were generated on CT images for all patients using a PTV margin of 5 mm. OAR dose constraints followed RTOG 1112 guidelines for hepatocellular carcinoma; see Supplementary Materials Table 1. For cases that were limited by OAR constraints on reference planning, plans were generated to maximise the dose to 95% of the PTV (D95%), subject to OAR dose constraints; in all cases that were limited by luminal OARs, doses to limiting OARs were within 10 cGy of these constraints. The non-OAR dose-limited cases were planned with a nominal prescription dose of 50 Gy (i.e. PTV D95% 50 Gy; range: 51–53 Gy). Patients limited by non-GTV liver dose were planned with a nominal prescription dose of 40 Gy.
For the simulated translation couch shift plans, rigid registrations between the reference CT plan and daily MR images were established by manually matching the livers in the region of the lesion, mimicking our standard-of-care CBCT-based IGRT for liver cancers [Citation10]. Lesions were visible on all MR images and registrations were adjusted, if necessary, to ensure that GTV contours from the planning image set overlapped with the lesions at all simulated fractions. Reference plans (beams, segments, and segment weights) were copied to daily MR images using rigid registration, and the dose was calculated without additional modification.
For the adaptive re-plans based on anatomy-of-the-day (‘online adaptation plans’), the reference plans were copied from reference to daily images and re-optimised in accordance with the optimisation objectives of the reference plan. This workflow is equivalent to a variant of ‘Adapt to shape’ implemented in the clinical version of the Monaco treatment planning system for the Elekta Unity MR-linac [Citation11]. As with the reference plans, PTV D95% was maximised subject to saturation of OAR dose constraints for OAR dose-limited cases (isotoxic planning); for non-OAR dose-limited cases, plans were optimised to ensure PTV D95% 50 Gy, up to D95% = 55 Gy.
GTV D99%, mean GTV dose, PTV D95%, D0.5 cc for luminal OARs, and non-GTV mean liver dose were calculated for all reference and adapted plans for both couch-shift and online adapted plans. Differences between adapted and planned doses were quantified by ΔD99% ≡ D99%(average over daily plan values scaled for five fractions) – D99%(reference plan) for the GTV and equivalently for PTV D95% (ΔD95%), mean GTV dose (ΔDmean), and OARs (ΔD0.5 cc).
Results
Patients
Ten patients were included in this study: nine had hepatocellular carcinoma (HCC) and one patient received SBRT for a liver metastasis. Five patients had multiple lesions; for the purpose of our study, a single lesion was selected for the simulated plans, generally the largest lesion or the one closest to OARs. In terms of reference treatment planning, six patients had dose-limiting luminal OARs, one patient’s treatment plan was limited by non-GTV liver dose, and three patients were planned with a nominal prescription dose of 50 Gy. Planning details for each patient are shown in . For the six luminal OAR dose-limited cases, mean reference plan PTV D95% was 38.2 Gy (range: 32.8−57.1).
Table 1. Properties of each simulated patient used in our study: lesion volume, dose-limiting OARs (bold font indicates an OAR that was dose-limiting on the reference plan and which remained dose-limiting for all fractions; italicized font indicates an OAR that was dose-limiting on 3 or fewer fractions; no OARs were dose limited for 4 out of 5 fractions), and reference plan PTV prescriptions.
Seven patients completed all five pre-SBRT MR images. Liver lesions are hyperintense on T2 and so this was chosen as our planning data set. For three patients, T2 images were acquired for four of five fractions. In total, there were ten reference CT and 47 daily T2 MR images included.
Dose escalation was not routinely feasible using the online adaptation strategy
Out of 28 OAR dose-limited fractions, in only one fraction was it possible to increase GTV D99% by more than 1 Gy. For the most part, GTV D99% was reduced as compared to the reference plan, due to less favourable daily anatomy (). Even for the two cases (patients 6 and 8 in ) where the large bowel was displaced from the vicinity of the GTV, other adjacent dose-limiting OARs precluded dose escalation.
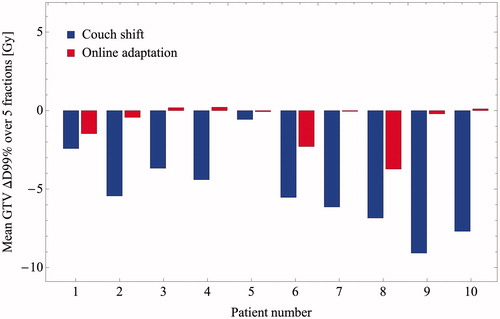
Figure 1. Differences in daily GTV doses minus reference doses using the simulated couch shift IGRT (blue bars) and online adaptation (red bars) for each simulated patient. Height of the bars indicates the mean difference in GTV D99% (daily D99% minus its value on the reference plan, scaled to five fractions), over all simulated fractions for each patient.
Target coverage was compromised using couch shifts
Mean ΔD99% in GTV dose amongst all ten patients was −5.2 Gy (range: −9.1 Gy to −0.6 Gy). Using online adaptation, the corresponding value was −0.8 Gy (range: −3.7 Gy to 0.2 Gy). Mean GTV ΔDmean was −0.6 Gy (range: −1.02 Gy to 1.07 Gy) and 0.9 Gy (range: −0.6 Gy to 4.0 Gy) using couch shifts and online adaptation, respectively. Mean PTV ΔD95% was −5.3 Gy (range: −11.5 Gy to 0.6 Gy) and −1.0 Gy (range: −3.4 Gy to 0.6 Gy) using couch shifts and online adaptation, respectively.
Luminal organs-at-risk doses were routinely overdosed using couch shifts
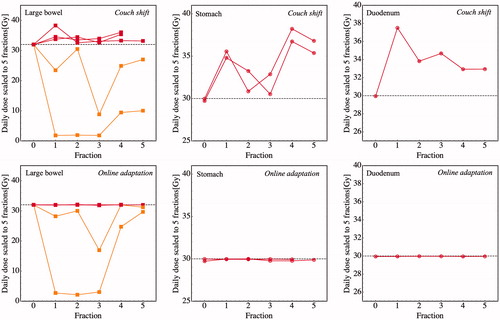
For the 28 simulated fractions corresponding to the six cases that were OAR dose-limited on the reference plan, all 28 exhibited OAR dose constraint violations using the couch-shift plans. For the five cases that were limited by large bowel on the reference plan, ΔD0.5 cc was 2.6, 2.1, −27.0, −9.0 and 2.1 Gy, respectively. For the two cases that were limited by stomach on the reference plan, ΔD0.5 cc was 4.9 and 4.4 Gy; for the single duodenum-limited case, ΔD0.5 cc was 4.4 Gy. Apart from the two large bowel-limited cases in which D0.5 cc dropped by −27.0 Gy and −9.0 Gy, all daily OAR D0.5 cc values increased from their reference plan values using the couch-shift adaptation; see . Using the isotoxic online adaptation, ΔD0.5 cc was < 10 cGy for all reference plan dose-limiting OARs.
Figure 2. Couch shift IGRT leads to a consistent over-dosing of OARs that are dose-limiting on the reference plan. Top: from left to right, daily D0.5 cc to large bowel, stomach, and duodenum for each of the (n = 5, 2, 1, respectively) cases where those organs were dose-limiting on the reference plan (“Fraction 0”). Horizontal dashed lines indicate OAR D0.5 cc dose constraints (32 Gy, 30 Gy, and 30 Gy, respectively). Red lines indicate OARs that are dose-limiting on all fractions, as per . With the exception of the two cases that were limited by the hepatic flexure of the large bowel (shown in orange), D0.5 cc exceeded the reference plan values for all fractions when using couch-shift adaptation. Bottom: Online adaptation ensures that dose constraints are satisfied for all fractions.
Luminal organs-at-risk that were in contact with the target at the time of reference planning tended to remain in contact throughout treatment
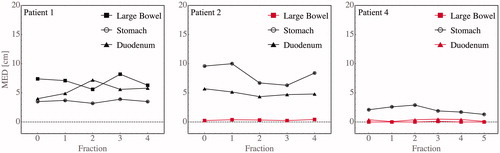
For the six patients listed in whose doses were limited by luminal OARs on reference plans, the MED between the GTVs and dose-limiting OARs was less than 0.4 cm for the eight luminal OARs listed in the right-most column of . The MED remained less than 0.4 cm for all imaged fractions for six out of eight of these organs. Examples are shown in . In two cases, large bowel was in contact with the target on the reference plan but moved away on subsequent fractions (see Supplementary Materials Figure 2).
Figure 3. Targets that are in contact with OARs on reference imaging tend to remain in contact, accounting for the consistent OAR violations for almost all fractions. Shown are the minimum Euclidean distance (MED) between the GTV and three luminal OARs (large bowel, stomach, and duodenum) at each fraction for three example patients (1, 2, and 4, respectively). Red indicates organs that are dose-limiting.
Discussion
This retrospective planning study evaluated the impact of daily MR-guided plan adaptation on target and OAR doses compared with a standard image-guidance workflow that uses translational couch shifts to match to the daily liver position. For the six out of ten cases that were OAR dose-limited on the reference plan, couch-shifts resulted in OAR dose violations at every simulated fraction (28 of 28). By design, isotoxic daily plan adaptation ensured zero OAR dose violations for all fractions.
These results demonstrate that there are patients for whom OARs are consistently over-dosed relative to reference planning using couch-shift image guidance and for whom daily OAR variances do not average to zero over the course of treatment. Luminal OARs generally limit the target doses when they are in direct contact with the target. We observed that in these cases, the luminal organs mostly remained in contact with the target despite substantial inter-fraction anatomic deformation (). Apart from two exceptions shown in Supplementary Material Figure 2, the minimum Euclidean distance between GTVs and dose-limiting OARs remained < 0.4 cm throughout all simulated fractions. Furthermore, couch shift-type IGRT strategies aim to put the lesion in the path of the beams, a systematic effect that ensured that OARs abutting the target remained proximal to the beams for all treatment fractions. On the reference plan, the IMRT dose distribution was designed to just avoid the OARs while ensuring target coverage. Because the beams remained close to the OARs, almost any geometric change—either liver or OAR anatomical deformation—resulted in some of the high-dose region covering the target on the reference plan being placed on the OARs ().
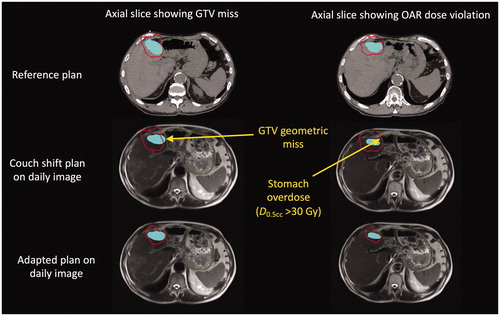
Figure 4. Anatomical deformation of the liver in a single patient between the reference plan and representative treatment fraction (third) leads to geometric target miss and OAR overdose in different regions. Top: two different axial slices of the reference CT image showing the 32 Gy isodose line (stomach dose constraint) conforming to the interface between the stomach (green contour) and GTV (blue shaded region). Middle/bottom: The same axial slices on the daily MR acquired at the third SBRT fraction, as determined by rigid registration showing the 32 Gy isodose line for the “couch shift” (middle) and adapted (bottom) plans. Because the interface is deformed (along with the daily re-contoured GTV), the couch shift results in a simultaneous geometric miss (left middle) as well as an OAR overdose (right middle).
A limitation of our geometric analysis was the 5 mm axial MRI slice thickness. This did not affect the estimated MED when the lesions are close to the OAR (< 0.4 cm), since in these cases, the lesions and OARs would be closest in the same MRI slice. Estimated MED values > 0.5 cm on the other hand have a potential inaccuracy bounded from above by this axial thickness.
In two cases where the large bowel was dose-limiting on the reference plan but not on subsequent fractions, it was because the hepatic flexure was located between the liver and the stomach at the time of reference planning and the targets were likewise in contact with the stomach (see the example case in Supplementary Materials Figure 2). Changes to the gastric filling of the stomach at subsequent fractions resulted in the large bowel being pushed inferiorly out of the high-dose region (Supplementary Materials Figure 2(b,c)). There was no possibility of dose escalation in these cases, however, because the stomach remained in contact with the target for all fractions.
Target coverage was consistently reduced using a couch-shift strategy. These reductions were due in part to our planning approach, which placed a substantial dose gradient near the edge of the PTV and hence, GTV, of up to 2 Gy per mm, in order to maximise target dose while sparing OARs. As a result, a geometric change in the GTV that resulted in a shift of e.g. a 1 cc portion of a 100 cc tumour by 1 mm away from the high-dose region would result in a reduction in D99% by several Gy (5–10% of the prescription dose), consistent with our results. Volumetric dose objectives such as V99%—the volume of the tumour receiving at least 99% of the prescription dose—would show smaller reductions [Citation5,Citation7,Citation12]; for this example, on the order of 1%.
In contrast to GTV D99% and PTV D95%, differences between planned and adapted values of mean GTV dose were less than 1 Gy for both strategies. The greater sensitivity of GTV D99% and PTV D95% to geometric errors as compared to mean doses can be understood using geometric arguments: it can be shown that ΔD95%/99% scales as the dose gradient multiplied by the translational shift error, whereas ΔDmean scales as the dose gradient multiplied by the square of the shift error, divided by the tumour diameter. The latter is always smaller as long as the error is smaller than the tumour size.
Changes to the GTV contour as described above can result from anatomic deformation, tumour growth or reduction, contouring variability, the 5 mm axial thickness of the MR slices, and variations in exhale breath-hold acquisitions amongst MR images and between CT and MRI. Méndez Romero et al. [Citation2] and Leinders et al. [Citation5] rigidly copied target volumes from the planning CT to daily CT images, and so were not sensitive to these effects. Velec et al. used targets that were propagated using deformable image registration (DIR) of the liver [Citation3], in principle isolating the effect of anatomic deformation of the liver. The reduction in minimum dose to 0.5 cc of the GTV (accumulated couch-shift plan dose minus reference plan dose) was small on average, −0.2 Gy, but with a substantial range: −4.4 Gy to 2.3 Gy amongst patients. Henke et al. used a similar approach to the one utilised in this study, contouring the GTV at each fraction using the GTV propagated with DIR as a starting point [Citation7]. They found that the mean GTV V99% across all patients was 4% smaller for adapted than couch-shift plans. This is consistent with our results, accounting for the above-noted difference between V99% and D99%.
The mean value of the Dice coefficient between DIR-propagated GTVs and daily re-contoured GTVs across all tumours and fractions was 0.8 (range: 0.70−0.99). This suggests that contouring variability, including differences between contouring on contrast CT and MRI [Citation13], contributed to the observed reduction in GTV coverage, and not just anatomic deformation. The Dice coefficient would also be less than one if the tumours grew or shrunk. However, we did not observe strong evidence for such volume changes in our study.
Because we did not use dose accumulation to estimate OAR doses, the D0.5 cc values reported here only provide an upper bound on the maximum dose received by a 0.5 cc tissue volume (comprising the same tissue at each fraction). This may account for the generally higher OAR maximum dose values reported here in comparison to work that reports accumulated doses [Citation3], in addition to our high dose-gradient isotoxic planning approach.
By allowing for daily plan adaptation, the use of an MR-linac may provide an opportunity to minimise dose to luminal OARs and reduce the risk of gastro-intestinal toxicities [Citation14]. Beyond this, treatment on an MR-linac may allow for the use functional imaging to assess normal tissue damage [Citation15], as well as tumour response.
Conclusions
A standard couch-shift based image-guided radiation therapy workflow for liver SBRT treatments led to a systematic overdose of luminal OARs that were adjacent to targets. Patients for whom lesions abut such OARs should thus benefit from MR-guided plan adaptation, even though dose escalation may not be routinely possible. Targets were routinely under-dosed as a result of inter-fraction anatomic liver deformation and contouring variability. Apart from this last factor, MR-guided plan adaptation at the time of treatment overcomes these shortcomings and should allow for more accurate assessment of normal tissue dose responses through adaptive replanning based on daily anatomic imaging as well as functional imaging of OARs.
References
Supplemental Material
Download MS Word (6 MB)Acknowledgments
We thank Dr. Pablo Munoz-Schuffenegger for his work in setting up this study.
Disclosure statement
No potential conflict of interest was reported by the author(s).
Additional information
Funding
- Jaffray DA. Emergent technologies for 3-dimensional image-guided radiation delivery. Semin Radiat Oncol. 2005;15(3):208–216.
- Mendez Romero A, Zinkstok RT, Wunderink W, et al. Stereotactic body radiation therapy for liver tumors: impact of daily setup corrections and day-to-day anatomic variations on dose in target and organs at risk. Int J Radiat Oncol Biol Phys. 2009;75(4):1201–1208.
- Velec M, Moseley JL, Craig T, et al. Accumulated dose in liver stereotactic body radiotherapy: positioning, breathing, and deformation effects. Int J Radiat Oncol Biol Phys. 2012;83(4):1132–1140.
- Eccles CL, Dawson LA, Moseley JL, et al. Interfraction liver shape variability and impact on GTV position during liver stereotactic radiotherapy using abdominal compression. Int J Radiat Oncol Biol Phys. 2011;80(3):938–946.
- Leinders SM, Breedveld S, Mendez Romero A, et al. Adaptive liver stereotactic body radiation therapy: automated daily plan reoptimization prevents dose delivery degradation caused by anatomy deformations. Int J Radiat Oncol Biol Phys. 2013;87(5):1016–1021.
- Schmid RK, Tai A, Klawikowski S, et al. The dosimetric impact of inter-fractional organ-at-risk movement during liver stereotactic body radiation therapy. Pract Radiat Oncol. 2019;9:e549–e558.
- Henke L, Kashani R, Robinson C, et al. Phase I trial of stereotactic MR-guided online adaptive radiation therapy (SMART) for the treatment of oligometastatic or unresectable primary malignancies of the abdomen. Radiother Oncol. 2018;126(3):519–526.
- Brock KK, Sharpe MB, Dawson LA, et al. Accuracy of finite element model-based multi-organ deformable image registration. Med Phys. 2005;32(6):1647–1659.
- Velec M, Moseley JL, Svensson S, et al. Validation of biomechanical deformable image registration in the abdomen, thorax, and pelvis in a commercial radiotherapy treatment planning system. Med Phys. 2017;44(7):3407–3417.
- Swaminath A, Dawson LA. Image-guided radiotherapy strategies in upper gastrointestinal malignancies. Front Radiat Ther Oncol. 2011;43:315–330.
- Winkel D, Bol GH, Kroon PS, et al. Adaptive radiotherapy: the Elekta Unity MR-linac concept. Clin Transl Radiat Oncol. 2019;18:54–59.
- Henke LE, Olsen JR, Contreras JA, et al. Stereotactic MR-guided online adaptive radiation therapy (SMART) for ultracentral thorax malignancies: results of a phase 1 trial. Adv Radiat Oncol. 2019;4(1):201–209.
- Voroney JP, Brock KK, Eccles C, et al. Prospective comparison of computed tomography and magnetic resonance imaging for liver cancer delineation using deformable image registration. Int J Radiat Oncol Biol Phys. 2006;66(3):780–791.
- Miften M, Vinogradskiy Y, Moiseenko V, et al. Radiation dose-volume effects for liver SBRT. Int J Radiat Oncol Biol Phys. 2018. DOI:10.1016/j.ijrobp.2017.12.290
- Maturen KE, Feng MU, Wasnik AP, et al. Imaging effects of radiation therapy in the abdomen and pelvis: evaluating “innocent bystander” tissues. Radiographics. 2013; 33(2):599–619.