
Abstract
Background
Clinically, a constant value of 1.1 is used for the relative biological effectiveness (RBE) of protons, whereas in vitro the RBE has been shown to vary depending on physical dose, tissue type, and linear energy transfer (LET). As the LET increases at the distal end of the proton beam, concerns exist for an elevated RBE in normal tissues. The aim of this study was therefore to investigate the heterogeneity of RBE to brain structures associated with cognition (BSCs) in pediatric suprasellar tumors.
Material and methods
Intensity-modulated proton therapy (IMPT) plans for 10 pediatric craniopharyngioma patients were re-calculated using 11 phenomenological and two plan-based variable RBE models. Based on LET, tissue dependence and number of data points used to fit the models, the three RBE models considered the most relevant for the studied endpoint were selected. Thirty BSCs were investigated in terms of RBE and dose/volume parameters.
Results
For a representative patient, the median (range) dose-weighted mean RBE (RBEd) across all BSCs from the plan-based models was among the lowest (1.09 (1.02–1.52) vs. the phenomenological models at 1.21 (0.78–2.24)). Omitting tissue dependency resulted in RBEd at 1.21 (1.04–2.24). Across all patients, the narrower RBE model selection gave median RBEd values from 1.22 to 1.30.
Conclusion
For all BSCs, there was a systematic model-dependent variation in RBEd, mirroring the uncertainty in biological effects of protons. According to a refined selection of in vitro models, the RBE variation across BSCs was in effect underestimated when using a fixed RBE of 1.1.
Introduction
Pediatric craniopharyngioma occurs in the suprasellar region of the brain and is often treated with a combination of surgery and radiation therapy [Citation1]. With tumor location in close proximity to critical brain structures associated with cognition (BSCs) (e.g., the temporal lobes) and an increased radiosensitivity compared to adults, pediatric patients are particularly vulnerable for cognitive impairment [Citation2]. The majority of studies related to cognitive impairment in pediatric brain tumor patients have focused on the correlation of radiation dose to large brain regions [Citation3–5], whereas recent research has suggested that the dose to smaller substructures may have a substantial impact on cognitive function [Citation6–9].
Pediatric brain tumor patients are increasingly being referred to proton therapy aiming to spare healthy tissues [Citation10]. This also refers to the potential of avoiding specific and smaller brain substructures and thereby better preserving cognitive functions and the related intelligence quotient (IQ) [Citation4,Citation11]. In clinical practice, a constant value of 1.1 is used to estimate the relative biological effectiveness (RBE), although pre-clinical experiments have shown a substantial variation in RBE with both biological and physical factors [Citation12]. The linear energy transfer (LET) is higher at the distal end of the proton beam and is therefore of clinical concern as it may be linked to an elevated RBE in normal brain tissue [Citation13], and may differently affect BSCs in the case of suprasellar tumors.
Phenomenological RBE models have been developed from cell-irradiation experiments to include variations in the physical and biological parameters [Citation14–26]. The LET distributions and derived theoretical RBEs vary significantly depending on the organ at risk and tumor location [Citation27,Citation28]. The complexity in interpretations of the RBE was recently highlighted by Rørvik et al. [Citation28], showing how both input data and resulting RBE vary considerably between the models, pointing toward a range of RBE values as well as end-point specific selection of models to best quantify the effect.
In this study, we therefore applied a large number of published variable RBE models to analyze RBE-weighted doses in BSCs in pediatric craniopharyngioma patients following proton therapy. In order to estimate more accurate ranges of RBE-weighted doses to aid in definition and use of dose/volume parameters for BSCs in proton therapy, we also aimed to narrow in and identify the RBE models that best matched our patient group and endpoint.
Material and methods
Treatment planning data
Intensity-modulated proton therapy (IMPT) plans of 10 pediatric patients with craniopharyngioma were optimized in the Eclipse treatment planning system (Varian Medical Systems, Palo Alto, CA, USA) using a static RBE of 1.1 to a prescription dose of 54 Gy (RBE) in 30 fractions. A three-field configuration adapted from double scattering treatment planning and guidelines was used [Citation9,Citation13]; i.e., using a right and left superior anterior oblique field as well as a superior posterior oblique field (Supplementary Figure A1). The median primary planning target volume (PTV) was 31 cm3 (range; 18–63 cm3) across all patients. The clinically approved structure sets were used for treatment planning, whereas additional BSCs (Supplementary Table A1) were delineated retrospectively [Citation9,Citation11] from the registered CT- and T1/T2 MRI-scans. All patient data were anonymized, by also removing age and gender distributions, as approved through the institutional review board.
Calculations of relative biological effects
The LET and the RBE dose distributions were calculated on the planning CT using the FLUKA (Version 2011.2x) Monte Carlo code [Citation29–31] and in-house Python-based software [Citation29,Citation30]. The dose-averaged LET (LETd) was calculated accounting for primary and secondary protons. In order to calculate the full range of possible RBE values, 11 phenomenological models () [Citation28], in addition to two plan-based models from Frese et al. (FRE) [Citation22] and Unkelbach et al. (UNK) [Citation14] were applied to the most representative patient (the patient with the PTV closest to the median value across all patients). Phenomenological models are fitted from in vitro data of clonogenic cell survival experiments, while plan-based models are dependent on treatment plan variables (i.e., LETd and dose) and normalized to an average RBE of 1.1 in the target volume. For the tissue dependent models, i.e., including the linear quadratic parameters of the reference radiation (α/β)x in the fitting equations as shown in , (α/β)x of both 2 Gy and 3 Gy was used with the exception of the model by Chaudhary et al., where (α/β)x of 1.83 Gy and 8.71 Gy was used (corresponding to the two (α/β)x of the cell lines used to derive the model). In the non-tissue dependent models, a constant (α/β)x of 3.76 Gy was used for the model by Wilkens and Oelfke (WIL) and a constant (α/β)x of 3.33 Gy for the model by Chen and Ahmad (CHE). The input parameter of 3.76 Gy applied to the WIL model is the ratio of the intermediate value of αx and βx in the V79 cell line found by Tilly et al. [Citation31]. Both the weighted (RORW) and unweighted (RORUW) version of the model suggested by Rørvik et al. were included [Citation17].
Table 1. Median RBEd (range) across all BSCs for sorted model categories.
For the complete set of ten patients, three models were selected as described in the following section.
Categorization of variable RBE models
The variable RBE models differ from each other in terms of basic assumptions, regression technique, and experimental database used to fit the models [Citation28,Citation32]. Key values in the experimental database were organized, and the RBE values were handled both jointly and categorized according to model properties. To narrow down the suitable RBE models for the endpoint of cognitive impairment while also covering relevant LET values, a set of selection criteria was defined from the included phenomenological models: (i) range of radiation fractionation sensitivity (α/β)x data point values covering 2–3 Gy, which reflects a probable range in BSCs; (ii) LETd data point values covering a range up to 20 keV µm−1 which mirrors clinically relevant LETd values; (iii) a lower limit for the number of data points used to fit each model was pragmatically set to 20, thereby choosing the most data abundant models while still keeping the majority of them within the selection.
Dose/volume and RBE analysis
The BSCs (Supplementary Table A1) were investigated in terms of RBE-weighted dose/volume parameters and RBE. Dose/volume parameters associated with white matter damage (%V40Gy) and reduction of neural stem cell number (%V10Gy) were analyzed with respect to the variable RBE models for all BSCs [Citation33]. Discrete RBE mean dose values (RBEd) for each structure were reported by dividing the RBE-weighted mean dose from each model by the physical mean dose (RBE = 1.0) (further details in [Citation34]). Associated decline in IQ points was estimated based on models from Merchant et al. [Citation35].
Results
RBE estimation across all models
Across the 13 RBE models, there were large variations in RBE-weighted dose distributions and RBE-weighted mean doses for each BSC (, and Supplementary Table B1). The median RBEd across all models and structures for the representative patient was 1.20 (range 0.81–2.24).
Figure 1. The calculated RBEd of the analyzed BSCs across all models for the representative patient. The horizontal solid line shows RBE of 1.1. Open and closed symbols indicate (α/β)x of 2 and 3 Gy, respectively, with exception of CHD, CHE, and WIL. Ent. Cor.: entorhinal cortex; L: left; R: right; LFWM: left frontal white matter; Hippo: hippocampus; SVZ: subventricular zone.
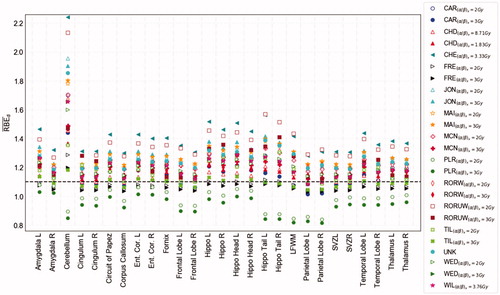
For the two plan-based models (FRE and UNK), the median RBEd across all structures was 1.09 (1.02–1.52), compared to a median of 1.21 (0.78–2.24) for the phenomenological models (). However, the phenomenological Peeler (PLR) model estimated an RBEd of less than 1.1 consistently across all included structures. Considering the non-tissue dependent models (CHE, WIL, and UNK), the estimated RBEd range was 1.04–2.24, whereas somewhat lower for the tissue dependent models (0.78–1.93). The variable RBE models fitted to a single cell line revealed no systematic difference compared to models fitted to multiple cell lines in our data set. The lowest median RBEd (across all models) of 1.14 was observed for the (left) parietal lobe while the highest (1.65) was found for the cerebellum (). The CHE model provided the highest RBEd across all structures apart from the cerebellum, parietal lobes, and left hippocampus tail, where the unweighted version of the ROR model (RORUW) provided the highest values.
Model selection and analysis of RBE across all patients
Three models (JON, MCN, and RORW) fulfilled the defined selection criteria (). From the eleven models, five fulfilled the criterion for minimum included data points, four for (α/β)x range and five for LETd. Four models (CHE, TIL, WED, WIL) failed on all three criteria, whereas four models were omitted based on one or two criteria (PLR, MAI, CAR, CHE). The two plan-based models, UNK and FRE, were excluded as these were not generated from in vitro data.
Table 2 . Overview of data point values in experimental databases used to fit the variable RBE models (phenomenological) along with model dependencies.
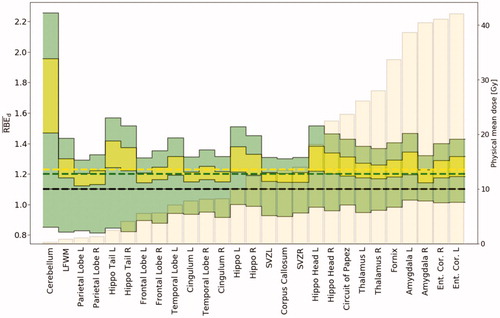
Among the three selected models, the JON model provided the highest median RBEd value, whereas RORW resulted in the lowest. The estimated RBEd range across the investigated structures from the three selected models was markedly narrower and thereby more consistent compared to the RBEd estimates including all models (). For the representative patient, the median RBEd was 1.22 (1.12–1.93) across the three selected models, whereas 1.20 for all models.
Figure 2. Minimum and maximum RBEd values for all models (filled green) and the selected set of models (filled yellow) calculated for the patient with target volume closest to the median value. Both input parameters of (α/β)x were applied to the tissue-dependent models. The beige bars show the physical mean dose of each structure. Black dashed line show RBE 1.1, and the two other dashed lines show median values across all structures for all models (green) and the selected set (yellow). Ent. Cor.: entorhinal cortex; L: left; R: right; LFWM: left frontal white matter; Hippo: hippocampus; SVZ: subventricular zone.
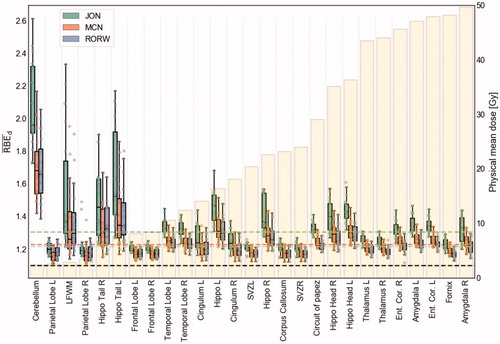
Applying the narrower model selection across all studied structures and patients, the estimated RBEd range was 1.11–2.62. The JON model estimated the highest median RBEd at 1.30 (1.15–2.62) across all structures and patients, whereas the model by RORW and MCN resulted in median values of 1.22 (1.12–2.18) and 1.23 (1.11–2.08), respectively ().
Figure 3. RBEd values of the studied BSCs, arranged in ascending order by the median physical mean dose (beige bars in background) across all patients and both input parameters of (α/β)x. The horizontal dashed lines represent the median, quartiles, and range of the variable RBE models across all BSCs. Ent. Cor.: entorhinal cortex; L: left; R: right; LFWM: left frontal white matter; Hippo: hippocampus; SVZ: subventricular zone.
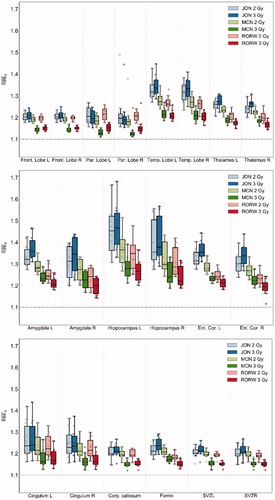
The difference in RBEd values from using the two (α/β)x input parameters was less prominent for the JON model than for RORW and MCN (). The estimated RBEd range between (α/β)x of 2 Gy and 3 Gy for MCN and RORW appeared to be lower for BSCs generally exposed to high dose levels, e.g., amygdala, thalamus, and entorhinal cortex, whereas the JON model showed the opposite trend.
Figure 4. RBEd values for the selected set of models across all patients and (α/β)x of 2 and 3 Gy, in the supratentorial substructures (upper), temporal lobe substructures (middle), and ventricular substructures (lower). Corp.: corpus callosum; Ent. Cor.: entorhinal cortex; Front: frontal; L: left; R: right; Par: parietal; Temp: temporal; SVZ: subventricular zone.
Among the three models, the JON model generally provided the highest RBE values surrounding the target volume (Supplementary Figure B1) as well as the highest values of RBEd across all structures and patients. This was, however, different for the parietal lobes, where the RORW model provided the highest values for some of the patients (Supplementary Figure B2). For RORW and MCN, the RBEd values were higher with (α/β)x of 2 Gy than of 3 Gy. The results were opposite using the JON model, with the exception of the parietal lobes which followed the expected behavior of the RORW and MCN models.
In the supratentorial structures, the highest RBEd values were found in the temporal lobes, with a median RBEd of 1.27. The highest RBEd values amid the temporal lobe BSCs were found in the hippocampal structures, where estimates for the left hippocampal tail resulted in the highest RBEd with a median value of 1.41 (1.17–2.21) across all patients.
In accordance with the RBEd, the investigated volume parameters increased with the variable RBE models compared to the use of a fixed RBE of 1.1, with the JON model estimating the highest volume fractions (Supplementary Figure B3). In general, there was a larger increase in %V40Gy than the %V10Gy (both relative and absolute values), e.g., an increase in %V40Gy from 4% to 9% for the hippocampi with the JON model compared to the fixed RBE or 1.1.
For the 10 patients, the estimated median change in IQ score ranged from −8.8 to −9.4 based on RBE 1.1 and ranged from −7.7 to −9.6 applying the variable RBE models (Supplementary Figure B4 and Table B2).
Discussion
In this study, we investigated a large number of cognitive structures in terms of RBE-weighted dose in the setting of proton therapy of pediatric brain tumors. The results illustrate the considerable difference in the proton RBE values relative to different brain structures when a large number of variable RBE models are applied.
Brain structures exposed to high doses and elevated RBE are vulnerable to toxicity. Compared to the full temporal lobes, anatomic substructures within (such as the hippocampus and amygdala) appear to be particularly susceptible to high mean doses and elevated RBEd, a finding which highlights the implications of the spatial inhomogeneity in RBE. For the supratentorial brain volume, there is a known correlation between dose and cognitive impairment [Citation3]; the implicated substructures demonstrated substantial RBE variation in our patient group. For example, both the left and right thalami were exposed to relatively high RBEd values in addition to considerable physical doses, whereas the parietal and frontal lobes were spared of high RBEd compared to other structures. These latter structures are located in the entrance region of the beams, and thereby exposed to lower LET values [Citation36]. This might explain the fairly low RBEd values observed when compared to structures in closer proximity to the target volume. A closer agreement across the set of models was generally seen for cognitive structures located in these low LETd regions, which is in agreement with previous studies [Citation28,Citation36]. Overall, the distributions of LETd are highly influenced by the chosen beam configuration, and the observed patterns of LETd and physical doses in our patients are therefore limited to cases with similar target location and field set-up.
Based on the dose distributions of the craniopharyngioma patients, the predicted IQ decline was up to approximately 10 points, with variations by one-two points depending on RBE and IQ model applied. The model estimates do, however, represent an extrapolation from photons, and is likely also influenced by the full dose distribution including the whole brain volume. In addition, recent studies have noted the important role the cerebellum plays in cognition [Citation37], where specifically dose to the posterior and anterior aspects correlates with IQ decline [Citation3]. The cerebellum was exposed to high RBEd for all patients across all variable RBE models, albeit in the setting of low physical doses. Although elevated RBE may be found in high LET-regions, the RBE also increase with low physical doses, which likely contributed to the high RBE values found.
The models incorporating tissue dependence have additional variation beyond dose and LET. Compared to the phenomenological models, the plan-based model by Unkelbach et al. [Citation14] was in the lower range of RBEd across all structures, potentially underestimating the biological effects when omitting this tissue dependence. Other models excluding tissue variations apply constant (α/β)x values [Citation16,Citation23], which may explain the relatively wide range of values in this category.
The range of RBEd values was considerably narrower using the finer selection of models compared to applying the full model set. The selection method accounted for both physical and biological factors by applying range criteria to the (α/β)x and LET values. The specific models collected can thereby be regarded as limited to similar patient groups. In the case of other endpoints, the included (α/β)x values should be adjusted accordingly. Preferably, this adjustment would include (α/β)x intervals to account for the uncertainties inherent in this variable which, in itself, encompasses other complex biological factors.
Increasing RBE with decreasing (α/β)x was prominent for the RORW and MCN models, whereas an increase of RBE with increasing (α/β)x generally appeared for the JON model, in agreement with Rørvik et al. [Citation28]. Furthermore, the JON model resulted in the highest RBEd combined with the smallest RBEd range when changing the tissue parameters ((α/β)x of 2 and 3 Gy). The JON model is derived from experimental data including heavier particles (e.g., helium and carbon) in addition to protons [Citation18]. These heavier ions have different track structures with denser energy deposition than protons, which by itself could be considered as a criterion for exclusion.
The cutoff value for the total number of data points in the experimental databases was based on the assumption that models originating from a limited set of data may be more susceptible to uncertainties. However, as most of the models were excluded based on other criteria, only one omitted model (CHD) would additionally be included if the data point criterion was neglected. Nevertheless, as an alternative to applying selection criteria to the database of existing models, a possibility would be to fit end-point specific models for the patient group by selecting and including the most relevant experiments only. Depending on the availability of relevant data for the specific end-point, the number of data points for such models could be very limited.
As most clinical LETd values are within the range of 2–5 keV µm−1 [Citation38], the LET-range could have been set narrower. However, since most of the models not fulfilling this criterion lacked data point values in the lower region, narrowing the LET span would not have affected the number of models chosen. The lack of data points in the lower regions of the CHE, TIL, and WED models are accounted for by extrapolation from high LETd data, and therefore the model fits have associated uncertainties in the lower LETd ranges [Citation36].
In addition, the model selection criteria did not account for the relative frequency of data point values. For instance, the WIL and CAR models came short in terms of the (α/β)x range; however, the models have a high frequency of data point values of LETd within the clinical region [Citation28]. These models provided values relatively close to the median value for most structures across all models, and therefore including these would have made only small differences to the estimated biological dose and RBEd range resulting from the included set of models.
The in vitro data used to fit the RBE models stem from a wide range of experiments, including monoenergetic beams as well as spread out Bragg peaks obtained through both active and passive scattering techniques. A large portion of these models are fitted using monoenergetic beams only [Citation28], and it could be that such models are better grasping the diversity in energy and LET compared to models based on data from mixed energy beams/fields. Furthermore, the effect of neutrons is not explicitly included during proton RBE modeling, and the influence of this contamination on the in vitro data and model fit is unknown. The contribution from neutrons is overall quite small; and considerably lower during pencil beam scanning compared to passively scattered protons [Citation39].
It should be pointed out that the main limitation of the current study is that the explored variable RBE models are based on in vitro cell experiments. In vitro RBE models are based on clonogenic cell survival which is more closely related to tumor control above normal tissue damage [Citation40]. Furthermore, in vitro data cannot be directly extrapolated to the complex environment found in vivo [Citation41], with different interlacing factors influencing the cell repair cycles. Extracting α and β parameters directly from the dose–response curves of tissues and organs from clinical follow-up data could be an alternative. With the current paucity of relevant in vivo data to validate the RBE models, pre-clinical models can be applied to widen our understanding of variations across cell lines and potential effects of different dose distributions in patients.
Conclusion
This study showed that there was a large and systematic model-dependent variation in RBE across the cognitive structures. The broad span of resulting RBE and dose/volume parameter values, especially seen by the use of all models, reflects the uncertainty associated with the biological effects of protons. Bearing in mind that the estimated RBEs are based on in vitro models, the results suggest that the biological dose might be underestimated in the BSCs for this patient group with the clinically applied RBE of 1.1.
Supplemental Material
Download PDF (1,022.7 KB)Acknowledgments
The project has been funded by The Norwegian Cancer Society (Grant no. 202089).
Disclosure statement
No potential conflict of interest was reported by the author(s).
References
- Drapeau A, Walz PC, Eide JG, et al. Pediatric craniopharyngioma. Childs Nerv Syst. 2019;35(11):2133–2145.
- Stripp DC, Maity A, Janss AJ, et al. Surgery with or without radiation therapy in the management of craniopharyngiomas in children and young adults. Int J Radiat Oncol Biol Phys. 2004;58(3):714–720.
- Merchant TE, Sharma S, Xiong X, et al. Effect of cerebellum radiation dosimetry on cognitive outcomes in children with infratentorial ependymoma. Int J Radiat Oncol Biol Phys. 2014;90(3):547–553.
- Merchant TE, Hua CH, Shukla H, et al. Proton versus photon radiotherapy for common pediatric brain tumors: comparison of models of dose characteristics and their relationship to cognitive function. Pediatr Blood Cancer. 2008;51(1):110–117.
- Armstrong GT, Jain N, Liu W, et al. Region-specific radiotherapy and neuropsychological outcomes in adult survivors of childhood CNS malignancies. Neuro Oncol. 2010;12(11):1173–1186.
- Zureick AH, Evans CL, Niemierko A, et al. Left hippocampal dosimetry correlates with visual and verbal memory outcomes in survivors of pediatric brain tumors. Cancer. 2018;124(10):2238–2245.
- Doger de Speville E, Robert C, Perez-Guevara M, et al. Relationships between regional radiation doses and cognitive decline in children treated with cranio-spinal irradiation for posterior fossa tumors. Front Oncol. 2017;7:166.
- Redmond KJ, Hildreth M, Sair HI, et al. Association of neuronal injury in the genu and body of corpus callosum after cranial irradiation in children with impaired cognitive control: a prospective study. Int J Radiat Oncol Biol Phys. 2018;101(5):1234–1242.
- Toussaint L, Indelicato DJ, Stokkevåg CH, et al. Radiation doses to brain substructures associated with cognition in radiotherapy of pediatric brain tumors. Acta Oncol. 2019;58(10):1457–1462.
- Journy N, Indelicato DJ, Withrow DR, et al. Patterns of proton therapy use in pediatric cancer management in 2016: an international survey. Radiother Oncol. 2019;132:155–161.
- Toussaint L, Indelicato DJ, Muren LP, et al. Temporal lobe sparing radiotherapy with photons or protons for cognitive function preservation in paediatric craniopharyngioma. Radiother Oncol. 2020;142:140–146.
- Mohan R, Peeler CR, Guan F, et al. Radiobiological issues in proton therapy. Acta Oncol. 2017;56(11):1367–1373.
- Haas-Kogan D, Indelicato DJ, Paganetti H, et al. National Cancer Institute workshop on proton therapy for children: considerations regarding brainstem injury. Int J Radiat Oncol Biol Phys. 2018;101(1):152–168.
- Unkelbach J, Botas P, Giantsoudi D, et al. Reoptimization of intensity modulated proton therapy plans based on linear energy transfer. Int J Radiat Oncol Biol Phys. 2016;96(5):1097–1106.
- Chaudhary P, Marshall TI, Perozziello FM, et al. Relative biological effectiveness variation along monoenergetic and modulated Bragg Peaks of a 62-MeV therapeutic proton beam: a preclinical assessment. Int J Radiat Oncol Biol Phys. 2014;90(1):27–35.
- Chen Y, Ahmad S. Empirical model estimation of relative biological effectiveness for proton beam therapy. Radiat Prot Dosimetry. 2012;149(2):116–123.
- Rørvik E, Thörnqvist S, Stokkevåg CH, et al. A phenomenological biological dose model for proton therapy based on linear energy transfer spectra. Med Phys. 2017;44(6):2586–2594.
- Jones B. Towards achieving the full clinical potential of proton therapy by inclusion of LET and RBE models. Cancers (Basel). 2015;7(1):460–480.
- Tilly N, Johansson J, Isacsson U, et al. The influence of RBE variations in a clinical proton treatment plan for a hypopharynx cancer. Phys Med Biol. 2005;50(12):2765–2777.
- Wedenberg M, Lind BK, Hårdemark B. A model for the relative biological effectiveness of protons: the tissue specific parameter alpha/beta of photons is a predictor for the sensitivity to LET changes. Acta Oncol. 2013;52(3):580–588.
- McNamara AL, Schuemann J, Paganetti H. A phenomenological relative biological effectiveness (RBE) model for proton therapy based on all published in vitro cell survival data. Phys Med Biol. 2015;60(21):8399–8416.
- Frese MC, Wilkens JJ, Huber PE, et al. Application of constant vs. variable relative biological effectiveness in treatment planning of intensity-modulated proton therapy. Int J Radiat Oncol Biol Phys. 2011;79(1):80–88.
- Wilkens JJ, Oelfke U. A phenomenological model for the relative biological effectiveness in therapeutic proton beams. Phys Med Biol. 2004;49(13):2811–2825.
- Carabe A, Moteabbed M, Depauw N, et al. Range uncertainty in proton therapy due to variable biological effectiveness. Phys Med Biol. 2012;57(5):1159–1172.
- Mairani A, Dokic I, Magro G, et al. A phenomenological relative biological effectiveness approach for proton therapy based on an improved description of the mixed radiation field. Phys Med Biol. 2017;62(4):1378–1395.
- Peeler CR. Assessing the potential clinical impact of variable biological effectiveness in proton radiotherapy [PhD thesis]. USA: University of Texas; 2016.
- Fjaera LF, Li Z, Ytre-Hauge KS, et al. Linear energy transfer distributions in the brainstem depending on tumour location in intensity-modulated proton therapy of paediatric cancer. Acta Oncol. 2017;56(6):763–768.
- Rørvik E, Fjaera LF, Dahle TJ, et al. Exploration and application of phenomenological RBE models for proton therapy. Phys Med Biol. 2018;63(18):185013.
- Ferrari A, Sala PR, Fasso A, et al. FLUKA: a multi-particle transport code. Cern. INFN/TC_05/11, SLAC-R-773; 2005.
- Böhlen TT, Cerutti F, Chin MPW, et al. The FLUKA code: developments and challenges for high energy and medical applications. Nucl Data Sheets. 2014;120:211–214.
- Tilly N, Brahme A, Carlsson J, et al. Comparison of cell survival models for mixed LET radiation. Int J Radiat Biol. 1999;75(2):233–243.
- McNamara A, Willers H, Paganetti H. Modelling variable proton relative biological effectiveness for treatment planning. Br J Radiol. 2020;93(1107):20190334.
- Peiffer AM, Leyrer CM, Greene-Schloesser DM, et al. Neuroanatomical target theory as a predictive model for radiation-induced cognitive decline. Neurology. 2013;80(8):747–753.
- Ytre-Hauge KS, Fjaera LF, Rørvik E, et al. Inter-patient variations in relative biological effectiveness for cranio-spinal irradiation with protons. Sci Rep. 2020;10(1):6212.
- Merchant TE, Kiehna EN, Kun LE, et al. Phase II trial of conformal radiation therapy for pediatric patients with craniopharyngioma and correlation of surgical factors and radiation dosimetry with change in cognitive function. J Neurosurg. 2006;104(2 Suppl.):94–102.
- Paganetti H. Relative biological effectiveness (RBE) values for proton beam therapy. Variations as a function of biological endpoint, dose, and linear energy transfer. Phys Med Biol. 2014;59(22):R419–R472.
- Eekers DBP, In 't Ven L, Deprez S, et al. The posterior cerebellum, a new organ at risk? Clin Transl Radiat Oncol. 2018;8:22–26.
- Paganetti H, van Luijk P. Biological considerations when comparing proton therapy with photon therapy. Semin Radiat Oncol. 2013;23(2):77–87.
- Schneider U, Agosteo S, Pedroni E, et al. Secondary neutron dose during proton therapy using spot scanning. Int J Radiat Oncol Biol Phys. 2002;53(1):244–251.
- Sørensen BS. Commentary: RBE in proton therapy – where is the experimental in vivo data? Acta Oncol. 2019;58(10):1337–1339.
- Lühr A, von Neubeck C, Pawelke J, et al. "Radiobiology of Proton Therapy": results of an international expert workshop. Radiother Oncol. 2018;128(1):56–67.