
Abstract
Background and purpose
When treating patients for esophageal cancer (EC) with photon or proton radiotherapy (RT), breathing motion of the target and neighboring organs may result in deviations from the planned dose distribution. The aim of this study was to evaluate the magnitude and dosimetric impact of breathing motion. Results were based on comparing weekly 4D computed tomography (4D CT) scans with the planning CT, using the diaphragm as an anatomical landmark for EC.
Material and methods
A total of 20 EC patients were included in this study. Diaphragm breathing amplitudes and off-sets (changes in position with respect to the planning CT) were determined from delineated left diaphragm structures in weekly 4D CT-scans. The potential dosimetric impact of respiratory motion was shown in several example patients for photon and proton radiotherapy.
Results
Variation in diaphragm amplitudes were relatively small and ranged from 0 to 0.8 cm. However, the measured off-sets were larger, ranging from −2.1 to 1.9 cm. Of the 70 repeat CT-scans, the off-set exceeded the ITV-PTV margin of 0.8 cm during expiration in 4 CT-scans (5.7%) and during inspiration in 13 CT-scans (18.6%). The dosimetric validation revealed under- and overdosages in the VMAT and IMPT plans.
Conclusions
Despite relatively constant breathing amplitudes, the variation in the diaphragm position (off-set), and consequently tumor position, was clinically relevant. These motion effects may result in either treatments that miss the target volume, or dose deviations in the form of highly localized over- or underdosed regions.
Introduction
Radiotherapy plays a pivotal role in the curative treatment of esophageal cancer (EC). Treatment is delivered either as neo-adjuvant chemotherapy (followed by surgery), or as definitive chemoradiotherapy [Citation1]. Radiotherapy for EC is challenging due to vital organs (e.g., heart and lungs) in close proximity to the primary tumor. Treatment can lead to radiation-induced toxicity when such organs receive excessive dose. Therefore, radiotherapy treatment planning aims to minimize the radiation dose to the organs at risk (OARs), while delivering sufficient dose levels to the target volumes [Citation2].
Advanced delivery techniques, such as intensity modulated radiotherapy (IMRT) and Volumetric Modulated Arc Therapy (VMAT), have led to improved radiation dose distributions [Citation3]. Doses to OARs could further be reduced by the use of Intensity Modulated Proton Therapy (IMPT) [Citation4]. Both VMAT and IMPT make use of treatment beams with multiple segments that sequentially irradiate different parts of the CTV volume. This fragmentation creates a risk of interplay between the tumor motion and the dose deposition [Citation4]. This may distort the intended dose distribution and subsequently lead to local under- and overdosage [Citation5]. Therefore, it is essential to be more vigilant of tumor motion when treating thoracic EC with advanced radiotherapy techniques.
When treating EC with radiotherapy, the surrounding organs may influence the delivered dose to the target volumes. The position of the diaphragm with respect to the treatment beams, mainly in Inferior-Superior direction, may have a major influence on the radiological equivalent path lengths of these treatment beams. This is especially true of tumors in the distal esophagus and gastroesophageal junction (GEJ).
Tumors located near the diaphragm are often highly mobile due to respiratory motion [Citation6,Citation7]. Balter et al. [Citation8] reported that the diaphragm is an acceptable anatomical landmark for radiographic estimation of liver motion. The motion of inferiorly located lung cancers correlated well with the apex of the diaphragm [Citation9]. The GEJ is normally located at the level of the esophageal hiatus of the diaphragm. The esophageal hiatus lies immediately anteriorly and slightly to the left, and is separated from the aortic hiatus by the decussation of the right crus of the diaphragm [Citation10]. Therefore, we assume that the left side of the diaphragm is a good anatomic landmark for tumors located in the distal esophagus or in the GEJ.
There is a substantial number of studies that report inter-fraction variation and breathing motion in EC [Citation1,Citation11–23]. However, most studies only evaluate breathing amplitudes on the planning CT-scan [Citation12,Citation13,Citation15–20] while inter-fraction variations in breathing amplitudes are not usually investigated. Of those who did investigate the inter-fraction variation [Citation1,Citation11,Citation14,Citation21–23], only three studies used 4D imaging techniques [Citation1,Citation11,Citation14]. In these studies, only the end-expiration phase was included in the inter-fractional variation analyses or displacements were not reported with respect to the bony anatomy, which is the current standard matching protocol in position verification for the treatment of EC.
Therefore, the aim of the current study was to evaluate the magnitude and inter-fractional variation of the breathing motion and position of the diaphragm with respect to the bony anatomy from repeat 4D CT-scans. To this end, the diaphragm was used as an anatomical landmark for EC. Furthermore, we wanted to demonstrate the potential impact of these inter-fractional variations on high precision image guided radiotherapy where consistent beam path lengths are necessary.
Material and methods
Study population
A total of 20 patients with histologically proven EC were included between December 2016 and July 2017. Treatment consisted of curative photon radiotherapy, with or without chemotherapy, followed by surgery for most patients (80%). This study was approved by the institutional ethics board and all patients provided written, informed consent.
Data collection and procedures
Image acquisition
For RT-treatment planning, a 4D CT scan (pCT) (Somatom Definition AS, 64 slice, Siemens Medical Inc.) was acquired for each patient. In addition, 4–6 weekly repeat 4D CT-scans (rCT) were performed, depending on the treatment schedule. Patients were scanned head-first in a supine position with arms above the head using an arm rest. The respiratory cycle was monitored with the use of the Anzai gating system (Anzai Medical Co., LTD). The CT images were reconstructed into 10 consecutive temporal breathing phases, as well as an average scan. The scans were imported into the treatment planning system (Raystation, Raysearch Laboratories AB, Stockholm, Sweden).
Diaphragm motion and location
All phases of the 4D CT-scans were evaluated to establish the maximum expiration and inspiration phase. The diaphragm was delineated on the left side in all scans, since the GEJ is situated at this side of the body [Citation6,Citation7]. The diaphragm delineations on the expiration phase (DE) and the inspiration phase (DI) were transferred to the average CT-scans. The breathing amplitude was determined for each 4D scan by the linear superior-inferior (SI) distance between the most superior points of the DE and DI delineations.
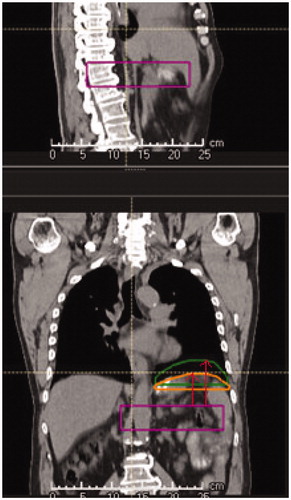
To establish the location of the diaphragm with respect to the bony anatomy, the distance from the most superior part of the 12th thoracic vertebra (TH12) to the superior part of the DE and DI delineations was measured in coronal view on each pCT and rCT (). The off-set was defined for each 4D scan by the measured difference in DE and DI diaphragm positions on the rCTs with respect to corresponding pCTs.
Figure 1. Measuring the distance (red arrows) from the twelfth thoracic vertebrae to the diaphragm delineated in the scans corresponding to the end of inspiration (orange) and end of expiration (green) breathing phases. Distances were measured in the superior-inferior direction. Off-sets were determined by calculating the difference between the position of the diaphragm in the repeat CT and the planning CT scans.
The diaphragm as an anatomical landmark for EC
Based on the close anatomic relationship between the GEJ and the left diaphragm, the diaphragm displacement was used as a surrogate for the esophageal/GEJ target motion. The distal part of the esophagus is subjected to shifts due to longitudinal muscle contractions and laxity of the phrenoesophageal attachments, including the periesophageal fascia around the esophageal hiatus with the esophagus and constriction of the anatomic sphincter during inspiration [Citation6,Citation7,Citation24]. Therefore, it can be expected that deviations in target position occur concurrent with the observed variations in breathing off-set and amplitude will result in variations in the position of the gross tumor volume (GTV).
To test this hypothesis, we determined motion and baseline shift data of the GTV from the weekly 4D CT-scans and compared those to the diaphragm shifts. The GTV was delineated by the treating radiation oncologist. Deformable image registration was performed in Raystation (ANACONDA) between the expiration phase (50%) of the pCT and the 50% of the rCT-scans at the different timepoints. The mean and 95th percentile of the deformation vector lengths within the GTV were determined. Furthermore, the inferior-superior components of the vectors were determined and averaged over the GTV volume.
Dosimetric validation
Differences in diaphragm position between the weekly repeat CT-scans (rCTs) and planning CT-scan (pCT) may result in large changes to the radiological equivalent path length, resulting in relevant dose deviations [Citation25,Citation26]. To illustrate this, we recalculated both a VMAT plan and an IMPT plan on rCTs with a small and large diaphragm off-set. Thereafter, we recalculated both VMAT plans and IMPT plans of patients which exceed the DE off-set of >0.8 cm and DI off-set of < −0.8 cm. We assessed the voxelwise minimum and maximum plans as we do in general practice.
The VMAT plans as well as the IMPT plans were generated on the average CT-scan reconstructed from the 4D-CT scan. The same procedure was used for the dose calculations on the repeat CT-scans. The ITV was generated by adjusting the CTV manually to incorporate the movement of the target in all breathing phases and the PTV by an expansion of 8 mm from this ITV. The IMPT plans were robustly optimized (using Monte Carlo) to cover the Internal Target Volume (ITV) and to be robust against range errors (±3%) and setup errors (8 mm) [Citation27]. The plans contained two beams: one posterior and one right posterior oblique field. The VMAT plans were planned on a Planning Target Volume (PTV) margin of 0.8 cm, the current clinical margin for this patient group and contained two 6 MV arcs. All VMAT and IMPT plans were clinically acceptable regarding target and OAR dose.
Statistics
To analyze the agreement in breathing motion between the rCTs and pCTs, a mixed model analysis with random intercept was performed [Citation28]. The mixed model analysis indicates whether the average diaphragm position with respect to the bony anatomy, and the breathing amplitude of the pCT, is predictive for those parameters determined from the rCTs. Thereafter, a scatterplot was generated in SPSS Version 23.0 with the regression lines of the mixed model analysis (IBM SPSS Statistics for Windows, Released 2015. IBM Corp, Armonk, NY). The differences between the baseline pCT values and those determined from the rCTs are shown in Bland-Altman plots. Also presented are the mean differences (M) and the Limits of Agreement (LOA = M ± 2SD, with SD the Standard Deviation).
Results
Motion of diaphragm
One of the 20 patients withdrew written consent after two weeks of RT. The mean age of the 19 remaining patients was 67.9 (range 53.4–83.9) years. Dose prescriptions were 41.4/23, 50.4/28 or 51/17 Gy/fractions. All baseline patient characteristics are shown in .
Table 1. Patient characteristics.
Artifacts due to slow breathing frequencies were visible on 20 4D CT-scans, from the scans of eight patients. Scans of two patients showed artifacts on only one rCT and these scans were excluded from the analysis. In two patients, only the pCT contained artifacts, therefore we used the first rCT as the reference scan. In total, four patients were excluded due to artifacts on both the pCT and multiple rCTs. All further analyses were performed using data from the remaining 15 patients.
Breathing motion (amplitude)
The baseline (pCT) breathing amplitudes ranged from 0.75 to 2.20 cm with a mean amplitude (SD) of 1.12 (0.34) cm. The baseline breathing amplitude was <1.00 cm for three patients (20%), between 1.00 and 2.00 cm for 11 patients (73%) while one patient (7%) had a baseline amplitude of >2.00 cm.
The amplitudes in the weekly rCTs ranged from 0.50 to 2.20 cm with a mean (SD) of 1.17 (0.41) cm. Compared to the baseline amplitudes, the mean (SD) of the absolute amplitude differences was 0.25 (0.21) cm with a range of 0.00–0.80 cm (Supplementary Figure 1(c) and Supplementary Table 1). Of the 70 rCTs, 23 scans (32.9%) showed a decrease in amplitude, 32 scans (45.7%) an increase, and in 15 CT-scans (21.4%) the amplitude was similar to the baseline measurements.
Breathing motion relative to bony anatomy (off-set)
Off-set values of the EC relative to the thoracic vertebra, TH12, are shown in Supplementary Figure 1(a,b) and Supplementary Tables 2 and 3. The average off-set value was 0.51 cm (SD: 0.45 cm; range: −2.08 to 1.93 cm). The mean absolute DI off-set was 0.57 cm (SD: 0.50 cm). A decrease in off-set corresponds to a more caudal diaphragm position compared to the pCT. Patients with a risk of under-dosage of the tumor are those with a positive expiration off-set and/or a negative inspiration off-set were the tumor moves out of the defined target volume. From the 70 rCTs, a positive expiration off-set was observed in 31 cases (44.3%) and a negative inspiration off-set in 41 rCTs (58.6%).
The DE and DI off-sets extended beyond the PTV margin of 0.8 cm in 4 (5.7%) and 13 (18.6%) rCTs, respectively. Patients 3, 5 and 16 showed off-sets larger than the PTV margin on multiple rCTs. In the Supplementary Figure 2, patients’ individual DE and DI off-sets and amplitude differences are shown with respect to the 0.8 cm PTV margin.
Analysis of breathing motion and diaphragm position
The off-set values were checked for normality with the Shapiro–Wilk test and Q-Q plots and appeared to be normally distributed (p > 0.05). The mixed model analysis showed a pooled effect size (β (standard error)) of 0.92 (0.05) (p < 0.01) for the DE off-set analysis and 0.91 (0.06) (p < 0.01) for the DI off-sets. The pooled effect size of the amplitude analysis was 0.80 (0.17) (p < 0.01). The scatterplots with the mixed model regression lines are shown in Supplementary Figure 3(a–c). All analyses showed that the breathing amplitudes and differences in diaphragm position with respect to the bony anatomy on the planning CT-scan were significant predictors for the measurements in the repeat CT-scans.
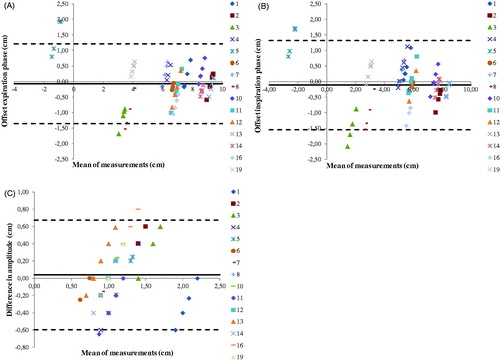
The Bland-Altman plots illustrate the agreement of the DE and DI off-sets and the breathing amplitude differences of the repeat CT-scans with respect to the planning CT (). The 95% limits of agreement (LOA) indicate the mean off-set ± 1.96 × SD. The plots showed that most measurements are within the LOA meaning the values of the repeat CT-scans are not significantly different from the planning CT-scans. The outliers in the amplitude and the off-set plots correspond to different patients.
Figure 2. (A) Bland-Altman plot showing the changes with respect to the planning CT in distance of diaphragm expiration delineation to TH12 (expiration off-set). (B) Bland-Altman plot of the inspiration off-set. (C) Bland-Altman plot showing the diaphragm amplitude differences with respect to the planning CT.
The diaphragm as an anatomical landmark for EC
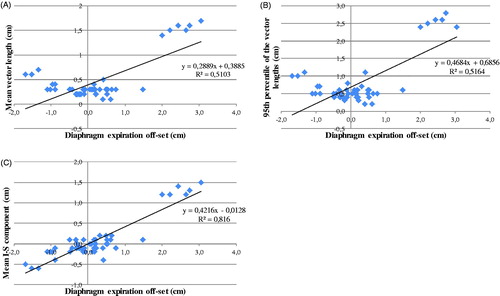
The mean vector length and the 95th percentile of the vector lengths in the GTV determined from the deformation vector field show a reasonable correlation with the diaphragm expiration off-set with a coefficient of determination R2 of 0.51 and 0.52 and a slope of the fit line (α) of 0.29 and 0.47 respectively (). The inferior-superior component shows a strong correlation (R2 = 0.82; α = 0.42) with the diaphragm expiration off-set ().
Figure 3. (A) Mean vector length plotted against Diaphragm expiration offset. (B) 95th percentiles of the vector lengths plotted against Diaphragm expiration offset. (C) Mean inferior-superior component plotted against Diaphragm expiration offset.
Dosimetric validation
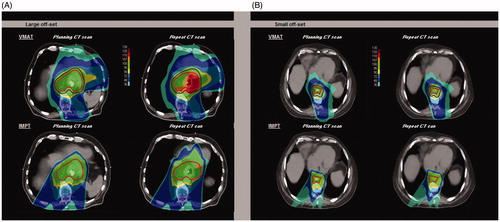
The VMAT and IMPT plans created for a patient with a large off-set (−2.08 cm DI and −1.68 cm DE) are shown in . Increase in dose with localized overdosage (hotspots) up to 119.5% of the prescribed dose occurred not only in the target, but also in the heart region for the VMAT plan. For the IMPT plan hotspots up to 110.8% of the prescribed dose were seen. Consequently, for the IMPT plan the mean heart dose increased from 11.3 Gy on the pCT to 15.1 Gy on the rCT. For the VMAT plan it increased from 19.8 Gy to 20.9 Gy, respectively. Furthermore, a worse ITV coverage with a V95 of 98.6% was observed. The VMAT and IMPT plans for the patient exhibiting a small off-set in DE and DI showed no relevant over- or underdosages ().
Figure 4. Dose distribution comparison of a VMAT plan with an IMPT plan of a patient with a large diaphragm position off-set (A) and a patient with a small diaphragm position off-set (B). For the VMAT plan, the PTV (dark red) and ITV (red) are shown and for the IMPT plan only the ITV (red) is shown.
The VMAT and IMPT plans created for patients which exceed the DE off-set >0.8 cm and DI off-set < −0.8 cm are shown in Supplementary Figure 4. The voxelwise minimum and maximum plans of the repeat CT-scans showed underdosage and large overdosage areas for the VMAT plans. The IMPT plans showed only small areas of under and overdosage.
Discussion
In this study, we demonstrated that patients’ diaphragm position on rCTs differed from the pCT even when the breathing amplitude remained stable. The established DE and DI off-sets were relatively large and ranged from −2.08 to 1.93 cm, (average off-set 0.5 cm).
As indicated in the introduction, the baseline breathing motion has been evaluated in several other studies. For distal EC, the reported mean peak-to-peak amplitudes were between 0.35 and 1.37 cm in the superior-inferior (SI) direction (Supplementary Table 4 and Supplementary Figure 5) [Citation11–20]. In the current study, the baseline diaphragm amplitudes appeared slightly larger than reported in literature, ranging from 0.75 to 2.20 cm, with a mean (SD) of 1.12 (0.34) cm.
No significant differences in breathing amplitude between pCT and rCT were observed in this study, which is consistent with published literature. The mean DE off-set of the diaphragm observed was of the same order of magnitude as that reported by J. Wang et al. (6.8 mm in SI direction) for the GEJ junction and J.Z. Wang (5.8 mm in SI direction) for the position of the IGTV [Citation1,Citation14]. However, Jin et al. [Citation11] found much smaller inter-fraction variations in trajectory shapes. This could be explained by the fact that they determined the variation in inspiration and expiration positions of fiducials with respect to the trajectory centroid position of the tumor, and not with respect to the bony anatomy, as other studies have done.
Other differences between our study and these just mentioned are that J. Wang et al. and J-Z. Wang et al. defined breathing phase 50% as the end of expiration for analysis. We inspected all phases and took the phase where the diaphragm is in its most superior position, which was not always the 50% phase. Furthermore, these studies did not analyze the maximum inspiration phase. Not including maximum inspiration could result in an underestimation of the variability. Our study revealed that DI off-set values exceeded the PTV margin more frequently than that of DE (13 vs. 4). Recently, Huijskens et al. [Citation29] compared the right-sided diaphragm motion of 12 pediatric patients using planning 4D CT-scans with the inspiration and expiration phases of CBCT images. Their results suggest that reproducibility in diaphragm amplitude for pediatric patients is worse than that of adults. Our study found no significant differences in adult diaphragm amplitudes between planning and treatment. The mean amplitudes of diaphragm motion reported by Huijskens et al. (11.6 mm in the CBCTs) corresponded well to the amplitudes we observed.
We tested the hypothesis that variations in breathing off-set results in variations in the position of the GTV. The results showed good and reasonable correlation which indicates that the GTV position is influenced by the position of the diaphragm. The magnitude of the 95th percentile of the vector lengths is of the same order as the diaphragm expiration offset. The mean vector length and the mean inferior-superior component of the vectors are smaller. This could be explained by diaphragm motion causing tumor motion in the superior-inferior direction as well as the lateral and ventral-dorsal direction. Furthermore, mean vector lengths are averaged over the whole GTV volume, including the cranial parts of the tumor that are located further away from the diaphragm and therefore show smaller movement.
Daily changes in diaphragm and consequently in tumor position may result in clinically relevant dose deviations. The target can be partially missed when large off-sets occur, especially if patient position verification is based on bony anatomy. Bone matching is common clinical practice for CBCT-pCT registration in most institutes. The use of fiducial markers at the tumor borders would improve the visibility of the target, and consequently the quality of position verification using CBCTs [Citation12,Citation17]. However, Jin et al. [Citation23] recommended against using marker-based position corrections due to the large tissue deformations that can occur in the distal esophagus. Instead they suggest position corrections based on bony anatomy, and using the markers to check that the tumor is still inside the projected PTV.
The dosimetric impact of diaphragm motion was demonstrated for two sample patients with a large and small off-set as well as for patients which showed a DE off-set >0.8 cm and a DI off-set < −0.8 cm. For the latter group the VMAT plans show large under- and overdosages however the sample size is too small to indicate if there is a relation between the off-set values and the size of the dose deviations. These results must be confirmed in larger treatment planning studies, including a full 4D evaluation (with interplay effects) of the cumulative influence of the breathing motion on target coverage and OAR dose for esophageal cancer patients.
Heethuis et al. [Citation30] analyzed weekly cine-MRI scans for 20 EC patients. They observed that intra-fraction EC tumor motion was highly variable between and within patients, and does not only comprise breathing motion but is also caused by tumor drift and additional deep inhalation motion by some patients.
The risk of dose deviations due to either off-sets in breathing motion, tumor drift or deep inhalation may be reduced by using motion mitigation techniques, such as breath hold techniques. In a recent study, Doi et al. [Citation31] investigated target motion by quantifying fiducial marker displacement between different breath-holds compared to free-breathing. They showed that the breath-hold technique is feasible, and minimizes the esophageal cancer target displacement. Other methods to minimize breathing motion are abdominal compression or mechanical ventilation [Citation32]. Further study into the applicability of those methods for EC treated with VMAT or IMPT techniques is necessary.
Conclusion
Although the amplitude of breathing motion may seem consistent over the course of radiotherapy, off-set of the diaphragm position and consequently tumor position can be clinically relevant. Sufficiently large off-sets can result in a treatment that either misses the tumor location or results in unintended under- or overdosages in localized regions for patients treated with VMAT or IMPT plans. It is therefore important to develop protocols for better patient stratification toward different motion mitigation strategies, daily motion monitoring and 4D optimized high precision radiotherapy.
Supplemental Material
Download MS Word (5.5 MB)Disclosure statement
In accordance with Taylor & Francis policy and my ethical obligation as a researcher, I am reporting that the department of Radiation Oncology of the University Medical Center has Research Agreements with IBA, Elekta, Siemens, Mirada and receives consultancy fees paid by IBA, outside the submitted work. I have disclosed those interests fully to Taylor & Francis.
References
- Wang J, Lin SH, Dong L, et al. Quantifying the interfractional displacement of the gastroesophageal junction during radiation therapy for esophageal cancer. Int J Radiat Oncol Biol Phys. 2012;83:e273–e280.
- Ling T, Slater J, Nookala P, et al. Analysis of intensity-modulated radiation therapy (IMRT), proton and 3D conformal radiotherapy (3D-CRT) for reducing perioperative cardiopulmonary complications in esophageal cancer patients. Cancers (Basel). 2014;6:2356–2368.
- Zhang X, Komaki R, Cox JD, et al. Four-dimensional computed tomography-based treatment planning for intensity-modulated radiation therapy and proton therapy for distal esophageal cancer. Int J Radiat Oncol. 2008;72:278–287.
- Welsh J, Gomez D, Palmer MB, et al. Intensity-modulated proton therapy further reduces normal tissue exposure during definitive therapy for locally advanced distal esophageal tumors: a dosimetric study. Int J Radiat Oncol Biol Phys. 2011;81:1336–1342.
- Chang JY, Li H, Zhu XR, et al. Clinical implementation of intensity modulated proton therapy for thoracic malignancies. Int J Radiat Oncol. 2014;90:809–818.
- Mayer S, Metzger R, Kluth D. The embryology of the diaphragm. Semin Pediatr Surg. 2011;20:161–169.
- Nason LK, Walker CM, McNeeley MF, et al. Imaging of the Diaphragm: anatomy and Radiographics. 2012;32:E51–71.
- Balter JM, Dawson LA, Kazanjian S, et al. Determination of ventilatory liver movement via radiographic evaluation of diaphragm position. Int J Radiat Oncol Biol Phys. 2001;51:267–270.
- Wang W, Li J, Zhang Y, et al. Correlation of primary middle and distal esophageal cancers motion with surrounding tissues using four-dimensional computed tomography. Onco Targets Ther. 2016;9:3705–3710.
- Allaix ME, Patti MG. Esophagus & diaphragm. In: Doherty GM, editor. Current Diagnosis & Treatment: Surgery. 14th ed. New York (NY): McGraw-Hill Eduation; 2015.
- Jin P, Hulshof MCCM, van Wieringen N, et al. Interfractional variability of respiration-induced esophageal tumor motion quantified using fiducial markers and four-dimensional cone-beam computed tomography. Radiother Oncol. 2017;124:147–154.
- Jin P, Hulshof MCCM, De Jong R, et al. Quantification of respiration-induced esophageal tumor motion using fiducial markers and four-dimensional computed tomography. Radiother Oncol. 2016;118:492–497.
- Liu F, Ng S, Huguet F, et al. Are fiducial markers useful surrogates when using respiratory gating to reduce motion of gastroesophageal junction tumors? Acta Oncol. 2016;55:1040–1046.
- Wang J-Z, Li J-B, Wang W, et al. Changes in tumour volume and motion during radiotherapy for thoracic oesophageal cancer. Radiother Oncol. 2015;114:201–205.
- Wang W, Li J, Zhan F, et al. Comparison of patient-specific internal gross tumor volume for radiation treatment of primary esophageal cancer based separately on three-dimensional and four-dimensional computed tomography images. Dis Esophagus. 2014;27:348–354.
- Lever FM, Lips IM, Crijns SPM, et al. Quantification of esophageal tumor motion on cine-magnetic resonance imaging. Int J Radiat Oncol Biol Phys. 2014;88:419–424.
- Yamashita H, Kida S, Sakumi A, et al. Four-dimensional measurement of the displacement of internal fiducial markers during 320-multislice computed tomography scanning of thoracic esophageal cancer. Int J Radiat Oncol Biol Phys. 2011;79:588–595.
- Patel AA, Wolfgang JA, Niemierko A, et al. Implications of respiratory motion as measured by four-dimensional computed tomography for radiation treatment planning of esophageal cancer. Int J Radiat Oncol Biol Phys. 2009;74:290–296.
- Yaremko BP, Guerrero TM, McAleer MF, et al. Determination of respiratory motion for distal esophagus cancer using four-dimensional computed tomography. Int J Radiat Oncol Biol Phys. 2008;70:145–153.
- Zhao KL, Liao Z, Bucci MK, et al. Evaluation of respiratory-induced target motion for esophageal tumors at the gastroesophageal junction. Radiother Oncol. 2007;84:283–289.
- Yamashita H, Haga A, Hayakawa Y, et al. Patient setup error and day-to-day esophageal motion error analyzed by cone-beam computed tomography in radiation therapy. Acta Oncol. 2010;49:485–490.
- Fukada J, Hanada T, Kawaguchi O, et al. Detection of esophageal fiducial marker displacement during radiation therapy with a 2-dimensional on-board imager: analysis of internal margin for esophageal cancer. Int J Radiat Oncol Biol Phys. 2013;85:991–998.
- Jin P, van der Horst A, de Jong R, et al. Marker-based quantification of interfractional tumor position variation and the use of markers for setup verification in radiation therapy for esophageal cancer. Radiother Oncol. 2015;117:412–418.
- Pandolfino JE, Zhang QG, Ghosh SK, et al. Transient lower esophageal sphincter relaxations and reflux: mechanistic analysis using concurrent fluoroscopy and high-resolution manometry. Gastroenterology. 2006;131:1725–1733.
- Knopf AC, Hong TS, Lomax A. Scanned proton radiotherapy for mobile targets-the effectiveness of re-scanning in the context of different treatment planning approaches and for different motion characteristics . Phys Med Biol. 2011;56:7257–7271.
- Pan X, Zhang X, Li Y, et al. Impact of using different four-dimensional computed tomography data sets to design proton treatment plans for distal esophageal cancer. Int J Radiat Oncol Biol Phys. 2009;73:601–609.
- Taylor PA, Kry SF, Followill DS. Pencil beam algorithms are unsuitable for proton dose calculations in lung. Int J Radiat Oncol Biol Phys. 2017;99:750–756.
- Rasbash J, Charlot C, Browne WJ, et al. MLwiN Version 2.22. Centre for Multilevel Modelling. University of Bristol; 2010.
- Huijskens SC, van Dijk IWEM, Visser J, et al. Predictive value of pediatric respiratory-induced diaphragm motion quantified using pre-treatment 4DCT and CBCTs. Radiat Oncol. 2018;13:198.
- Heethuis SE, Borggreve AS, Goense L, et al. Quantification of variations in intra-fraction motion of esophageal tumors over the course of neoadjuvant chemoradiotherapy based on cine-MRI. Phys Med Biol. 2018;63:145019.
- Doi Y, Murakami Y, Imano N, et al. Quantifying esophageal motion during free-breathing and breath-hold using fiducial markers in patients with early-stage esophageal cancer. Zhang Q, editor. PLoS One. 2018;13:e0198844.
- Abbas H, Chang B, Chen ZJ. Motion management in gastrointestinal cancers. J Gastrointest Oncol. 2014;5:223–235.