
 ?Mathematical formulae have been encoded as MathML and are displayed in this HTML version using MathJax in order to improve their display. Uncheck the box to turn MathJax off. This feature requires Javascript. Click on a formula to zoom.
Abstract
Introduction
Manual quality assurance (QA) of radiotherapy contours for clinical trials is time and labor intensive and subject to inter-observer variability. Therefore, we investigated whether deep-learning (DL) can provide an automated solution to salivary gland contour QA.
Material and methods
DL-models were trained to generate contours for parotid (PG) and submandibular glands (SMG). Sørensen–Dice coefficient (SDC) and Hausdorff distance (HD) were used to assess agreement between DL and clinical contours and thresholds were defined to highlight cases as potentially sub-optimal. 3 types of deliberate errors (expansion, contraction and displacement) were gradually applied to a test set, to confirm that SDC and HD were suitable QA metrics. DL-based QA was performed on 62 patients from the EORTC-1219-DAHANCA-29 trial. All highlighted contours were visually inspected.
Results
Increasing the magnitude of all 3 types of errors resulted in progressively severe deterioration/increase in average SDC/HD. 19/124 clinical PG contours were highlighted as potentially sub-optimal, of which 5 (26%) were actually deemed clinically sub-optimal. 2/19 non-highlighted contours were false negatives (11%). 15/69 clinical SMG contours were highlighted, with 7 (47%) deemed clinically sub-optimal and 2/15 non-highlighted contours were false negatives (13%). For most incorrectly highlighted contours causes for low agreement could be identified.
Conclusion
Automated DL-based contour QA is feasible but some visual inspection remains essential. The substantial number of false positives were caused by sub-optimal performance of the DL-model. Improvements to the model will increase the extent of automation and reliability, facilitating the adoption of DL-based contour QA in clinical trials and routine practice.
Introduction
Quality assurance (QA) is an integral part of radiotherapy (RT) clinical trials. However, after an initial evaluation of one or a limited number of cases from a participating center, contours from the remainder of their patients may not be reviewed. Furthermore, especially when there are many contours, not all contours are necessarily checked. Performing manual QA on clinical contours (CC) is time consuming and requires a substantial level of anatomical knowledge, significant investment of human and financial resources and may be influenced by the same inter-observer variability present in the contouring itself [Citation1]. Nevertheless, contour QA is likely to improve the validity and reliability of certain trial outcomes, including the relation between dose and toxicity [Citation2,Citation3], and it is made more important by the widespread use of highly conformal treatment techniques that increase the dosimetric impact of delineation errors [Citation4]. Effective automated contour QA could save time and money, overcome inter-observer variability and make it practical to assess contours in all study patients. Outside of trials, it could also facilitate verification of contours/contour in routine clinical practice [Citation5]. Recently, deep learning (DL)-based organ-at-risk (OAR) segmentation for treatment planning has been producing promising results, both with regard to quality and speed [Citation6–13]. Therefore, we investigated if DL-based contours (DC) could be used to perform automated QA on salivary gland contours in the clinical trial scenario. We used contours from patients in the multi-center EORTC-1219-DAHANCA-29-trial to test this approach.
Materials and methods
Data
This work was conducted with EORTC (European Organization for Research and Treatment of Cancer) approval and in accordance with local IRB (Institutional Review Board) requirements. The right parotid (PG) and submandibular (SMG) glands were considered. The in-house library used for training the DL-model, comprised 735 clinically delineated CT-scans of head and neck cancer (HNC) patients treated between January 2011 and December 2018. Data was not further curated. Symmetry was assumed for both glands [Citation14]. Therefore, all left glands were mirrored in the sagittal plane and added to the right gland data set, effectively doubling the amount of training data. There were 1418/1152 PG/SMG contours in total for training and testing the DL-model.
Additionally, we had available CT scans with OAR contours from 100 anonymized EORTC-1219-DAHANCA-29 trial (https://clinicaltrials.gov/ct/show/NCT01880359) patients, submitted by 13 centers. Trial QA included a benchmark case to assess contouring and planning prior to a center being included and a patient-specific QA program comprising prospective review of the first 5 cases from a site and retrospective evaluation of subsequent cases [Citation15]. CT scans from 62 patients with a definitive OAR structure-set, for whom we could be confident that transverse plane pixel spacing was consistent with in-house data, were used in this analysis. This resulted in a test-set with 124/69 PG/SMG contours.
The data consisted of DICOM files containing CT-images and structure-sets, with average pixel spacing of 1.00 ± 0.08 mm and 1.05 ± 0.14 mm and average slice thickness of 2.48 ± 0.17 mm and 2.43 ± 0.48 mm for in-house and EORTC images respectively. These were cropped to a region of interest (ROI) of size 96×64×64/64×64×32 voxels for PG/SMG. The ROI was calculated by creating a bounding box which at least encompassed all of the clinical contours in all 3 axes, while making sure the resulting dimensions could be divided by 2 multiple times to be able to use the convolution operator. A Hounsfield unit (HU) window with an upper/lower boundary of 330/–170 for PG and 190/–310 for SMG was applied, after which the data was normalized to [0,1].
Model
For the DL-model, a fully convolutional neural network (CNN) based on 3 D U-Net [Citation16] was used with Sørensen–Dice coefficient (SDC, defined below) as the loss-function and Adam [Citation17] as the optimizer. Dropout was applied to all convolutional layers to prevent overfitting. Two models were trained; one for PG and one for SMG segmentation, using the in-house data. Hyperparameters, including upper/lower HU window boundaries, were empirically determined in prior experiments [Citation13]. The models were built with Keras (http://keras.io/) on top of TensorFlow (https://www.tensorflow.org/). All calculations were done on two GeForce GTX 1080ti graphics processing units. With this set-up, creating a PG contour for 124 CT-scans took less than 2 s.
Evaluation
After applying the DL-model to a test-set there were two contours for each cropped image: the CC and the DL-derived DC. Similarity between these was assessed using (1) SDC, an overlap-based agreement metric ranging from 0 (no agreement on any voxels) to 1 (exact agreement on all voxels);
where
= True Positives,
= False Positives,
= False Negatives, and (2) the Hausdorff distance (HD), which is the largest minimal distance from any point from set A to any point from set B.
Experimental design
Experiment 1: Assessment of model performance
Before evaluating individual patient contours, it was assessed whether the model could reach levels of accuracy on multi-center EORTC-data similar to the single-center data it was trained on. Performance on in-house data was measured by applying cross-validation, reducing the possibility of chance findings. The number of folds was determined in such a way that the hold-out test-set of each fold was the same size as the EORTC set, allowing for a fair comparison between the two sets. This resulted in 11-fold cross-validation for PG (1294 training/124 test cases) and 16-fold for SMG (1083 training/69 test cases). For experiments 2 and 3 (below), a definitive model was trained on the entire in-house data set for each gland and EORTC data was used as test set.
Experiment 2: Investigating how the QA model responds to a deformed test-set
To investigate whether the approach of using DL-based segmentation with SDC and HD metrics could (in principle) detect sub-optimal contours, the model was first applied to the original trial data and then 3 different types of simple errors were introduced, each in gradually increasing increments, to effectively degrade the quality of the original trial contours: (1) CC expansion, (2) CC contraction and (3) CC displacement in all three axes. Expansion and contraction (magnitude determined by voxel dimensions) were increased in steps of 1 voxel in all directions by applying binary dilation/erosion [Citation18] 10 times iteratively; and displacement (in randomly determined directions) was increased from 1 to 10 voxels (in steps of 1).
Experiment 3: Visual inspection of cases highlighted by the DL-model as Sub-optimal
To qualitatively asses the models’ potential for QA, all cases in the test set flagged with low SDC/high HD were visually inspected by a radiation oncologist and medical physicist, to see whether ‘low agreement’ could be caused by a sub-optimal CC (i.e., sub-optimal at a clinically relevant level, so not at the level of 1–2mm disagreement, but for example, missing PG deep medial or anterior extension). A random sample, equivalent to the number of flagged cases, was also drawn from the non-flagged cases, to see whether these non-flagged CCs had been correctly identified as acceptable. Low agreement for ‘flagging’ purposes was defined using 2 thresholds: (1) below average SDC − 1 standard deviation (STD) and (2) above average HD + 1 STD.
Results
Experiment 1: The DL-model performed consistently on both datasets: PG SDC was 0.84 ± 0.08 and 0.83 ± 0.08 on the in-house and EORTC data respectively, and SMG SDC was 0.85 ± 0.09 and 0.85 ± 0.05; PG HD was 10.5 ± 5.6 and 11.3 ± 6.3 respectively and SMG HD was 6.0 ± 2.9 and 6.1 ± 2.4.
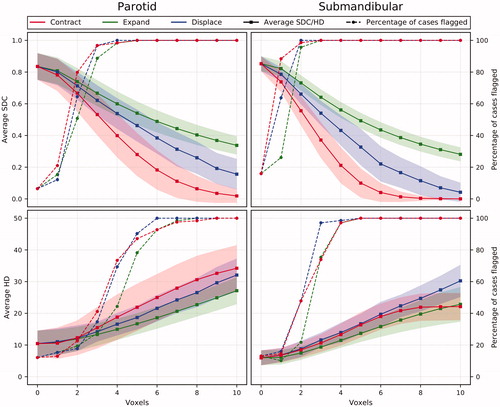
Experiment 2: An increase of all three types of deliberately induced errors led to a progressive reduction in average test-set SDC and increase in average HD (). In , contraction HD results are influenced by cases where CC cannot be contracted any further (i.e., CC had to consist of ≥1 voxel), which is why the curve flattens. The percentage of cases flagged as potentially sub-optimal by either threshold increases substantially for all errors on both organs. At 3 voxels, all errors have deteriorated the SMG CC quality enough to have them all flagged based on SDC-1STD.
Figure 1. The effect of deliberately induced errors on the average SDC and HD for the whole test-set for the PG and the SMG (shaded area = standard deviation) and on the percentage of cases being flagged by either SDC-1STD or HD + 1STD.
Experiment 3: shows the SDC and HD of all 124 PGs. For PG, the flagging threshold was 0.84–0.08 = 0.75 (average–1STD, rounded data) for SDC and 10.4 + 4.1 = 14.6 (average + 1STD, rounded data) for HD. 8/124 cases had SDC < 0.75; 15/124 had HD > 14.6 mm; and 4 cases satisfied both criteria, making a total of 19 cases (15%) flagged as potentially sub-optimal. On review, in 5/19 cases it was agreed that CC was clinically sub-optimal (26%). In the non-flagged sample, 2/19 cases were deemed clinically sub-optimal on review (11%) – see . As such, for flagging sub-optimal PG contours, the sensitivity of our method was 0.71 and the specificity was 0.55.
Figure 2. Scatterplot of 124 PGs showing SDC vs HD and the criteria for both metrics to mark cases for suspicion of sub-optimal quality. Red crosses are those contours that were actually deemed to be sub-optimal on review, black dots in the shaded areas are considered false positives, red crosses in the unshaded area are false negatives. Letters a-d refer to the respective images in .
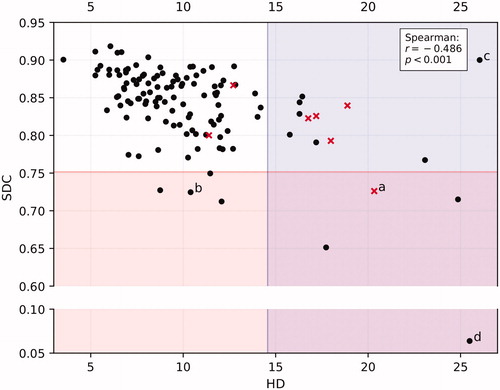
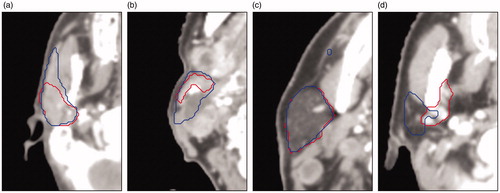
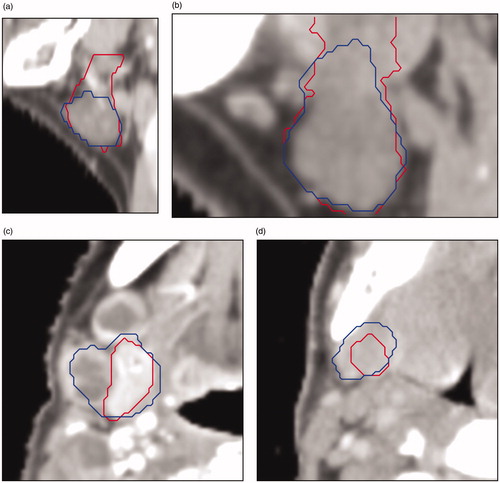
Figure 3. Four cases with low agreement between CC (in red) and DC (in blue) for the parotid gland. The cause for low agreement: (a) CC missed the anterior extension, (b) anatomical deviation because of cancerous lymph nodes pressing against the gland, (c) the DC incorrectly includes some voxels which result in a high HD, (d) anatomical deviation: exceptionally small parotid gland, for unknown reason.
shows SDC and HD for all 69 SMGs. For SMG, the flagging threshold was 0.85–0.05 = 0.80 (average–1STD, rounded data) for SDC and 6.0 + 2.4 = 8.3 (average + 1STD, rounded data) for HD. 11/69 cases had SDC < 0.80 and 9/69 HD > 8.3 mm. 5 cases were highlighted by both thresholds resulting in 15 (22%) cases deviating >1STD. On review, 7/15 CCs were actually deemed clinically sub-optimal (47%); in the non-flagged sample, 2/15 CCs were deemed clinically sub-optimal (13%) – see . As such, for flagging sub-optimal SMG contours, the sensitivity of our method was 0.78 and the specificity was 0.62. Causes of incorrectly being flagged were anatomical deviation degrading the DC for 4 PGs and 2 SMGs (e.g., displacement/deformation due to adjacent tumor), the DC missing the anterior extension in 1 PG and atypical data properties degrading the DC for 4 PGs and 4 SMGs (e.g., nonstandard CT slice thickness or missing data in the clinical contour). For 5 PGs and 2 SMGs, the cause of incorrectly being flagged could not be determined.
Figure 4. Scatterplot of 69 SMGs showing SDC vs HD and the criteria for both metrics to mark cases for suspicion of sub-optimal quality. Red crosses are those contours that were actually deemed to be sub-optimal on review, black dots in the shaded areas are considered false positives, red crosses in the unshaded area are false negatives. Letters a-d refer to the respective images in .
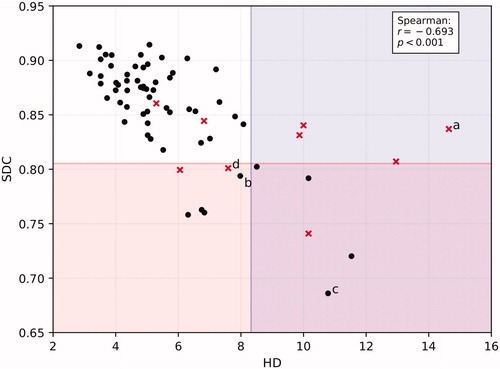
Figure 5. Four cases with low agreement between CC (in red) and DC (in blue) for the submandibular gland: (a) (sagittal plane) the CC encompasses to many slices in the upper part of the gland; (b) (sagittal plane) because of data properties (e.g., CT slice thickness) the gland does not fit inside the crop; (c) (transverse plane) anatomical deviation because of cancerous lymph nodes pressing against the gland; (d) (transverse plane) gland is difficult to distinguish from the surrounding tissue.
Discussion
DL for automated salivary gland contour QA using EORTC-1219-DAHANCA-29 data was investigated. In summary, (1) the DL-model, trained with in-house single-center data, achieved comparable performance when applied to the multi-center clinical trial data; (2) when the model was applied to original trial contours that had been progressively deformed with simple geometric errors, it led to increasing deterioration in average SDC and HD. All three types of deliberately induced errors deteriorated SDC and increased HD substantially. This was what should have happened and therefore, in this simple test, the model was behaving as expected; and (3) in the majority of cases, low agreement between the DL ‘QA’ contour and the CC could be attributed to a sub-optimal DL-based contour (i.e., the flag was a ‘false-positive’). However, the proportion of CCs deemed clinically sub-optimal on review was higher in the highlighted than in the non-highlighted sample. This underlines the ongoing need for human review, especially of flagged cases. Most clinical contours of the flagged cases were not considered sub-optimal. In general, cases were flagged because of atypical organ shape/size or atypical data properties. Increasing the variance in the training set and interpolating CT-data to match the slice thickness to that of the training data could potentially help to avoid flagging such cases.
Most of the work on automated QA has been concerned with plan quality [Citation19,Citation20] while not directly addressing the quality of the contours on which those plans are based. Nevertheless, there have been several studies into automated contour QA, using various model types. For example, Altman et al. [Citation5] made a knowledge-based model containing variables like size and shape. Similarly, Chen et al. [Citation21] used geometric attribute distributions models. Zhang et al. [Citation22] used texture-based features to identify pancreas contouring errors. Each of these three groups introduced artificial errors and reported high accuracy scores when their model was used to detect them. Furthermore, an approach in which mislabeled contours and contours of low quality were detected using groupwise conditional random forests and manually crafted features, showed promising results [Citation23]. The low-quality contours were identified by looking at the single-value output of a classification model, depicting to what extent the contour looked like the archetype the model had learned from the training library. Contrarily, our model made its own contour and compared it to the clinical one, making it a fundamentally different approach. As for deep learning-based methods, Rhee et al. [Citation24] used an approach similar to ours, but they focused on detecting errors in multi-atlas based automatically generated contours, rather than human-derived contours. Chen et al. [Citation25] used a ResNet [Citation26] to classify the quality of a breast cancer segmentation CNN’s output and predict the corresponding SDC. Like Rhee et al. [Citation24], however, this is QA of automatically generated contours, rather than human-derived ones like we did. None of these studies specifically investigated (DL) QA for clinical trials. Future research should investigate whether these methods and ours complement each other or fail for the same cases. If they complement each other, combining several of these methods may provide a robust and reliable framework for QA.
As long as DL-models and clinical contours are not completely error-free, using them for QA can never be entirely accurate. Even for cases in which the CC is clearly sub-optimal, a high SDC is still possible if the model makes similar ‘mistakes’ as the clinician. One important DL bottleneck, and also a potential reason for imperfections in a model, seems to be the quality of the training data. Our training data consists of a large set of clinical contours, that were not curated at ‘millimeter’ level, and were delineated over a period of 7 years by a number of different radiation oncologists/trainees. Nonetheless, our average SDC of 0.84 is well within the range of earlier published values for DL-based PG/SMG segmentation [Citation6–13] and higher than SDCs resulting from multiple clinicians contouring the same PG [Citation27]. It remains to be tested whether a highly curated dataset would result in a relevant increase in average SDC and decrease in false positives and negatives.
The authors acknowledge that the deliberately introduced errors are only partially representative of real-world contouring errors. Small amounts of contraction and expansion are realistic, because HU windowing influences the visually apparent size of the structure, but displacement of the entire contour is not particularly common. Instead, the missing or over-delineation of only a part of a structure is more likely to occur. Although SDC and HD were used to flag cases, the choice of the threshold and metric is subjective. Using a threshold based on the average performance on the test-set will highlight outliers. These cases tend to have a clear cause for low agreement and should be considered for careful visual inspection. By easing the threshold, more cases will be identified for inspection with the cause likely to be less clearly identifiable. The threshold for HD may seem far greater than is clinically relevant, but this is because the HD is not based on a comparison between a contour and the ground-truth, but rather on two contours that are inherently imperfect.
In general, we noticed that cases with similar SDCs could differ in perceived quality of the contours. This may be because the SDC is a volumetric similarity measure, whereas the observed quality of the contour may often be judged based on deviations with little volumetric impact (e.g., missing anterior extension of PG). Another limitation is that even though experienced persons judged the contours to determine if they were clinically sub-optimal, this judgment remains subjective. It remains the case that, especially on CT, these are not always easy structures to visualize and segment. Addition of MRI can sometimes help to resolve this. Our current DL-model is based solely on CT data. It is noteworthy that although all centers had been through a trial QA process, we still identified multiple cases where we considered that the CC could be improved. This both highlights the variation and subjectivity inherent in clinical contour review, and supports the need for high-quality automated QA. Although our DL method for QA did flag some false positive cases, it also flagged some of the cases with suboptimal CC, demonstrating that an automated DL QA tool can support a QA team to inspect the quality of contours.
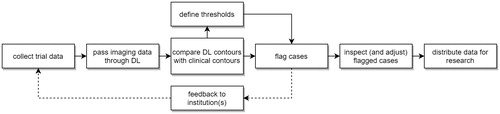
Such a QA tool could be used in several ways, all of which would be based around a comparison of DLD and clinical contours, with cases being flagged when a certain threshold difference was exceeded. So, for example: (1) a center submits clinical contours to a trial, DLD derived contours are used to immediately QA these, with feedback being provided right away to the submitting center. The DLD contours could be sent to the submitting center who could choose to use them, or the differences between manual and DLD contours could be highlighted and used to inform manual editing; (2) DLD based QA could be used to flag centers that submit too many contours that fail to pass QA; (3) The DLD QA tool could be used for retrospective analyses and other research purposes ().
Figure 6. Schematic overview of the workflow in clinical trials when QA of contours with the use of deep learning-based methods would be incorporated.
In conclusion, in this proof-of-concept study, we have shown that automated DL-based contour QA is technically feasible (creating a contour for 124 images took less than 2 s) and within reach. However, further improvements are needed: visual inspection remains essential, which is a barrier to full-automation. Also, even though the DL-model performed well within the range of earlier published values for DL-based PG/SMG segmentation, there were a substantial number of false positive flags due to sub-optimal performance of the DL-model. Continued improvement and an ability to handle ‘outlier’ cases will facilitate the routine use of DL-based contour QA.
Acknowledgments
We thank Varian Medical Systems for providing a research grant for this work.
Disclosure statement
The Department of Radiation Oncology of the Amsterdam UMC has a research collaboration with Varian Medical Systems, Palo Alto, CA, and Slotman and Verbakel have received honoraria/travel support from Varian Medical Systems. Overgaard is a member of the Editorial Board of Acta Oncologica. Gregoire and Overgaard are Principal Investigators of the EORTC trial.
Additional information
Funding
References
- Loo SW, Martin WMC, Smith P, et al. Interobserver variation in parotid gland delineation: a study of its impact on intensity-modulated radiotherapy solutions with a systematic review of the literature. Br J Radiol. 2012;85(1016):1070–1077.
- Weber DC, Poortmans PMP, Hurkmans CW, et al. Quality assurance for prospective EORTC radiation oncology trials: the challenges of advanced technology in a multicenter international setting. Radiother Oncol. 2011;100(1):150–156.
- Fairchild A, Bar-Deroma R, Collette L, et al. Development of clinical trial protocols involving advanced radiation therapy techniques: The European Organisation for Research and Treatment of Cancer Radiation Oncology Group approach. Eur J Cancer. 2012;48(7):1048–1054.
- Ahmad SS, Duke S, Jena R, et al. Advances in radiotherapy. BMJ. 2012;345:e7765.
- Altman MB, Kavanaugh JA, Wooten HO, et al. A framework for automated contour quality assurance in radiation therapy including adaptive techniques. Phys Med Biol. 2015;60(13):5199–5209.
- Nikolov S, Blackwell S, Mendes R, et al. Deep learning to achieve clinically applicable segmentation of head and neck anatomy for radiotherapy. 2018. arXiv:1809.04430
- Tong N, Gou S, Yang S, et al. Fully automatic multi-organ segmentation for head and neck cancer radiotherapy using shape representation model constrained fully convolutional neural networks. Med Phys. 2018;45(10):4558–4567.
- Močnik D, Ibragimov B, Xing L, et al. Segmentation of parotid glands from registered CT and MR images. Phys Med. 2018;52:33–41.
- Ren X, Xiang L, Nie D, et al. Interleaved 3D-CNNs for joint segmentation of small-volume structures in head and neck CT images. Med Phys. 2018;45(5):2063–2075.
- Fritscher K, Raudaschl P, Zaffino P, et al. Deep neural networks for fast segmentation of 3D medical images. In: Ourselin S, Joskowicz L, Sabuncu MR, Unal G, Wells W, editors. Medical image computing and computer-assisted intervention – MICCAI 2016. Cham: Springer International Publishing; 2016. p. 158–165.
- Zhu W, Huang Y, Zeng L, et al. AnatomyNet: deep learning for fast and fully automated whole-volume segmentation of head and neck anatomy. 2018. arXiv:1808.05238
- Ibragimov B, Xing L. Segmentation of organs-at-risks in head and neck CT images using convolutional neural networks. Med Phys. 2017;44(2):547–557.
- van Rooij W, Dahele M, Ribeiro Brandao H, et al. Deep learning-based delineation of head and neck organs-at-risk: geometric and dosimetric evaluation. Int J Rad Oncol Biol Phys. 2019;104(3):677–684.
- Stimec B, Nikolic S, Rakocevic Z, et al. Symmetry of the submandibular glands in humans-a postmortem study assessing the linear morphometric parameters. Oral Surg Oral Med Oral Pathol Oral Radiol Endod. 2006;102(3):391–394.
- Christiaens M, Collette S, Overgaard J, et al. Quality assurance of radiotherapy in the ongoing EORTC 1219-DAHANCA-29 trial for HPV/p16 negative squamous cell carcinoma of the head and neck: results of the benchmark case procedure. Radiother Oncol. 2017;123(3):424–430.
- Çiçek Ö, Abdulkadir A, Lienkamp SS, et al. 3D U-net: learning dense volumetric segmentation from sparse annotation. 2016. arXiv:1606.06650
- Kingma DP, Ba J. Adam: a method for stochastic optimization. 2014. arXiv:1412.6980.
- Haralick RM, Sternberg SR, Zhuang X. Image analysis using mathematical morphology. IEEE Trans Pattern Anal Mach Intell. 1987;9(4):532–550.
- Tol JP, Dahele M, Gregoire V, et al. Analysis of EORTC-1219-DAHANCA-29 trial plans demonstrates the potential of knowledge-based planning to provide patient-specific treatment plan quality assurance. Radiother Oncol. 2019;130:75–81.
- Kalet AM, Luk SMH, Phillips MH. Radiotherapy quality assurance tasks and tools: the many roles of machine learning. Med Phys. 2020;47(5):168–177.
- Chen H, Tan J, Dolly S, et al. Automated contouring error detection based on supervised geometric attribute distribution models for radiation therapy: a general strategy. Med Phys. 2015;42(2):1048–1059.
- Zhang Y, Plautz TE, Hao Y, et al. Texture-based, automatic contour validation for online adaptive replanning: a feasibility study on abdominal organs. Med Phys. 2019;46(9):4010–4020.
- McIntosh C, Svistoun I, Purdie TG. Groupwise conditional random forests for automatic shape classification and contour quality assessment in radiotherapy planning. IEEE Trans Med Imaging. 2013;32(6):1043–1057.
- Rhee DJ, Cardenas CE, Elhalawani H, et al. Automatic detection of contouring errors using convolutional neural networks. Med Phys. 2019;46(11):5086–5097.
- Chen X, Men K, Chen B, et al. CNN-based quality assurance for automatic segmentation of breast cancer in radiotherapy. Front Oncol. 2020;10:524.
- He K, Zhang X, Ren S, et al. Deep residual learning for image recognition. 2015. arXiv:1512.03385.
- Nelms BE, Tomé WA, Robinson G, et al. Variations in the contouring of organs at risk: test case from a patient with oropharyngeal cancer. Int J Radiat Oncol Biol Phys. 2012;82(1):368–378.