
Abstract
Introduction
Colorectal cancer (CRC) does not affect different sociodemographic groups uniformly. CRC screening programmes could seek to reduce this inequality; however, the screening programmes themselves might be subject to differential participation across sociodemographic groups. This study investigates the sociodemographic inequality at all steps in Denmark’s nationwide CRC screening programme: screening participation, faecal immunochemical test (FIT) results, colonoscopy compliance, CRC diagnosis, and cancer stage.
Material and methods
This cohort study includes all first-time invitees from the beginning of the Danish population-based CRC screening programme from 1 March 2014 to 31 December 2017.
Results
Sixty-four percent of the invitees participated in the screening programme, and of those 7% were FIT-positive. After being invited to further diagnostic procedures, 90% responded to the invitation, and among those 5% were CRC-positive. Among those diagnosed with CRC, 9% were stage IV. Through multivariable analyses, we identified sociodemographic inequalities in all steps of the screening programme from returning a stool sample to being diagnosed with CRC. Specifically, we identified inequalities across sex, age, migration status, relationship status, the screening status of one’s partner, education, income, and use of health services. Women were more likely to participate compared to men (RR = 1.13; 95% CI: 1.12–1.13), but had a lower risk of a positive FIT result (RR = 0.67; 95% CI: 0.66–0.68) and of a CRC diagnosis (RR = 0.88; 95% CI: 0.82–0.93) compared to men. The likelihood of participating as well as the risk of positive FIT results and CRC diagnosis increased with age.
Conclusion
All steps of the screening programme were subject to sociodemographic inequalities. Interventions are needed to target groups identified as having lower uptake as well as high-risk of being FIT- and/or CRC-positive. These groups include males, individuals aged 60+ years and individuals who do not visit their GP regularly.
Introduction
Colorectal cancer (CRC) is the second most commonly diagnosed cancer, as well as being the second leading cause of cancer death in Europe [Citation1]. CRC develops through a slow process where adenomas stepwise transform into adenocarcinomas. The progression from adenoma to cancer takes about 10–15 years, which makes it possible to intervene early and prevent the development of CRC [Citation2]. The Council of the European Union recommended CRC screening in 2003, which led to the implementation of regional and nationwide CRC screening programmes in the majority of the member states of the European Union [Citation3,Citation4]. These programmes seek to detect signs of CRC either through colonoscopy, sigmoidoscopy, or most often through the non-invasive procedure entitled faecal immunochemical test (FIT), which identifies the haemoglobin concentration in a stool sample [Citation4]. The FIT procedure has proved to be effective in detecting possible signs of CRC [Citation3,Citation5–7], hence detecting earlier-stage cancer and reducing CRC mortality. Thus, a Spanish study found that among people who were diagnosed with CRC in a screening programme using the FIT procedure, 90% was alive after five years of the time of diagnosis, while this was the case for only 67% of people with nonscreening-detected CRC [Citation8].
In Denmark, colon and rectum cancers are among the top five cancers with most social inequality in incidence and survival, and several studies indicate that these inequalities have widened over time [Citation9,Citation10]. The CRC screening programmes provide equal opportunity to access screening across all population groups; hence, a possible side effect of the screening programme could be a reduction in the social inequality in CRC through early detection of cancer in all population groups. However, this positive side effect is threatened by selective uptake, which has been identified across socioeconomic and demographic groups in previous studies [Citation11–14]. Moreover, additional aspects of the screening programmes could influence the overall inequality in CRC: specifically, little is known about the distribution of the screening outcomes (e.g., FIT results, cancer diagnosis, and cancer stage) among participants and therefore this warrants more attention in order to fully grasp the inequalities related to the screening programmes. If the screening outcomes are not equally distributed among participants it could be an indication that the screening programmes serve some population groups more efficiently than others. Consequently, the CRC screening programme could actually widen the sociodemographic inequality in CRC incidence and/or survival.
This study aims to explore sociodemographic (in)equalities in all steps of Denmark’s nationwide CRC screening programme. Specifically, we investigate inequalities across sociodemographic groups in terms of: participation, the risk of receiving a positive FIT result, compliance to further diagnostic procedures, and the risk of being diagnosed with CRC within the screening programme. Furthermore, we examine the distribution of cancer stage across sociodemographic factors in order to uncover whether the screening programme detects early-stage cancer in all population groups.
Material and methods
This study is a register-based retrospective cohort study using data from the Danish Colorectal Cancer Screening Database, the Danish Colorectal Cancer Group Database, the National Patient Registry, the National Health Insurance Service Registry, the Danish Civil Registration System register and social registries at Statistics Denmark.
Study population
The national CRC screening programme in Denmark invites all individuals in the age group 50–74 years to be screened. People are invited biennially. However, the first round was conducted over four years in 2014–2017, while the biennial invitations were introduced in the second screening round, which began during 2017. In this study, we included all first-time invitees, regardless of whether the invitation was received in the first or in the second screening round, from 1 March 2014 to 31 December 2017. We excluded individuals who had been diagnosed with CRC prior to the invitation (as most of these are enrolled in a cancer follow-up programme), as well as individuals diagnosed with Crohn’s disease and ulcerative colitis (as their participation depends on recommendations from their GP). Additionally, we excluded individuals who died before receiving the invitation and individuals who died or emigrated within three months of the invitation and did not participate.
Outcome measures
Five outcomes were addressed: participation, positive FIT test result, colonoscopy compliance, CRC diagnosis, and cancer stage at diagnosis. Participation was defined as returning a stool sample to the laboratory for testing at any point after receiving the invitation, however, at the latest on 31 December 2018. A positive FIT test was defined as a stool sample with high levels of haemoglobin defined as 100 ng/ml faeces (equal to 20 µg hgb./g faeces) [Citation15]. Colonoscopy compliance was defined according to the annual national report by the Danish Colorectal Cancer Screening Database as complying to further diagnostic procedures (colonoscopy, CT, or sigmoidoscopy) within two months of receiving a positive FIT test [Citation16]. Individuals who had a histologically verified diagnosis of CRC during these diagnostic procedures were identified as CRC cases within the screening programme. However, it is important to note that for some of these participants, several diagnostic procedures were conducted due to inconclusive results or various complications. As a consequence, some participants were not diagnosed until several months after the first procedure. Lastly, we used data from the Danish Colorectal Cancer Screening Database to determine cancer stage at the time of diagnosis using the UICC classification [Citation17].
Covariates
As covariates we included age, sex, regional residence, migration status, birth country, marital status, income, highest attained educational level, partner’s screenings status, and use of health services including consultations with a general practitioner (GP) or dentist. Birth country was split into three categories (1) Denmark, (2) other Western, and (3) non-Western. Marital status differentiates between being in a relationship and being single, whereas being in a relationship covers individuals who are married or in a cohabiting relationship. Income was divided into five categories: one for each income quartile, with the first quartile consisting of individuals with the lowest income; plus a category consisting of individuals with unknown income. Use of healthcare services (GP and dentist) was determined based on utilisation during the entire year prior to the time individuals were invited to screening and dichotomised into a binary variable with 0 consultations and 1+ consultations.
Statistics
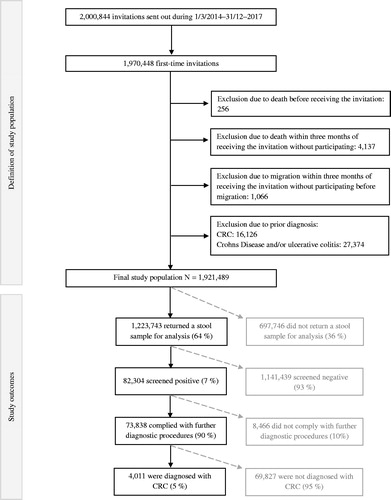
The distribution of population characteristics was examined according to participation using descriptive statistics. Incidence proportion, relative risk estimates, and confidence intervals (95% CI) for each outcome measure for each sociodemographic category were produced using multivariable logistic regression models. Estimates for each outcome were made at different stages in the screening process, hence estimates for participation were produced among all invitees (N = 1,921,489), estimates for positive FIT results were made among all participants (N = 1,223,743), estimates for colonoscopy compliance were recorded among all individuals with positive FIT results (N = 82,304) and estimates for CRC diagnosis were made among all who complied with further diagnostic procedures (N = 74,838). This is illustrated in . Moreover, we estimated the positive predictive value, which is often estimated in studies on CRC screening, to ensure comparability. These results are reported in Table S1. In the multivariable analyses, we adjusted all estimates for sex, age, education, and income. We examined the distribution of cancer stages among those with a known cancer stage at the time of diagnosis (N = 3,172) using a Chi-squared test to look into possible inequalities across socioeconomic and demographic factors. All statistical analyses were performed using R statistical software, version 3.5.0 (Vienna, Austria) [Citation18].
Figure 1. Flowchart of the study population.
Results
In total, 1,921,489 individuals were eligible for analysis (). The characteristics of the study population are presented in . The sexes were almost equally distributed with 49% males and 51% females. The largest proportion of the invitees were <54 years old, which is due to the ongoing policy of inviting people reaching the age of 50. In the first screening round, some individuals who were aged more than 74 years, which is the upper age limit to receive an invitation, were invited to participate, which may explain the higher proportion of individuals in the oldest age group (20%) than in some of the younger (e.g., 17% were 65–69 years). The minority were migrants (8%) and born outside of Denmark; 3% in other Western countries and 5% in non-Western countries. Additionally, the majority were married (69%). The highest-attained educational level was either secondary school (26%) or high school/skilled education (44%), whereas 4% had finished a short higher education, 17% a middle-length higher education, and 7% a long higher education. The majority of the invitees had visited their GP (88%) and/or dentist (70%) within the last year. Lastly, 40% of the invitees had a partner who participated in the screening programme, whereas 17% had a partner who did not participate. The remainder did not have a partner or had a partner not eligible for screening.
Table 1. Population characteristics.
Overall, 64% of the invitees (N = 1,223,743) participated by returning a stool sample for examination. Of those who participated, 7% received a positive FIT result (N = 82,304). After being invited to further diagnostic procedures due to a positive FIT result, 90% complied with the invitation (N = 74,838), and among those 5% (N = 4,011) were diagnosed with CRC. Out of the 4011 individuals who were diagnosed with CRC, 3172 (79%) were registered with a known UICC stage: 36% were diagnosed with stage I, 27% with stage II, 27% with stage III, and 9% with stage IV.
Social inequality across the screening programme
Women were more likely to participate in the screening programme (RR = 1.13; 95% CI: 1.12–1.13); however, they had a reduced risk of being FIT-positive (RR = 0.63; 95% CI: 0.66–1.68) and of being diagnosed with CRC (RR = 0.88; 95% CI: 0.82–0.93) compared to men (see and ). The likelihood of participating increased with age, where the 65–69 years old invitees were the most likely, with an RR of 1.21 (95% CI: 1.21–1.22). A similar increase with age was observed in regard to the risk of receiving a positive FIT result and the risk of being diagnosed with CRC. Invitees living in Region Zealand (RR = 0.92; 95% CI: 0.92–0.92) and the Capital Region (RR = 0.89; 95% CI: 0.89–0.89) were most unlikely to participate, and living in the Capital region was associated with a slightly reduced likelihood of colonoscopy compliance. Invitees living in Region Zealand had an increased risk of being diagnosed with CRC (RR = 1.15; 95% CI: 1.03–1.29).
Table 2. Multivariable analysis of the rates of participation and risk of a positive FIT test across socioeconomic and demographic groups.
Table 3. Multivariable analysis of the rates of compliance and risk of being diagnosed with CRC within the screening programme across socioeconomic and demographic groups.
Migrants were less likely to participate (RR = 0.92; 95% CI: 0.91–0.92), be FIT-positive (RR = 0.86; 95% CI: 0.84–0.89) or comply with further diagnostic procedures (RR = 0.96; 95% CI: 0.94–0.97) compared to Danish-born individuals. Participants born in non-Western countries had a reduced risk of 0.73 (95% CI: 0.73–0.76) of being FIT-positive and 0.77 (95% CI: 0.59–0.98) of being CRC-positive.
Singles were less likely to participate (RR = 0.82; 95% CI: 0.82–0.82), had an increased risk of being FIT-positive (RR = 1.17; 95% CI: 1.16–1.19), were slightly less likely to comply to further diagnostic procedures (RR = 0.95; 95% CI: 0.94–0.95), and had a reduced risk of being CRC-positive (RR = 0.85; 95% CI: 0.79–0.91) compared to individuals in a relationship. Those who had a partner who was also invited but did not participate were less likely to participate (RR = 0.53; 95% CI: 0.53–0.54), had an increased risk of being FIT positive (RR = 1.27; 95% CI: 1.25–1.30), were slightly less likely to comply to further diagnostic procedures (RR = 0.95; 95% CI: 0.94–0.95) and had a reduced risk of being CRC-positive (RR = 0.78; 95% CI: 0.70–0.87) compared to those whose partner did participate. Those whose partner was not invited to the screening programme were less likely to participate (RR = 0.81; 95% CI: 0.81–0.81).
Those with a short higher education were most likely to participate (RR = 1.10; 95% CI: 1.10–1.11), while those with unknown educational level were the least (RR = 0.89; 95% CI: 0.88–0.89). In regards to the risk of being FIT-positive, the risk reduced with higher educational level. There was no noteworthy difference in the likelihood of colonoscopy compliance and risk of a CRC diagnosis across educational levels. The likelihood of participating, complying to further diagnostic procedures and the risk of being diagnosed with CRC increased with higher income quartile, whereas the risk of being FIT-positive decreased.
In regard to use of healthcare, those who visited either their GP or dentist within the last year were more likely to participate. However, they were not, or only slightly more, likely to comply with further diagnostic procedures compared to individuals who did not see their GP or dentist. Individuals who visited their GP had an increased risk of being FIT-positive (RR = 1.16; 95% CI: 1.13–1.19) but a reduced risk of being CRC-positive (RR = 0.68; 95% CI: 0.61–0.76), whereas those who visited their dentist had a reduced risk of being FIT-positive (RR = 0.84; 95% CI: 0.85–0.85).
Cancer stage
Individuals diagnosed with CRC from Northern Jutland had the lowest levels of stage IV (6%), whereas individuals living in Southern Denmark had the highest (11%), which is reported in . Individuals with a secondary school educational level or a short-length higher educational level had the highest proportions of stage IV CRC, of 11% and 13%, whereas individuals with a long higher education or an unknown educational level had the lowest proportion of 5%. Furthermore, those with a long higher education or an unknown educational level had the highest proportion of stage I CRC, of 43% and 49%, respectively.
Table 4. Univariate analysis of the association between socioeconomic and demographic factors and cancer stage at the time of diagnosis.
Discussion
In this nationwide register-based study, we investigated sociodemographic inequality in several steps of the Danish population-based CRC screening programme. Overall, we identified patterns of inequality across sociodemographic factors in participation, FIT result, colonoscopy compliance, CRC diagnosis, and cancer stage at the time of diagnosis. We found sex differences across the screening programme, with women being more likely to participate but at lower risk of either a positive FIT result or a CRC diagnosis. The sex differences in participation are similar to findings in other studies [Citation11,Citation12,Citation19,Citation20]; however, a systematic review by Wools et al. [Citation21] found that being female was most often found to be a barrier for participation in CRC screening programmes. However, it is important to note that this systematic review investigated factors associated with CRC screening using any screening method, whereas the present study focuses solely on the FIT test used in the Danish programme. With regards to screening outcomes, we identified men as a high-risk population for negative screening outcomes (positive FIT results and CRC diagnoses). Our findings correspond to results from a Spanish study, where FIT results showed that men on average had markedly higher levels of haemoglobin in their faeces than women, and that almost twice as many CRC cases were diagnosed among men compared to women [Citation22]. Furthermore, this study found that the majority of advanced CRC cases were found among men, whereas we did not identify any sex differences in cancer stage [Citation22]. We found that the likelihood of participating in the CRC programme increased with age. These results are similar to those from other studies finding the lowest participation rates among the youngest age groups [Citation11,Citation12,Citation19,Citation20]. Additionally, we identified that the risk of being FIT-positive and CRC-positive increased with age as the risk was much higher among individuals in the oldest age groups. The increased risk of being FIT-positive and CRC-positive among men and persons of higher age may reflect inequalities in CRC incidence rather than inequalities in screening as these characteristics have been associated with a higher occurrence of CRC. In particular, the age effect on the development of CRC highlights the importance of the age-span in which people are invited to the screening. This age-span is determined based on the estimated risk of negative screening outcomes; hence, one could argue that the age-span should begin later than 50 years of age, which is the case in some other screening programmes where CRC screening starts at age 55 or 60 years. No conclusion to this discussion can be made based on results from the present study, however, the low participation rates among the youngest age groups and the higher risk of being FIT and CRC positive among the oldest age groups could support an increase of the lower age limit. Hence, this would likely make the programme more cost-effective.
We found that migrants, independent of country of origin, were less likely to participate or comply with further diagnostic procedures; however, only participants from non-Western countries had a difference in risk of being FIT- and CRC-positive compared with Danish-born individuals. Other studies [Citation11,Citation21,Citation23] have similarly found lower participation rates in CRC screening programmes among ethnic minorities, which could reflect lower health literacy levels among this group [Citation24]. Specifically for the Danish programme, invitations are sent out in Danish. Hence, the lower participation rates among migrants could be a result of language barriers.
Being in a relationship was found to affect the risk of screening participation and screening outcomes. We found that singles were less likely to participate or comply with further diagnostic procedures, which may suggest that social context affects one’s health behaviour. We investigated this further by looking into the screening status of one’s partner. As expected, we found that invitees whose partner was invited but did not participate had a lower participation rate and colonoscopy compliance, actually much similar to the estimates for those with no partner. Also, invitees whose partner was not invited to the screening had a lower participation rate. These findings support the general belief that behaviour is motivated by the behaviour of others, in particular of those who are close to the individual [Citation25]. Furthermore, a study conducted in the UK [Citation26] investigated the effect of being married on participation in a flexible sigmoidoscopy trial and found much higher participation rates among married adults, while inviting partners together increased participation even further.
In terms of socioeconomic background, we identified inequalities according to educational level and income. The likelihood of participating and complying with further diagnostic procedures increased with higher income quartile equally to findings in previous studies [Citation19,Citation21]. This may be an indication that those with higher income have a higher health literacy level and better health status overall. Individuals with lower income levels tend to have a higher risk of multimorbidity, which has been linked to non-compliance to diagnostic colonoscopy [Citation27]. Furthermore, we found a U-shaped curve in the association between educational level and participation. This association contradicts earlier findings, where lower educational level, but not higher, has been found to be associated with non-participation [Citation21]. However, a similar association has been observed in the Danish breast cancer screening programme [Citation28]. One explanation for this U-shaped curve may be that highly educated individuals follow the ongoing debate regarding harms and benefits of screening. Consequently, highly educated individuals may decline the invitation to screening. Moreover, lack of time due to competing time demands from occupational responsibilities among the highly educated may interfere with health behaviour.
Visiting one’s GP or dentist was associated with increased participation, which was expected. Regular use of healthcare services is an indication of health-seeking behaviour reflecting self-care, higher health literacy levels and improved access to recommendations for participating in for example, screening programmes [Citation29]. With regard to screening outcomes, the risks were different among those who visited their GP compared to those who visited their dentist. Visiting one’s GP was associated with increased risk of being FIT-positive, whereas visiting the dentist was associated with a reduced risk of being FIT-positive. Individuals visiting their GP could more likely experience symptoms or being ill of any kind, which might increase their risk of having blood in their faeces, which then could be detected during a FIT test. Individuals visiting their dentist, however, would just do so as a regular check-up.
Strengths and limitations
The main strength of this study is the wide coverage of data from the national Danish registries [Citation30–34]. These registries make it possible to link data across different registries and to include covariates with low risk of selection bias. We excluded only 2.5% of all first-time invitees according to our exclusion criteria, which limit the risk of selection bias. Some of the participants failed to provide a stool sample eligible for analysis. In these cases, the participants would receive another test kit in order to provide an adequate sample; however, some participants (N = 1135) did not deliver a second stool sample. These were categorised as participants, which could have a minor impact on our estimates. Another challenge is the fact that there is no deadline for participating. Most studies identify participation as returning a stool sample within three months of receiving the invitation. We did not include a deadline in our definition of participation; also, follow-up continued until December 2018 with the latest invitations being sent out in December 2017, which gave the invitees at least a year to participate. This means we might have categorised more invitees as participants than other studies, although our participation rate (64%) is similar to the findings of the official monitoring report [Citation35]. Furthermore, the distribution analysis of cancer stages is subject to an important limitation since 21% of the CRC cases did not have a registered stage defined by UICC. We therefore lack information on the distribution among this rather large proportion of the CRC cases, which likely has affected our results. Lastly, an important indicator when monitoring a CRC screening programme is the identification of interval cancers. This, however, was not possible as the Danish Colorectal Cancer Screening Database did not contain information on results from diagnostic procedures that were conducted outside of the screening program.
Conclusion
Sociodemographic inequalities exist in all steps of the screening programme from returning a stool sample to being diagnosed with CRC. Specifically, we identified sex and age inequalities across the CRC screening programme as well as inequalities in migration status, relationship status, the screening status of one’s partner, education, income, and use of health services. Results from the present study contribute to the existing evidence of social inequalities in cancer screening and may inform future screening programs as we identify subpopulations, who should be more efficiently targeted to ensure early detection of CRC. We identified men, individuals aged 60+ years, singles, individuals with low educational level and those with high income as high-risk subpopulations for being FIT positive and/or being diagnosed with CRC. Furthermore, we identified subpopulations with lower participation rates and lower colonoscopy compliance including men, the youngest age groups, migrants, singles, individuals with low and high educational level, low income, and individuals who do not visit their GP and dentist regularly. Generally, the screening programme should aim to increase the overall uptake as this will increase the value of the screening programme in terms of ensuring early detection of CRC cases. Based on our results, we argue that most efforts should be made to ensure high participation among those subpopulations at high risk of being FIT positive or being diagnosed with CRC. In particular, the programme should aim to ensure high colonoscopy compliance among those subpopulations who are more likely to be FIT positive.
This study uncovers the inequalities within the screening programme; however, the link between the screening programme and the cancer pathways when CRC cases are detected could also be subject to inequalities (e.g., waiting times for treatment). Future studies should investigate inequalities in this link as well as other aspects of the screening programme that this study does not investigate.
Supplemental Material
Download MS Word (18.5 KB)Acknowledgements
The authors thank the Danish Colorectal Cancer Screening Database for providing data on the CRC screening programme.
Disclosure statement
No potential conflict of interest was reported by the author(s).
Additional information
Funding
References
- Ferlay J, Steliarova-Foucher E, Lortet-Tieulent J, et al. Cancer incidence and mortality patterns in Europe: estimates for 40 countries in 2012. Eur J Cancer. 2013;49(6):1374–1403.
- Lash RH, Genta RM, Schuler CM. Sessile serrated adenomas: prevalence of dysplasia and carcinoma in 2139 patients. J Clin Pathol. 2010;63(8):681–686.
- Larsen MB, Njor S, Ingeholm P, et al. Effectiveness of colorectal cancer screening in detecting earlier-stage disease—a nationwide cohort study in Denmark. Gastroenterology. 2018;155(1):99–106.
- Bulliard J, Garcia M, Senore C, et al. Sorting out measures and definitions of screening participation to improve comparability: the example of colorectal cancer. Eur J Cancer. 2014;50(2):434–446.
- Rabeneck L, Rumble B, Thompson F, et al. Fecal immunochemical tests compared with guaiac fecal occult blood tests for population-based colorectal cancer screening. Can J Gastroenterol. 2012;26(3):131–147.
- Selby K, Levine EH, Doan C, et al. Effect of sex, age, and positivity threshold on fecal immunochemical test accuracy: a systematic review and meta-analysis. Gastroenterology. 2019;157(6):1494–1505.
- Tinmouth J, Lansdorp-Vogelaar I, Allison JE. Faecal immunochemical tests versus guaiac faecal occult blood tests: what clinicians and colorectal cancer screening programme organisers need to know. Gut. 2015;64(8):1327–1337.
- Rubio II, Arana-Arri E, Villares IP, et al. Participation in a population-based screening for colorectal cancer using the faecal immunochemical test decreases mortality in 5 years. Eur J Gastroenterol Hepatol. 2018;31:197–204.
- Dalton SO, Olsen MH, Johansen C, et al. Socioeconomic inequality in cancer survival changes over time. A population-based study, Denmark. Acta Oncol. 2019;58:1987–2013.
- Lyratzopoulos G, Barbiere JM, Rachet B, et al. Changes over time in socioeconomic inequalities in breast and rectal cancer survival in England and Wales during a 32-year period (1973–2004): the potential role of health care. Ann Oncol. 2011;22(7):1661–1666.
- Deding U, Henig AS, Salling A, et al. Sociodemographic predictors of participation in colorectal cancer screening. Int J Colorectal Dis. 2017;32(8):1117–1124.
- Artama M, Heinävaara S, Sarkeala T, et al. Determinants of non-participation in a mass screening program for colorectal cancer in Finland. Acta Oncol. 2016;55(7):870–874.
- Larsen MB, Mikkelsen EM, Rasmussen M, et al. Sociodemographic characteristics of nonparticipants in the Danish colorectal cancer screening program: a nationwide cross-sectional study. Clin Epidemiol. 2017;9:345–354.
- Saraste D, Öhman DJ, Sventelius M, et al. Initial participation as a predictor for continuous participation in population-based colorectal cancer screening. J Med Screen. 2018;25(3):126–133.
- Sundhedsstyrelsen [The Danish Health Authorities]. Dansk Tarmkraeftscreeningsdatabase Årsrapport 2014 [The Danish colorectal cancer screening database annual report 2014]; 2016. Available from: https://www.sundhed.dk/content/cms/45/61245_dts%C3%A5rsrapport-2014_8-1-16_final_inklbilag.pdf
- Rasmussen M, Andersen ABT, Njor SH, et al. Dansk tarmkraeftscreeningsdatabase årsrapport 2016: første 34 måneder af 1. Screeningsrunde [Danish colorectal cancer screening database, annual report: first 34 months of the first screening round]. Copenhagen (DK): Dansk Tarmkraeftscreeningsdatabase [Danish Colorectal Cancer Screening Database]; 2016.
- Enets.org [Internet]. Berlin (DE): The European Neuroendocrine Tumor Registry; 2019; [cited 2019 Sep 5]. Available from: https://www.enets.org/d.f.426.pdf
- R Core Team. R: a language and environment for statistical computing [statistical software]. Version 3.6.1. Vienna, Austria: R Foundation for Statistical Computing; 2019.
- Frederiksen BL, Jørgensen T, Brasso K, et al. Socioeconomic position and participation in colorectal cancer screening. Br J Cancer. 2010;103(10):1496–1501.
- Blom J, Kilpeläinen S, Hultcrantz R, et al. Five-year experience of organized colorectal cancer screening in a Swedish population – increased compliance with age, female gender, and subsequent screening round. J Med Screen. 2014;21(3):144–150.
- Wools A, Dapper EA, de Leeuw JRJ. Colorectal cancer screening participation: a systematic review. Eur J Public Health. 2016;26(1):158–168.
- Arana-Arri E, Idigoras I, Uranga B, et al. Population-based colorectal cancer screening programmes using a faecal immunochemical test: should faecal haemoglobin cut-offs differ by age and sex? BMC Cancer. 2017;17(1):1–13.
- Weller D, Coleman D, Robertson R, et al. The UK colorectal cancer screening pilot: results of the second round of screening in England. Br J Cancer. 2007;97(12):1601–1605.
- Ward M, Kristiansen M, Sørensen K. Migrant health literacy in the European Union: a systematic literature review. Health Educ J. 2019;78(1):81–95.
- Stafford M, von Wagner C, Perman S, et al. Social connectedness and engagement in preventive health services: an analysis of data from a prospective cohort study. Lancet Public Health. 2018;3(9):e438–e446.
- van Jaarsveld CHM, Miles A, Edwards E, et al. Marriage and cancer prevention: does marital status and inviting both spouses together influence colorectal cancer screening participation? J Med Screen. 2006;13(4):172–176.
- Thomsen MK, Rasmussen M, Njor SH, et al. Demographic and comorbidity predictors of adherence to diagnostic colonoscopy in the Danish Colorectal Cancer Screening Program: a nationwide cross-sectional study. Clin Epidemiol. 2018;10:1733–1742.
- Jensen LF, Pedersen AF, Andersen B, et al. Identifying specific non-attending groups in breast cancer screening – population-based registry study of participation and socio-demography. BMC Cancer. 2012;12:518–519.
- Soskolne V. Preventive health behaviors and physician visits: relevance to health inequality. Isr J Health Policy Res. 2015;4:9.
- Thomsen MK, Njor SH, Rasmussen M, et al. Validity of data in the Danish Colorectal Cancer Screening Database. Clin Epidemiol. 2017;9:105–111.
- Baadsgaard M, Quitzau J. Danish registers on personal income and transfer payments. Scand J Public Health. 2011;39(7 Suppl.):103–105.
- Jensen VM, Rasmussen AW. Danish education registers. Scand J Public Health. 2011;39(7 Suppl.):91–94.
- Pedersen CB. The Danish Civil Registration System. Scand J Public Health. 2011;39(7 Suppl.):22–25.
- Lynge E, Sandegaard JL, Rebolj M. The Danish National Patient Register. Scand J Public Health. 2011;39(7 Suppl.):30–33.
- Rasmussen M, Andersen ABT, Njor SH, et al. Dansk tarmkraeftscreeningsdatabase årsrapport 2017: nationale praevalens screeningsrunde [Danish colorectal cancer screening database, annual report: national prevalence screening round]. Copenhagen (DK): Dansk Tarmkraeftscreeningsdatabase [Danish Colorectal Cancer Screening Database]; 2017.