
 ?Mathematical formulae have been encoded as MathML and are displayed in this HTML version using MathJax in order to improve their display. Uncheck the box to turn MathJax off. This feature requires Javascript. Click on a formula to zoom.
Abstract
Background
In radiotherapy (RT) of lung cancer, dose to functional lung (FL) volumes segmented with two different methods (perfusion SPECT (Q-SPECT) and 4D-CT (4D) ventilation (V)) have been shown to correlate with the incidence of radiation pneumonitis (RP). This study aims to compare the FL volumes identified by both methods.
Material and methods
Thirty lung cancer patients had a 4D and Q-SPECT prior to treatment. Seventeen of these patients also had a ventilation SPECT (V-SPECT). FL sub-volumes were segmented automatically, using cut-off values. The volumes were compared in terms of overlap fraction (OF) relative to the minimal volume, and intersection fraction (IF) of the FL volume relative to the total lung volume (VLung).
Results
Cut-off values suggested in literature for Q-SPECT and 4D-V resulted in volumes differing in size by a median 18% [6%;31%], and a median OF and IF of 0.48 [0.23;0.70] and 0.09 [0.02;0.25], respectively. Segmenting volumes of comparable size of about 1/3 of VLung (FL-m(1/3), m = method) resulted in a median OF and IF of 0.43 [0.23;0.58] and 0.12 [0.06;0.19], respectively. Twenty-five patients (83%) had a reasonable overlap between FL-Q(1/3) and FL-4D-V(1/3) volumes, with OF values above 0.33. IF increased significantly (p = .036) compared to using fixed cut-off values. Similarly, volumes of comparable size of about 1/3 VLung were produced for V-SPECT, and FL-Q(1/3), FL-V(1/3), and FL-4D-V(1/3) were compared. The overlaps and intersections of FL-V(1/3) with FL-Q(1/3) volumes were significantly (p<.001) larger than the corresponding overlaps and intersections of FL-Q(1/3) with FL-4D(1/3) and FL-V(1/3) with FL-4D(1/3).
Conclusion
The Q-SPECT and 4D-V methods do not segment entirely the same FL volumes. A reasonable overlap of the volumes along with the findings of other studies that both correlate to RP incidence, suggests that a combination of both volumes, e.g. using the IF, may be useful in RT treatment planning.
Introduction
Chemotherapy combined with radiotherapy (cRT) is the standard treatment for locally advanced non-small cell lung cancer (NSCLC). However, frequent local recurrences (25–35%) and five-year survival rates of 30–35%, necessitate more aggressive treatment strategies [Citation1–3]. Possibilities are limited, however, as cRT in its current form results in grave toxicities in many patients. The most prominent is radiation pneumonitis (RP) having severe effect on the quality of life for the patient and being potentially lethal [Citation2,Citation4,Citation5].
The treatment planning strategies used in clinical routine are based on limiting the dose to the entire lung, regardless of verifiable inhomogeneous regional air and blood flow, i.e. lung function. It has been shown that radiation of non-perfused regions contributes less to radiation induced damage than radiation of well-perfused regions [Citation6]. A reduction in RP may thus be achieved by actively avoiding the best functioning volumes of the lung [Citation7,Citation8]. This idea has been investigated in many studies focusing either on regional perfusion (Q) or regional ventilation (V) of the lungs to identify the functional lung (FL) volume [Citation9–15].
The clinical gold standard for determining regional lung function is ventilation/perfusion single-photon emission computed tomography (V/Q-SPECT), a well-established nuclear medicine modality using inhaled and injected radioisotopes to measure pulmonary air flow and blood flow, respectively [Citation16,Citation17]. However, the inhaled macromolecules used in ventilation SPECT (V-SPECT) examinations tend to cause clumping in the airways, exaggerating the functionality of the voxels in these regions [Citation18,Citation19]. One prevalent method for correlating the incidence of RP to the dose to the FL therefore uses Q-SPECT solely as the modality to define FL [Citation9,Citation10]. The work by Farr et al. showed strong correlation between dose to the FL as defined by Q-SPECT and the risk of RP.
Another method to define the FL volume extracts pulmonary ventilation information from 4D-CT scans routinely acquired for RT planning, thus avoiding the additional radiation dose from the nuclear medicine examination. A ventilation map (V-map) of the lungs is generated from the breathing cycle phases of a 4D-CT either by deformable registration [Citation11–13] or by comparison of the Hounsfield units (HU) of corresponding regions of lung tissue [Citation15,Citation17]. Both methods have been shown to produce ventilation FL volumes that are more predictive of RP than the total lung [Citation14,Citation15], indicating that dose sparing of well-ventilated lung volumes also impacts the risk of RP. Hereby, Q-SPECT and 4D-CT V-maps both predict a correlation between FL volumes and RP. Treatment planning may take this into account by selecting beam angles avoiding FL [Citation20]. However, no studies have compared the FL regions obtained by Q-SPECT and 4D-CT in order to investigate if the two methods point at identical regions. Additionally, no consensus exists on the choice of the best modality [Citation20].
In the present study, we have compared FL volumes obtained from Q-SPECT and 4D-CT to determine if the methods identify overlapping functional volumes. The aim was to identify regions in the lungs having high perfusion and high ventilation making these regions objects for decreased radiation dose. Additionally, FL volumes obtained from V-SPECT and 4D-CT were compared.
Material and methods
Patients and pre-treatment scans
Thirty consecutive NSCLC patients undergoing standard treatment of 60–66 Gy in 30–33 fractions were selected for this study. The patients were included in a prospective trial and details on patient characteristics, scanning and treatment planning have formerly been described [Citation9,Citation10]. In brief, all patients had a Q-SPECT and a 4D-CT scan prior to RT treatment. Seventeen of the patients additionally had a V-SPECT. All images were acquired with the patient immobilized in supine position with arms above the head while breathing freely.
The thoracic SPECT scans were obtained on a dual-head SPECT-CT camera with a low-energy-high-resolution collimator (Siemens Symbia T 16, Siemens Healthcare GmbH, Erlangen, Germany) with pixel size 9.6 × 9.6 mm, matrix size 64×64 pixels, 5 s/view and 128 projections. The associated CT scan (AC-CT) (110 kV, 40 mAs) had a pixel size of 9.8×9.8 mm, and slice thickness 5 mm. The scans were acquired in median one day before treatment start with a range of 11 days before and three days after treatment start. In patients for whom both SPECT scans were acquired, V-SPECT was imaged just before the Q-SPECT scan in the same frame of reference. The V-SPECT patients inhaled an aerosol of 35 MBq 99mTc-labelled solid graphite particles (Technegas, Dupharma, Kastrup, Denmark) in sitting position. After approximately 15 min the patients were imaged in the supine position. Immediately before the Q-SPECT scan the patients were injected with 200 MBq 99mTc macro-aggregated albumin (MAASOL, GE Healthcare, Milan, Italy). The duration of each of the scans was approximately 20 min.
The pre-treatment 4D-CT scan (Philips Brilliance™ CT Big Bore, Philips Healthcare, Amsterdam, Netherlands, with Varian RPM system, Varian Medical Systems, Palo Alto, CA, USA) with voxel size 1.17×1.17×3 mm, 512×512×97 voxels, encompassed the entire thoracic region and the images were binned into 10 respiratory phases. The inhale (4Dinhale) and exhale (4Dexhale) phases were selected based on a visual inspection of the diaphragm motion throughout the 4D-CT motion loop, so that the lung volume on 4Dinhale would always be the largest and the lung volume on 4Dexhale would be the smallest of the 10 phases. The scan was acquired a median [range] 8 [0,18] days before the SPECT scan.
Functional lung segmentation
For Q-SPECT, the FL volumes were defined as the voxels within the total lung volume, VFL-Q(x%), with values exceeding a threshold x of 20%, 30%, 40%, 50%, 60%, 70%, and 80% of the maximum perfusion counts, giving the largest volume for the smallest value of x. For V-SPECT, the best functioning third of the lungs was segmented (VFL-V(1/3)). The total lung volume (VLung) (excluding the visible tumor) was defined on the associated AC-CT scan, and VFL-V(1/3) was segmented using patient individual threshold values resulting in FL volumes of approximately 1/3 VLung.
For the 4D-CT scans, the FL volumes were calculated following the methodology of Vinogradskiy et al. [Citation14,Citation21]. VLung was segmented on the 4Dexhale (VLung-ex) phase of the 4D-CT. 4Dinhale (source image) and 4Dexhale (target image) were deformably registered using a free form intensity based deformable image registration (DIR) algorithm (MIMv6.7, MIM Software Inc., Cleveland, OH, USA), focusing on the thoracic region. The precision of the deformation in the thoracic region has been reported by Piper et al. [Citation22]. The Jacobian determinant of the deformation vector field (JDVF) was calculated. The JDVF ventilation map describes the ratio of local volume change in the deformed image, and values above 1 indicate an expansion from the target to the source image. For JDVF above 1 within the VLung-ex, multiple functional sub-volumes, VFL-4D(y%), were segmented by including voxels with a value of JDVF above a threshold y of 5%, 10%, 16%, 20%, 30%, 40%, 50%, and 60% of the maximum JDFV value, giving the largest volume for the smallest value of y. The threshold value was calculated as y(JDVFmax – 1) + 1. The 16% threshold was included as this was the threshold identified by Faught et al. as the value most predictive of RP [Citation15]. Additionally, for the 17 patients who also had a V-SPECT, the best ventilated third of the lung was segmented (VFL-4D(1/3)) similarly to VFL-V(1/3). The volumes of all segmented regions were determined.
Comparison of FL volumes between modalities
Volume comparison was performed using the mid-ventilation (mv) phase of the 4D-CT scan. Therefore, the V-SPECT and Q-SPECT images were deformably registered to the 4D-CT image using the AC-CT image. The DIR algorithm used for producing the 4D-CT V-map was used. All segmented VFL-V(1/3) and VFL-Q(x%) contours were propagated to the 4D-CT image. The VFL-4D were deformably propagated to the mv-phase.
The volume ratio, RFL-m(x%;y%), between the FL and VLung for each modality m was determined as:
for threshold x or y and Vlung determined on the 4D-CT scan.
The FL volumes obtained by Q-SPECT were compared to the FL volumes obtained by 4D-CT using the overlap fraction (OF), OFFL-Q(x%)4D(y%), defined as [Citation23]:
evaluating the overlap compared to the smallest of the two segmented volumes.
The OF was calculated in all patients for x = 40% and y = 16%, being the values formerly shown to predict RP [Citation9,Citation10,Citation15]. Various recommendations for a Q-SPECT cut-off value can be found in literature, but as this patient cohort was a part of the cohort studied by Farr et al., x = 40% was chosen.
Additionally, the intersection between FL volumes in Q-SPECT and 4D-CT was determined as a fraction of VLung:
The absolute FL volumes obtained for x = 40% and y = 16% may differ considerably. Therefore, comparison of FL volumes of nearly identical size for each patient was also made. For Q-SPECT and 4D-CT, values of x and y segmenting approximately 1/3 of VLung (1/3 VLung) were selected for each patient, followed by calculation of OFFL-Q(1/3)4D(1/3) for all patients. For patients where no segmented volumes were close to 1/3 VLung by use of the preselected values for x and y for one or both modalities, comparable sized segmented volumes closest to 1/3 VLung were selected.
In all patients with V-SPECT scans, VFL-V(1/3) was compared to VFL-4D(1/3), calculating OFFL-V(1/3)4D(1/3), and IFFL-V(1/3)4D(1/3). Furthermore, the FL volumes of Q-SPECT and V-SPECT were compared. For Q-SPECT, the already segmented volume identifying approximately 1/3 VLung was used. Both OFFL-Q(1/3)V(1/3) and IFFL-Q(1/3)V(1/3) were calculated.
Statistics
Differences in R, OF and intersection fraction (IF) between the three modalities were pairwise investigated with a Mann–Whitney U test for continuous variables using Matlab (Version 2019a, The Mathworks Inc., Natick, MA, USA). p < .05 was considered statistically significant.
Results
The cut-off values of x = 40% for Q-SPECT and y = 16% for 4D-CT produced volume ratios of widely different sizes: the median [range] RFL-Q(40%) and RFL-4D(16%) was 0.39 [0.09;0.57] and 0.25 [0.06;0.43], respectively. RFL-Q(40%) was significantly (p = .0053) larger than RFL-4D(16%). Within each patient, the volumes differed by a median of 0.18 [0.06;0.31] with VFL-Q(40%) being the largest in 21 patients (70%) and VFL-4D(16%) the largest in nine patients (30%).
For all patients, values of RFL-Q(40%), RFL-4D(16%), OFFL-Q(40%)4D(16%), and IFFL-Q(40%)4D(16%) are shown in . The median [range] OFFL-Q(40%)4D(16%) and IFFL-Q(40%)4D(16%) were 0.48 [0.23;0.70] and 0.09 [0.02;0.25], respectively. In 11 patients (37%), R was less than 0.2 for one or both modalities, leading to IF values less than 0.1. However, in three of these patients, the OF was larger than 0.5 due to the smaller of the two segmented volumes being mostly contained in the larger volume. This is illustrated in for patient 2. On the other hand, if a small volume was segmented by both modalities, only minor overlap was obtained as seen for patient 20 (see ). Another six (20%) patients had IF values less than 0.1 even though R was more than 0.2 for both modalities. For these patients, OF values were never above 0.5, indicating that different functional volumes were found by the two methods.
Figure 1. Comparison of 4D-ventilation to Q-SPECT. Patients 9 and 25 have had one lung removed. (a) Volume ratios RFL-Q(40%) and RFL-4D(16%) and (b) overlap fraction OFFL-Q(40%)4D(16%) and intersection fraction IFFL-Q(40%)4D(16%). (c) Ratios RFL-Q(1/3) and RFL-4D(1/3), and (d) overlap fraction OFFL-Q(1/3)4D(1/3) and intersection IFFL-Q(1/3)4D(1/3). For some patients with very inhomogeneous functionality, a volume close to 1/3 of the total lung volume was not segmented. The highest volume giving comparable volumes with the two modalities was selected.
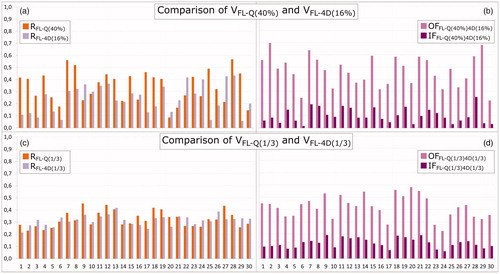
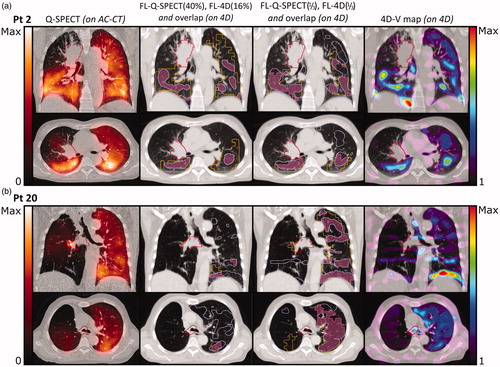
Figure 2. Frontal and transversal planes of (from left to right): AC-CT with Q-SPECT (orange hues), showing values from 0 to maximum counts; 4D-CT with overlay of functional volumes VFL-Q(40%) (orange) and VFL-4D(16%) (light purple), and the overlap between the two (pink); 4D-CT with overlay of functional volumes VFL-Q(1/3) (orange) and VFL-4D(1/3) (light purple), and the overlap between the two volumes (pink); 4D-CT with 4D-CT V-map (rainbow heat map) showing Jacobian values from 1 to maximum value. Primary tumor in red. (a) Patient 2. The cut-off values of 40% for Q-SPECT and 16% for 4D-CT produce volumes of very different size, RFL-Q(40%) is 0.41 and RFL-4D(16%) is 0.12, with OFFL-Q(40%)4D(16%) = 0.70 and IFFL-Q(40%)4D(16%) = 0.09. OFFL-Q(1/3)4D(1/3) is 0.45 and IFFL-Q(1/3)4D(1/3) = 0.10. (b) Patient 20. RFL-Q(40%) is 0.09 and RFL-4D(16%) is 0.13, with OFFL-Q(40%)4D(16%) = 0.37 and IFFL-Q(40%)4D(16%) = 0.03. OFFL-Q(1/3)4D(1/3) = 0.58 and IFFL-Q(1/3)4D(1/3) = 0.15.
Volume ratios of segmentations of approximately 1/3 VLung are shown for all patients in . No statistical difference (p = .88) was seen between RFL-Q(1/3) and RFL-4D(1/3). The OFFL-Q(1/3)4D(1/3) and IFFL-Q(1/3)4D(1/3) are shown in . Median values were 0.43 [0.23;0.58] and 0.12 [0.06;0.19], respectively. As the OF was normalized to the minimum of the two volumes, OF decreased compared to OFFL-Q(40%)4D(16%) when approximately 1/3 Vlung was segmented, as this generally led to larger, but more inter-patient comparable, minimum volumes, without including too much noise from low-functioning lung areas. Twenty-five patients (83%) had a reasonable overlap between volumes, with OF values above 33%. IFFL-Q(1/3)4D(1/3) increased significantly (p = .036) compared to IFFL-Q(40%)4D(16%), and only seven patients (23%) had IF values below 0.1. This increase is illustrated for both patient cases in , where Q-SPECT and 4D-CT both identify large coherent areas of FL, with high OFFL-Q(1/3)4D(1/3) values of 0.45 and 0.58, and IFFL-Q(1/3)4D(1/3) values of 0.19 and 0.17, respectively, showing good overlap between the segmented regions of the two modalities. In five patients (17%), OFFL-Q(1/3)4D(1/3) was less than 33% due to a low overlap between the FL segmented by Q-SPECT and 4D-CT. The low OFFL-Q(1/3)4D(1/3) resulted from a low breathing amplitude giving a noisy 4D-CT V-map and patchy FL4D(1/3) volumes (four patients), and large breathing amplitude and motion artifacts (one patient), negatively affecting the deformable registration (see Supplementary material).
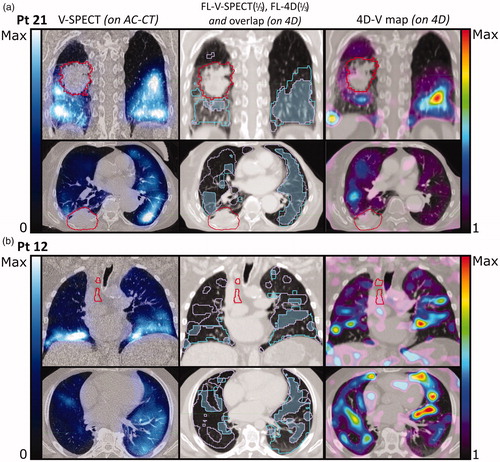
For the 17 patients who received V-SPECT and 4D-CT, values for RFL-V(1/3), RFL-4D(1/3), OFFL-V(1/3)4D(1/3), and IFFL-V(1/3)4D(1/3) are shown in , respectively. Comparison of VFL-V(1/3) and VFL-4D(1/3) resulted in median [range] OFFL-V(1/3)4D(1/3) of 0.38 [0.27;0.69] and IFFL-V(1/3)4D(1/3) of 0.13 [0.08;0.20]. The OF and IF values between FL-4D and FL-V were not significantly different (p = .55 and p = .41, respectively). Segmentations of FL-V(1/3) and FL-4D(1/3) in two patients are shown in . For patient 21 (), both methods identify large contiguous areas of high functionality, with an OFFL-V(1/3)4D(1/3) of 0.69 and IFFL-V(1/3)4D(1/3) of 0.20, and agree on a low functionality of the upper right lung near the tumor. On the contrary, for patient 12 (), OFFL-V(1/3)4D(1/3) is 0.30 and IFFL-V(1/3)4D(1/3) is 0.10, as both methods find only dispersed areas of high functionality. This indicates a generally low functionality, and both methods are likely influenced by noise in the functional images.
Figure 3. Comparison of 4D-V to V-SPECT. Seventeen patients with a V-SPECT scan are shown (patients 1–4, 6–15, and 19–21). Patient 9 has had one lung removed. (a) Ratios RFL-V(1/3) (cyan) and RFL-4D(1/3) (light purple) and (b) overlap fraction OFFL-V(1/3)4D(1/3) (light blue), and intersection IFFL-V(1/3)4D(1/3) (dark blue).
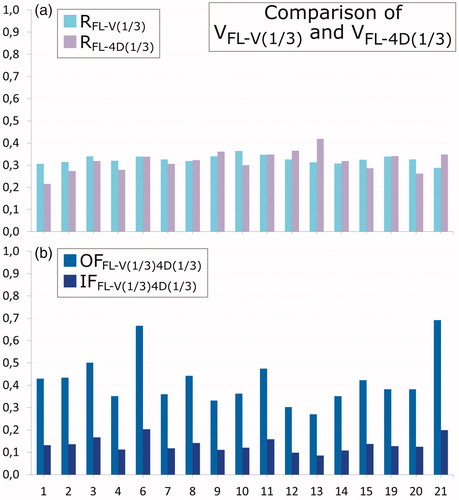
Figure 4. Frontal and transversal planes of (from left to right): AC-CT with V-SPECT (blue hues), showing values from 0 to maximum counts; 4D-CT with overlay of functional volumes VFL-V(1/3) (cyan) and VFL-4D(1/3) (light purple), and the overlap between the two (blue); 4D-CT with 4D-CT V-map (rainbow heat map) showing Jacobian values from 1 to maximum value. Primary tumor in red. (a) Patient 21. OFFL-V(1/3)4D(1/3) is 0.69 and IFFL-Q(1/3)4D(1/3)=0.20. (b) Patient 12. OFFL-V(1/3)4D(1/3) is 0.44 and IFFL-Q(1/3)4D(1/3)=0.14. In both modalities, the functional images have a high level of noise.
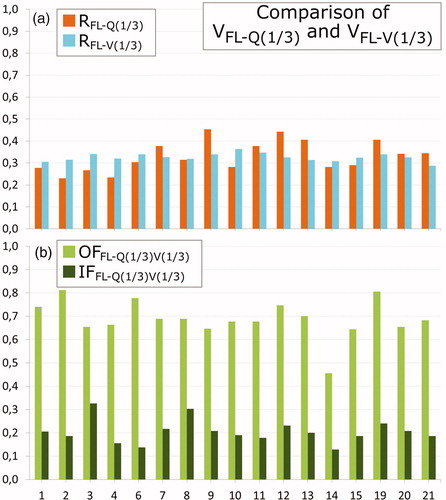
Finally, shows RFL-V(1/3), RFL-Q(1/3), OFFL-V(1/3)Q(1/3), and IFFL-V(1/3)Q(1/3) for the same 17 patients, with a median [range] OFFL-V(1/3)Q(1/3) of 0.68 [0.46;0.81] and IFFL-V(1/3)Q(1/3) of 0.20 [0.13;0.31]. The overlaps and intersections of FL-V(1/3) with FL-Q(1/3) volumes were significantly (p < .001) larger than the corresponding overlaps and intersections of FL-Q(1/3) with FL-4D(1/3) and FL-V(1/3) with FL-4D(1/3).
Figure 5. Comparison of Q-SPECT to V-SPECT. Seventeen patients with a V-SPECT scan are shown (patients 1–4, 6–15, and 19–21). Patient 9 has had one lung removed. (a) Ratios RFL-Q(1/3) (orange), RFL-V(1/3) (cyan); (b) overlap fraction OFFL-Q(1/3)V(1/3) (green) and intersection IFFL-Q(1/3)V(1/3) (dark green).
Discussion
The inclusion of functional information has been shown to correlate with the risk of RP in former studies [Citation9,Citation10,Citation15]. The functional information on perfusion and/or ventilation may be obtained from several imaging modalities including SPECT, MRI, PET, and 4D-CT [Citation20].
In this study, we aimed at investigating if two techniques, SPECT and 4D-CT, pointed at the same regions. We compared the overlap in FL volumes obtained from perfusion using Q-SPECT and ventilation using 4D-CT. Cut-off values of 40% for Q-SPECT and 16% for 4D-CT, formerly shown to be predictive for RP [Citation9,Citation10,Citation15], resulted in significantly larger FL volumes segmented by Q-SPECT, and 37% of the patients had less than 20% of the lung identified as functional by one or both methods. The median OFFL-Q(40%)4D(16%) was 0.48 [0.23;0.70], and IFFL-Q(40%)4D(16%) was 0.09 [0.02;0.25], meaning that 9% of VLung was found to be functional by both methods. Seventeen patients had an IF value below 0.1.
Functional volumes were determined using the total lung volume. This was chosen despite the potential inhomogeneous functionality between the ipsilateral and contralateral lung induced, e.g. by the tumor itself, as current RT planning strategies are based on limiting the dose to the entire lung, regardless of verifiable inhomogeneous functionality. As no consensus exists on the cut-off values [Citation20], we further segmented approximately 1/3 VLung for both modalities. This fraction was chosen to obtain reasonably large inter-modality, intra-patient comparable functional volumes, which could be used for treatment planning based on FL avoidance. Furthermore, the median RFL-Q(40%) and RFL-4D(16%) were 0.39 [0.09;0.57] and 0.25 [0.06;0.43], respectively. Thus, RFL-Q(40%) and RFL-4D(16%) segment FL volumes of different sizes. A value of 1/3 for both modalities secures segmentation of identical volumes with a ratio in-between RFL-Q(40%) and RFL-4D(16%). Hereby, more inter-patient comparable volumes were obtained, with a median OFFL-Q(1/3)4D(1/3) of 0.43 [0.23;0.58] and a median IFFL-Q(1/3)4D(1/3) of 0.12 [0.06;0.19], meaning that 12% of VLung was found to be functional by both methods, while only seven patients had an IF value below 0.1. This indicates large overlap of well-ventilated and well-perfused regions and points at a possibility of dose sparing of both well-ventilated and well-perfused parts of the lungs, hereby decreasing the risk of RP. This aligns with a former study of 60 patients having both Q-SPECT and 4D-CT, showing that the clinical correlation with RP was stronger in the ventilation and perfusion matched region than ventilation or perfusion alone [Citation24]. A complete picture of lung function however includes imaging both physiological processes, especially in lung cancer patients, where pulmonary abnormalities lead to spatial lung function heterogeneity [Citation9]. The findings in this study support this fact, and one would not expect the two methods to overlap to higher extent.
As the SPECT scans were acquired over several minutes and hence several breathing cycles, the functionality of single voxels affected neighboring voxels during breathing. Thus, identification of individual functional voxels in the lungs becomes uncertain and segmentation of small volumes should be avoided. In some patients, for instance patient 20 in , the 40% cut-off value for Q-SPECT produced small dispersed areas of high activity due to a very inhomogeneous albumin-deposit which resulted in an OFFL-Q(40%)4D(16%) of 0.37 and IFFL-Q(40%)4D(16%) of only 0.03. For the same patient, the OFFL-Q(1/3)4D(1/3) was 0.58, and IFFL-Q(1/3)4D(1/3) was 0.15 showing much larger overlap between FL-Q and FL-4D.
V/Q-SPECT is the golden standard for imaging regional lung function. SPECT imaging is mainly used as a qualitative grey-level based diagnostic tool due to the frequent occurrence of artifacts and uneven distribution of the radioactive agents, making quantification challenging. The V-SPECT signal generally has a lower activity than the Q-SPECT signal, resulting in noisy V-SPECT images that may be hard to interpret quantitatively [Citation20]. For the V-SPECT scans in this study, patients were inhaling the radioactive agent in upright position while the imaging was performed in the supine position. Contrary to this, the agent used for Q-SPECT was injected into the veins of the patient and distributed through the blood flow while the patient was in the supine position, also being the position used for imaging both V- and Q-SPECT. In a study administering SPECT agents to healthy volunteers either in the upright, supine or prone posture, the regional blood flow and ventilation was redistributed by gravity in the upright posture. Hereby, activity was increased in the caudal regions. Much less influence was seen in the supine and prone postures [Citation25]. In accordance with this, we generally saw the highest V-SPECT activity levels caudally and dorsally in the patients. For patients receiving both a V- and a Q-SPECT, the two examinations were carried out sequentially, causing remaining activity from the prior scan to influence activity levels in the latter, sometimes causing artifacts in the Q-SPECT scan. This is the case in patient 20 in where residual activity from V-SPECT resulted in extremely high activity just outside the right bronchus in the Q-SPECT image.
The 4D-CT method gives a strictly mechanical evaluation of the elasticity of the lung tissue. Voxels in an elastically flexible volume will be deemed functional regardless of lung tissue being inaccessible to air from the bronchi due to emboli or a tumor blocking its way. The 4D-CT method is sensitive to the breathing motion, as small breathing amplitudes during the 4D-CT scanning are often linked to minor motion of the voxels between the inhale and exhale phases causing a high level of noise in the V-map. This effect can be seen in where patient 12 with a very low breathing amplitude shows disjunct and poorly overlapping FL-V(1/3) and FL-4D(1/3) areas within the lungs. In both methods, this is probably the result of generally low lung functionality. The 4D-CT method is sensitive to 4D-image quality and artifacts as well as the precision of the DIR algorithm used [Citation26,Citation27]. In patient 20 in motion artifacts in the 4D-CT image give rise to an almost striped appearance of FL-4D(1/3). Despite the many artifacts in both the Q-SPECT and the 4D-CT V-map, both methods agree on high functionality in the left lung, and a mostly non-functioning right lung. Segmentation of large volumes minimizes the effects of artifacts but increases sensitivity to noise for patients with low perfusion on Q-SPECT or minor changes in breathing volume (see Supplementary material).
The OF and IF between FL-Q(1/3) and FL-V(1/3) were found to be significantly higher than those between FL-4D(1/3) and FL-Q(1/3) or FL-V(1/3). A high correlation between Q-SPECT and V-SPECT is likely as well-ventilated lung volumes are typically also well-perfused [Citation19]. In a study of 11 patients, similarly the correlation between Q-SPECT and V-SPECT was found to be better than between SPECT and 4D-CT [Citation17]. The OF and IF between FL-4D(1/3) and FL-Q(1/3) or FL-V(1/3) was found not to be significantly different. In a study of 12 patients comparing PET-Galligas-ventilation and 4D-CT, a modest correlation was found [Citation28]. In a subsequent multi-institutional study, a huge variability was seen for the correlation between the two modalities [Citation29]. However, in a study of 98 lung cancer patients, good global agreement between pulmonary function tests and 4D-CT ventilation was seen, indicating that 4D-CT ventilation provides a reliable assessment of lung function [Citation13].
Treatment planning for FL avoidance is based on pre-treatment images. However, patient anatomy may change during the treatment course of five to six weeks duration [Citation30,Citation31]. One example might be a tumor blocking blood supply to part of the lung before RT treatment. During the treatment course, tumor shrinkage may increase blood supply to inferiorly FL volumes, which may in turn emerge as well-functioning at treatment completion. These anatomical changes should be considered by re-imaging and re-planning the patient in case of major anatomical changes [Citation32,Citation33]. Furthermore, ventilation and perfusion have been shown to improve during the RT course making adaptive planning based on SPECT during RT beneficial to allow for sparing of functionally recoverable lung tissue [Citation34,Citation35].
In conclusion, the Q-SPECT and 4D-CT methods roughly agree on the main functional areas of lung in each patient when using larger volumes of comparable size, but the optimal cut-off value for segmentation of FL varies from patient to patient. Great care must be taken when 4D-images contain artifacts, or if the patient has small breathing amplitude. As both methods produce FL volumes that have been shown to correlate with RP incidence, a combination of both may reduce the impact of image noise (Q-SPECT) and artifacts (4D-CT) further.
Supplemental Material
Download MS Word (7.4 MB)Disclosure statement
No potential conflict of interest was reported by the author(s).
References
- Baumann M, Herrmann T, Koch R, et al. Final results of the randomized phase III CHARTWEL-trial (ARO 97-1) comparing hyperfractionated-accelerated versus conventionally fractionated radiotherapy in non-small cell lung cancer (NSCLC). Radiother Oncol. 2011;100(1):76–85.
- Bradley JD, Paulus R, Komaki R, et al. Standard-dose versus high-dose conformal radiotherapy with concurrent and consolidation carboplatin plus paclitaxel with or without cetuximab for patients with stage IIIa or IIIb non-small-cell lung cancer (RTOG 0617): a randomised, two-by-two factorial phase 3 study. Lancet Oncol. 2015;16(2):187–199.
- Hansen O, Knap MM, Khalil A, et al. A randomized phase II trial of concurrent chemoradiation with two doses of radiotherapy, 60 Gy and 66 Gy, concomitant with a fixed dose of oral vinorelbine in locally advanced NSCLC. Radiother Oncol. 2017;123(2):276–281.
- Khalil AA, Hoffmann L, Moeller DS, et al. New dose constraint reduces radiation-induced fatal pneumonitis in locally advanced non-small cell lung cancer patients treated with intensity-modulated radiotherapy. Acta Oncol. 2015;54(9):1343–1349.
- Palma DA, Senan S, Tsujino K, et al. Predicting radiation pneumonitis after chemoradiation therapy for lung cancer: an international individual patient data meta-analysis. Int J Radiat Oncol Biol Phys. 2013;85(2):444–450.
- De Jaeger K, Seppenwoolde Y, Boersma LJ, et al. Pulmonary function following high-dose radiotherapy of non-small-cell lung cancer. Int J Radiat Oncol Biol Phys. 2003;55(5):1331–1340.
- Hoover DA, Reid RH, Wong E, et al. SPECT-based functional lung imaging for the prediction of radiation pneumonitis: a clinical and dosimetric correlation. J Med Imaging Radiat Oncol. 2014;58(2):214–222.
- Munawar I, Yaremko BP, Craig J, et al. Intensity modulated radiotherapy of non-small-cell lung cancer incorporating SPECT ventilation imaging. Med Phys. 2010;37(4):1863–1872.
- Farr KP, Kramer S, Khalil AA, et al. Role of perfusion SPECT in prediction and measurement of pulmonary complications after radiotherapy for lung cancer. Eur J Nucl Med Mol Imaging. 2015;42(8):1315–1324.
- Farr KP, Kallehauge JF, Møller DS, et al. Inclusion of functional information from perfusion SPECT improves predictive value of dose-volume parameters in lung toxicity outcome after radiotherapy for non-small cell lung cancer: a prospective study. Radiother Oncol. 2015;117(1):9–16.
- Yamamoto T, Kabus S, von Berg J, et al. Impact of four-dimensional computed tomography pulmonary ventilation imaging-based functional avoidance for lung cancer radiotherapy. Int J Radiat Oncol Biol Phys. 2011;79(1):279–288.
- Yamamoto T, Kabus S, Bal M, et al. The first patient treatment of computed tomography ventilation functional image-guided radiotherapy for lung cancer. Radiother Oncol. 2016;118(2):227–231.
- Brennan D, Schubert L, Diot Q, et al. Clinical validation of 4-dimensional computed tomography ventilation with pulmonary function test data. Int J Radiat Oncol Biol Phys. 2015;92(2):423–429.
- Vinogradskiy Y, Castillo R, Castillo E, et al. Use of 4-dimensional computed tomography-based ventilation imaging to correlate lung dose and function with clinical outcomes. Int J Radiat Oncol Biol Phys. 2013;86(2):366–371.
- Faught AM, Miyasaka Y, Kadoya N, et al. Evaluating the toxicity reduction with computed tomographic ventilation functional avoidance radiation therapy. Int J Radiat Oncol Biol Phys. 2017;99(2):325–333.
- Abratt RP, Willcox PA, Smith JA. Lung cancer in patients with borderline lung functions–zonal lung perfusion scans at presentation and lung function after high dose irradiation. Radiother Oncol. 1990;19(4):317–322.
- Hegi-Johnson F, Keall P, Barber J, et al. Evaluating the accuracy of 4D-CT ventilation imaging: first comparison with Technegas SPECT ventilation. Med Phys. 2017;44(8):4045–4055.
- Roach PJ, Schembri GP, Bailey DL. V/Q scanning using SPECT and SPECT/CT. J Nucl Med. 2013;54(9):1588–1596.
- Hegi-Johnson F, de Ruysscher D, Keall P, et al. Imaging of regional ventilation: is CT ventilation imaging the answer? A systematic review of the validation data. Radiother Oncol. 2019;137:175–185.
- Bucknell NW, Hardcastle N, Bressel M, et al. Functional lung imaging in radiation therapy for lung cancer: a systematic review and meta-analysis. Radiother Oncol. 2018;129(2):196–208.
- Vinogradskiy YY, Castillo R, Castillo E, et al. Use of weekly 4DCT-based ventilation maps to quantify changes in lung function for patients undergoing radiation therapy. Med Phys. 2012;39(1):289–298.
- Piper J, Nelson A, Harper J. Deformable image registration in MIM Maestro® evaluation and description. Whitepaper. Cleveland, OH: MIM Software Inc.; 2013.
- Shusharina N, Cho J, Sharp GC, et al. Correlation of (18)F-FDG avid volumes on pre-radiation therapy and post-radiation therapy FDG PET scans in recurrent lung cancer. Int J Radiat Oncol Biol Phys. 2014;89(1):137–144.
- Kimura T, Doi Y, Nakashima T, et al. Combined ventilation and perfusion imaging correlates with the dosimetric parameters of radiation pneumonitis in radiation therapy planning for lung cancer. Int J Radiat Oncol Biol Phys. 2015;93(4):778–787.
- Petersson J, Rohdin M, Sánchez-Crespo A, et al. Regional lung blood flow and ventilation in upright humans studied with quantitative SPECT. Respir Physiol Neurobiol. 2009;166(1):54–60.
- Yamamoto T, Kabus S, Lorenz C, et al. SU-D-BRB-01: 4D-CT lung ventilation images vary with 4D-CT sorting techniques. Med Phys. 2012;39(6 Pt 3):3614.
- Yamamoto T, Kabus S, Lorenz C, et al. 4D CT lung ventilation images are affected by the 4D CT sorting method. Med Phys. 2013;40(10):101907.
- Kipritidis J, Siva S, Hofman MS, et al. Validating and improving CT ventilation imaging by correlating with ventilation 4D-PET/CT using 68Ga-labeled nanoparticles. Med Phys. 2013;41(1):11910.
- Kipritidis J, Tahir BA, Cazoulat G, et al. The VAMPIRE challenge: a multi-institutional validation study of CT ventilation imaging. Med Phys. 2019;46(3):1198–1217.
- Møller DS, Khalil AA, Knap MM, et al. Adaptive radiotherapy of lung cancer patients with pleural effusion or atelectasis. Radiother Oncol. 2014;110(3):517–522.
- Kwint M, Conijn S, Schaake E, et al. Intra thoracic anatomical changes in lung cancer patients during the course of radiotherapy. Radiother Oncol. 2014;113(3):392–397.
- Møller DS, Holt MI, Alber M, et al. Adaptive radiotherapy for advanced lung cancer ensures target coverage and decreases lung dose. Radiother Oncol. 2016;121(1):32–38.
- Hoffmann L, Alber M, Jensen MF, et al. Adaptation is mandatory for intensity modulated proton therapy of advanced lung cancer to ensure target coverage. Radiother Oncol. 2017;122(3):400–405.
- Yuan ST, Frey KA, Gross MD, et al. Changes in global function and regional ventilation and perfusion on SPECT during the course of radiotherapy in patients with non-small-cell lung cancer. Int J Radiat Oncol Biol Phys. 2012;82(4):e631–e638.
- Yamamoto T, Kabus S, Bal M, et al. Changes in regional ventilation during treatment and dosimetric advantages of CT ventilation image guided radiation therapy for locally advanced lung cancer. Int J Radiat Oncol Biol Phys. 2018;102(4):1366–1373.