
A recent review of cancer care clinical registry initiatives in Scandinavian countries, published in this Journal [Citation1], highlighted that further developments and coordination are needed to make full use of registry initiatives. It also emphasised that clinical registries needed to be enriched by updated information on socioeconomic variables to ensure equity of care. Unlike most other countries worldwide, Scandinavian countries have access to individual-level socioeconomic status (SES) data. They can also create small-area indices of SES or of other important variables, such as the distribution of immigrant groups, to use in epidemiological studies and to guide public health decisions. Due to the ecological fallacy inherent in small-area analyses [Citation2], individual-level data are often considered to be the gold standard. Precise linkage can be done to process health, socioeconomic and other data relating specially to each individual studied. As a result, this tends to be labour intensive, particularly for epidemiological studies covering large areas and long periods of time. Small-area level indices can therefore provide a useful proxy to address some of these limitations, while retaining a relatively high precision. Although comparisons of individual-level versus area-level socioeconomic measures in assessing health outcomes have been conducted [Citation3–6], this issue has so far received little attention in Scandinavian countries.
In recent years, such small-area variables have been used in disease mapping studies within Denmark (cardiovascular epidemiology) [Citation7,Citation8] and within South-West Sweden (cancer epidemiology) [Citation9]. We combine expertise from the UK and Sweden and work on developing and applying methods for small-area mapping of cancer outcomes. We have proposed Cancer Stage Mapping, i.e. small-area mapping of cancer incidences per tumour stage at diagnosis, for addressing equity of early cancer detection [Citation9].
In this letter, we highlight the relevance of the small-area design [Citation2,Citation10], with special consideration to small-area characteristics reflecting SES and distribution of immigrant groups, respectively, for studying equity of early cancer detection and care. Our focus is on Scandinavian countries and opportunities created by the development of a new small-area geography in Sweden. In order to explain how small-area data on SES and on the distribution of immigrant groups can add value to evaluations addressing equity of early detection and care, we describe relevant data in use in Sweden and other Scandinavian countries.
Socioeconomic status (SES)
Whether at individual-level or area-level, there is currently no consensus on how to define SES within a country or across multiple countries. SES indices often account for income, education and occupation, but many other variables have been considered, including for example, crime, green space or levels of air pollution.
Individual-level variables
Individual-level data on educational level, income, occupation and marital status have been used for assigning SES to cancer patients in Scandinavia [Citation11–14]. Although educational level has predominantly been used as a proxy of SES (categorising patients into ‘low’ [primary school], ‘intermediate’ [gymnasium/pre-university level] and ‘high’ [university level] SES), developments of education systems in many countries have resulted in gradual shifts from lower to higher educational level in younger generations (references [Citation11,Citation15] present illustrative data on demographic variations of educational level in Denmark and Sweden), raising concerns about the use of educational level as a direct measure of SES. Educational level is rather an indirect measure of SES; and standardisation by calendar year, age and sex should be considered. As a more appropriate direct measure of SES, investigators may consider disposable income per household (standardised by taking into account household composition) [Citation16]. For example, in a recent Swedish study addressing the association between SES and survival following surgery for lung cancer, SES was assessed by assigning household disposable income to each patient and categorising the patients into income quintiles [Citation17].
Small-area index of multiple deprivation
A small-area index of multiple deprivation reflects neighbourhood-level SES. It is particularly useful when individual-level data are not available and can represent a useful proxy of relative deprivation within a country. Such indices have predominantly been developed at a national level to reflect within country heterogeneities and inequalities, and they relate to relative poverty within a country. Small-area indices of multiple deprivation are commonly used in the UK, with England [Citation18,Citation19], Scotland [Citation20], Wales [Citation21] and Northern Ireland [Citation22] having each their own indices. For example, the English index of multiple deprivation, which ranks 32,844 small areas, is based on income (22.5%), employment (22.5%), education (13.5%), health (13.5%), crime (9.3%), barriers to housing and services (9.3%) and the quality of the indoor and outdoor living environment (9.3%). If primarily used for health studies, such an index should not incorporate a health component. Indices of multiple deprivation have also been created for small areas in several other countries [Citation23–28], including Denmark [Citation27] and Sweden [Citation28]. The Danish index was developed based on population data from January 2005, divided into 2,119 parishes with population sizes varying between 34 to 20,783. The Swedish index was based on population data from 1990–2004 according to an older geographical division referred to as SAMS (Small Areas for Market Statistics), but included only SAMS areas in the three largest cities that had at least 500 inhabitants. In 2018, Statistics Sweden launched a new geographic division referred to as DeSO (Demografiska statistikområden [in Swedish]), with the aim to facilitate monitoring of segregation and socioeconomic conditions in small areas, each with a population size between 600 and 2,700 (in year 2018) [Citation29]. The creation of this new geography offers opportunities to develop new small-area level indices of SES and to reflect on other important variables to account for.
Immigrant groups
A variety of factors related to early cancer detection and care may vary between ethnic groups [Citation11,Citation30,Citation31]. Beyond the direct health risk, non-autochthonous groups can also face linguistic and cultural barriers, which may contribute to delayed diagnosis, influence treatment choices and lead to more severe outcomes. To achieve equality of early detection and care, it is therefore essential to account for these differences when monitoring healthcare data. Similarly to SES, small-area indices can offer a valuable tool in epidemiological analysis in relation to ethnicity or immigrant groups. Such data need to be kept distinct from a small-area index of multiple deprivation, because impact of ethnic concentration on health could be essentially different from that of material deprivation [Citation32]. In the UK and the US, census data on ethnicity/race is widely used, whereas, in the Scandinavian countries, immigrant groups are rather used for registry-based studies, because immigrant groups can be defined from national population registry data on first- and second-generation immigrants (see e.g. references [Citation13,Citation14]). The proportions of foreign-born individuals registered for the populations in Denmark, Finland, Norway and Sweden on the 1st of January, 2019, were: 12.2%, 7.0%, 15.8% and 19.1%, respectively [Citation33].
Relevance to equity of early detection and care
We provide below a few selected examples illustrating individual-level and small-area-level data and how they together can add value to evaluations addressing equity of early detection and care.
Individual-level and DeSO-level data on SES and immigrant groups for the population in Sweden
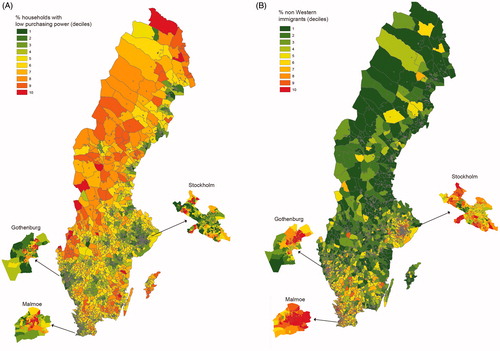
Statistics Sweden provides a wide range of variables at DeSO-level. For illustrative purposes, we considered here the following two variables across the 5,984 DeSOs: contextual variable A) the proportion of households with low purchasing power (defined as having a disposable income in the lowest quartile of the households in Sweden; mean [SD] based on data from 2018: 24.7% [12.4]) and contextual variable B) the proportion of non-western immigrants (i.e. inhabitants born in Eastern Europe, Asia, Africa or South America) (mean [SD]: 4.2% [4.1]). visualises the geographical distributions of these two variables. The shifting colours represent deciles of each DeSO-level variable (shifting from dark green = 1st decile to dark red = 10th decile). The maps show clearly different geographical patterns for contextual variables A and B, respectively. The rank-correlation between these two variables (categorised into deciles) indicate to what extent outcome associations with each DeSO-level variable would coincide. Across the 5,984 DeSOs, we obtained a Spearman rank-correlation (rS) of 0.30. Within Stockholm municipality (544 DeSOs), we obtained rS = 0.62; within Gothenburg municipality (306 DeSOs), rS = 0.66; and within Malmoe municipality (192 DeSOs), rS = 0.67. Although rank-correlations between economic deprivation and proportion of non-western immigrants were more pronounced within the major urban areas, than across the whole country, the maps clearly indicates that they each provide different information to account for in health studies. It may be of particular interest to study urban areas, where there is DeSOs with relatively high proportions of non-Western immigrants in both low and high income areas ().
Figure 1. Geographical distributions, across the 5,985 DeSOs of Sweden (based on data from 2018) of A) the proportion of households with low purchasing power and B) the proportion of non-western immigrants.
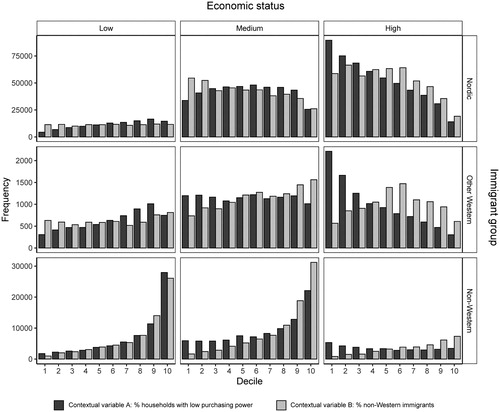
Swedish population data stratified by DeSO, sex, age, economic status (three groups according to disposable income per household per consumption unit: ‘low’, income in the lowest quartile of the households in Sweden; ‘medium’, income in quartiles 2 and 3; and ‘high’, income in the highest quartile) and immigrant group (three groups according to country of birth: the Nordic countries, other Western countries and non-Western countries) can also be accessed. The distributions of the DeSO-level data vary between population groups defined by individual-level variables. We consider, as an example, the Swedish population aged 50–59 years, many of whom will be invited to a colorectal cancer screening in the coming years [Citation34], however the screening efforts may not be equitable. shows distributions of the contextual variables A and B assigned to 50–59-year old persons in nine population strata based on individual-level data (economic status [low, medium, high] × birth country group [Nordic, Western, non-Western]). Notice that we use the frequency, rather than the proportion, on each y-axis, to convey information on population sizes in the various strata. Yet, conveys information on the distributions of the contextual variables within each strata, and several trivial patterns appear: people in their 50 s with high SES predominately live in DeSOs where households with low purchasing power are rare; non-western immigrants predominantly live in DeSOs with relatively high proportions of non-western immigrants; etc. Nevertheless, indicates whether or not an analysis addressing contextual influence would be powerful. For example, consider non-western immigrants with low economic standard (, lower left panel): an analysis addressing contextual influence, comparing those who live in areas with contrasting contexts (poor vs. rich areas; areas with large vs. small proportions of non-western immigrants), would be hampered due to greatly uneven contextual variable distributions within this population group. On the other hand, fairly even contextual variable distributions appear in other population groups defined by fixed individual-level variables ().
Figure 2. Distributions of the contextual (DeSO-level) variables A and B (cf. ) assigned to 50–59-year old persons of the population in Sweden, divided into nine population strata, viz. individual-level economic status (low, medium, high) in combination with birth country group (Nordic, other Western, non-Western). For example, the first bar in the top right chart represents 97,084 Nordic residents with high economic status (aged 50–59) who live in the wealthiest DeSOs, which are categorised in the 1st decile (lowest 10%) of the contextual variable defined as ‘% of households with low purchasing power’. By contrast, the number of Nordic residents with high economic status (aged 50–59) who live in the poorest DeSOs, which are categorised in the 10th decile (highest 10%) of the contextual variable A, falls to 17,790.
Value of small-area data in evaluations addressing equity of early detection and care
Small-area data can be used to inform understanding of contextual influences on outcomes. It may be of interest to analyse whether variables reflecting (residential) neighbourhood context are associated with variables reflecting diagnostic delays caused by the patient or the doctor, treatment choice, adherence to treatment, etc. By using concepts and strategies developed for addressing contextual effects in epidemiological research [Citation35,Citation36], investigators provided with both small-area and individual-level data may want to identify whether variables reflecting SES and ethnicity (immigrant group) have stronger contextual than individual influence. We emphasise that an analysis aiming to disentangle individual from contextual influence may rely on contrasting data (). Multi-level statistical models should be employed. There are examples of register-based studies in Scandinavia (cardiovascular epidemiology) yielding informative results on multi-level influence, by adhering to a disease mapping framework and performing multi-level statistical modelling of disease incidences within small areas (with account for spatial associations) [Citation7,Citation8]. Cancer Stage Mapping studies using a similar approach will be feasible.
A major issue of concern is unexplained geographical variations in outcomes hypothetically linked to differences in health care, which may be caused by inequalities in accessibility, diagnostic routes, etc. In Cancer Stage Mapping [Citation9], small-area covariates can be used for estimating ‘socioeconomically’ and ‘immigrant group’ adjusted geographical variations in stage-specific cancer incidences [Citation37,Citation38], which may strengthen support for inequalities related to health care rather than sociodemographic factors. The results from a Cancer Stage Mapping analysis may primarily be considered as a basis for designing controlled intervention studies in a rational way: Given a set of ‘disadvantageous’ areas (i.e. areas showing relatively high incidences of late-stage tumours) identified by the cancer stage mapping, investigators may carefully select intervention (e.g. screening campaign) and control areas. A randomised allocation of intervention/control areas may be considered. For example, organised colorectal cancer screening in Finland was implemented in a randomised fashion [Citation39], in line with previously recommended Randomised Health Services studies [Citation40]. However, the persons were individually randomised either to screening or control arm, rather than randomising residential area clusters of persons. A ‘spill-over’ effect to the control population, which was shown to be pronounced in the implementation phase of the organised colorectal cancer screening in Finland [Citation41], may be reduced by carefully selecting intervention and control areas apart from each other.
Last but not least, we reinforce that the assessment of a patient’s ‘social environment’, in terms of both SES (deprivation) and distribution of immigrant groups, may (i) provide further insights about determinants of inequities in early cancer detection and care and (ii) be helpful for adapting interventions (e.g. considering linguistic and cultural barriers).
Key points for action
Clinical registers in Scandinavian cancer should consider development of procedures that incorporate information on patients’ residential addresses at diagnosis and perform geocoding to small areas.
The national bureaus of statistics should take initiatives to suggest relevant geographical divisions into small areas (for each country) and release aggregated population data.
Small-area data on SES and distribution of immigrant groups should be linked to the clinical registries. (We encourage creation of country-specific small-area indices of multiple deprivation.)
Analytic expertise should support equity of early detection and care evaluations by addressing contextual and geographical effects.
Disclosure statement
The authors declare that they have no conflict of interest.
Additional information
Funding
References
- Nilbert M, Thomsen LA, Winther Jensen J, et al. The power of empirical data; lessons from the clinical registry initiatives in Scandinavian cancer care. Acta Oncol. 2020;59(11):1343–1356.
- Elliott P, Savitz DA. Design issues in small-area studies of environment and health. Environ Health Perspect. 2008;116(8):1098–1104.
- Pardo-Crespo MR, Narla NP, Williams AR, et al. Comparison of individual-level versus area-level socioeconomic measures in assessing health outcomes of children in Olmsted County, Minnesota. J Epidemiol Community Health. 2013;67(4):305–310.
- Narla NP, Pardo-Crespo MR, Beebe TJ, et al. Concordance between individual vs. area-level socioeconomic measures in an urban setting. J Health Care Poor Underserved. 2015;26(4):1157–1172.
- Marra CA, Lynd LD, Harvard SS, et al. Agreement between aggregate and individual-level measures of income and education: a comparison across three patient groups. BMC Health Serv Res. 2011;11:69.
- Steenland K, Henley J, Calle E, et al. Individual- and area-level socioeconomic status variables as predictors of mortality in a cohort of 179,383 persons. Am J Epidemiol. 2004;159(11):1047–1056.
- Kjaerulff TM, Bihrmann K, Andersen I, et al. Geographical inequalities in acute myocardial infarction beyond neighbourhood-level and individual-level sociodemographic characteristics: a Danish 10-year nationwide population-based cohort study. BMJ Open. 2019;9(2):e024207.
- Kjaerulff TM, Bihrmann K, Zhao J, et al. Acute myocardial infarction: does survival depend on geographical location and social background? Eur J Prev Cardiol. 2019;26(17):1828–1839.
- Strömberg U, Parkes BL, Holmén A, et al. Disease mapping of early- and late-stage cancer to monitor inequalities in early detection: a study of cutaneous malignant melanoma. Eur J Epidemiol. 2020;35(6):537–547.
- Piel FB, Fecht D, Hodgson S, et al. Small-area methods for investigation of environment and health. Int J Epidemiol. 2020;49(2):686–699.
- Kraeftens Bekaempelses Center for Kraeftforskning. Social Ulighed i Kraeft i Danmark. Hvidbog; 2019 [accessed 2020 Sep 3]. [Report in Danish]. Available from: https://www.cancer.dk/dyn/resources/File/file/6/7826/1551789863/hvidbog_social_ulighed_kraeft_i_danmark.pdf.
- Myndigheten för vård- och omsorgsanalys. Omotiverat olika - Socioekonomiska och regionala skillnader i cancervården; 2019 [Accessed 2021 Jan 11]. [Report in Swedish]. Available from: https://www.vardanalys.se/rapporter/omotiverat-olika/.
- Cancer Registry of Norway, Institute of Population-Based Cancer Research. Cancer in Norway; 2018 [accessed 2020 Oct 7]. Available from: https://www.kreftregisteret.no/globalassets/cancer-in-norway/2018/cin2018.pdf.
- Kreftregistret. Sosial ulikhet, innvandring och kreft. En rapport om kreftforekomst etter landbakgrunn, utdanning, inntekt og bosted. Special issue; 2018 [accessed 2021 Jan 11]. [Report in Norwegian]. Available from: https://www.kreftregisteret.no/globalassets/cancer-in-norway/2018/special-issue-2018/cin_special_issue.pdf.
- Statistics Sweden. Utbildningsnivån i Sverige; 2020 [Accessed 2020 Sep 8]. [In Swedish]. Available from: https://www.scb.se/hitta-statistik/sverige-i-siffror/utbildning-jobb-och-pengar/utbildningsnivan-i-sverige/.
- Statistics Sweden. Att jämföra inkomster för hushåll. 2020 [Accessed 2020 Sep 8]. [In Swedish]. Available from: https://www.scb.se/hitta-statistik/artiklar/2016/Att-jamfora-inkomster-for-hushall/.
- Sachs E, Jackson V, Sartipy U. Household disposable income and long-term survival after pulmonary resections for lung cancer. Thorax. 2020;75(9):764–770.
- The English Index of Multiple Deprivation (IMD). Guidance; 2015 [Accessed 2020 Sep 9]. Available from: https://assets.publishing.service.gov.uk/government/uploads/system/uploads/attachment_data/file/464430/English_Index_of_Multiple_Deprivation_2015_-_Guidance.pdf.
- Ministry of Housing, Communities & Local Government. English indices of deprivation. 2020 [accessed 2020 Sep 9]. Available from: https://www.gov.uk/government/statistics/announcements/english-indices-of-deprivation-2019.
- Tweed EJ, Allardice GM, McLoone P, et al. Socio-economic inequalities in the incidence of four common cancers: a population-based registry study. Public Health. 2018;154:1–10.
- Statistics for Wales. Welsh Index of Multiple Deprivation (WIMD) 2019. Results report; 2019 [2020 Sep 24]. Available from: https://gov.wales/sites/default/files/statistics-and-research/2019-11/welsh-index-multiple-deprivation-2019-results-report-024.pdf.
- Northern Ireland Statistics and Research Agency. Northern Ireland multiple deprivation measure 2017 (NIMDM2017); 2017 [Accessed 2021 Jan 15]. Available from: https://www.nisra.gov.uk/publications/nimdm17-results.
- Fukuda Y, Nakamura K, Takano T. Higher mortality in areas of lower socioeconomic position measured by a single index of deprivation in Japan. Public Health. 2007;121(3):163–173.
- Exeter DJ, Zhao J, Crengle S, et al. The New Zealand indices of multiple deprivation (IMD): a new suite of indicators for social and health research in Aotearoa, New Zealand. PLoS One. 2017;12(8):e0181260.
- Krieger N, Chen JT, Waterman PD, et al. Geocoding and monitoring of US socioeconomic inequalities in mortality and cancer incidence: does the choice of area-based measure and geographic level matter?: the public health disparities Geocoding project. Am J Epidemiol. 2002;156(5):471–482.
- Sánchez-Cantalejo C, Ocana-Riola R, Fernández-Ajuria A. Deprivation index for small areas in Spain. Soc Indic Res. 2008;89(2):259–273.
- Meijer M, Engholm G, Gritter U, et al. A socioeconomic deprivation index for small areas in Denmark. Scand J Public Health. 2013;41(6):560–569.
- Sariaslan A, Långström N, D'Onofrio B, et al. The impact of neighbourhood deprivation on adolescent violent criminality and substance misuse: a longitudinal, quasi-experimental study of the total Swedish population. Int J Epidemiol. 2013;42(4):1057–1066.
- Statistics Sweden. Att mäta segregation på låg regional nivå; 2017 [Accessed 2020 Sep 9]. [Report in Swedish]. Available from: https://www.scb.se/contentassets/deedfb3fbe3d4abd987cfcd67dcff2e4/slutrapport-att-mata-segregation-pa-lag-regional-niva._ku2017_02404_d.pdf.
- Niksic M, Rachet B, Warburton FG, et al. Ethnic differences in cancer symptom awareness and barriers to seeking medical help in England. Br J Cancer. 2016;115(1):136–144.
- Zavala VA, Bracci PM, Carethers JM, et al. Cancer health disparities in racial/ethnic minorities in the United States. Br J Cancer. 2020;124:315–332.
- Allik M, Leyland A, Travassos Ichihara MY, et al. Creating small-area deprivation indices: a guide for stages and options. J Epidemiol Community Health. 2020;74(1):20–25.
- Nordic Statistics database. [Accessed 2020 Oct 14]. Available from: https://www.nordicstatistics.org/population/.
- Regional Cancer Centers in Sweden. Införande av allmän tarmcancerscreening - slutrapport och rekommendation; 2018 [Accessed 2021 Jan 15]. [Report in Swedish]. Available from: https://cancercentrum.se/globalassets/vara-uppdrag/prevention-tidig-upptackt/tarmcancerscreening/slutrapport_inforande_tarmcancerscreening_18-02-28.pdf.
- Diez-Roux AV. Bringing context back into epidemiology: variables and fallacies in multilevel analysis. Am J Public Health. 1998;88(2):216–222.
- Diez-Roux AV, Mair C. Neighborhoods and health. Ann N Y Acad Sci. 2010;1186:125–145.
- Piel FB, Parkes B, Hambly P, et al. Software application profile: the Rapid Inquiry Facility 4.0: an open access tool for environmental public health tracking. Int J Epidemiol. 2020;49(Supplement_1):i38–i48.
- Small Area Health Statistics Unit (SAHSU), Imperial College London. The Rapid Inquiry Facility (RIF) version 4.0. How to use the RIF 4.0 client; 2019 [Accessed 2019 Sep 11]. Available from: https://smallareahealthstatisticsunit.github.io/rapidInquiryFacility/standalone/RIF_v40_Manual.pdf.
- Pitkäniemi J, Seppä K, Hakama M, et al. Effectiveness of screening for colorectal cancer with a faecal occult-blood test, in Finland. BMJ Open Gastroenterol. 2015;2(1):e000034.
- Hakama M, Malila N, Dillner J. Randomised health services studies. Int J Cancer. 2012;131(12):2898–2902.
- Miettinen J, Malila N, Hakama M, et al. Spillover improved survival in non-invited patients of the colorectal cancer screening programme. J Med Screen. 2018;25(3):134–140.