
Abstract
Background and purpose
Deformable image registration (DIR) and contour propagation are used in daily online adaptation for hybrid MRI linac (MRL) treatments. The accuracy of the propagated contours may vary depending on the chosen workflow (WF), affecting the amount of required manual corrections. This study investigated the impact of three different WFs of contour propagations produced by a clinical treatment planning system for a high-field MRL on head and neck cancer patients.
Methods
Seventeen patients referred for curative radiotherapy for oropharyngeal cancer underwent standard CT-based dose planning and MR scans in the treatment position for planning (pMR), and at the 10th (MR10), 20th (MR20) and 30th (MR30) fraction (±2). The primary tumour, a metastatic lymph node and 8 organs at risk were manually delineated on each set of T2 weighted images. Delineations were repeated one month later on the pMR by the same observer to determine the intra-observer variation (IOV). Three WFs were used to deform images in the treatment planning system for the high-field MRL: In WF1, only the planning image and contours were used as a reference for DIR and propagation to MR10,20,30. The most recently acquired image set prior to the daily images was deformed and uncorrected (WF2) versus manually corrected (WF3) structures propagated to the session image. Dice similarity coefficient (DSC), mean surface distance (MSD) and Hausdorff distance (HD) were calculated for each structure in each model.
Results
Population median DSC, MSD and HD for WF1 and WF3 were similar and slightly better than for WF2. WF3 provided higher accuracy than WF1 for structures that are likely to shrink. All DIR workflows were less accurate than the IOV.
Conclusions
WF1 and WF3 provide higher accuracy in structure propagation than WF2. Manual revision and correction of propagated structures are required for all evaluated workflows.
1. Introduction
Head and Neck cancer (HNC) patients are prone to anatomical changes during a radiotherapy (RT) course due to general weight loss, tumour shrinkage, oedema, etc. [Citation1] which may lead to insufficient target dose coverage and thus, a reduced chance of local control, or increased dose to organs at risk (OAR). Inter-fractional changes can be accounted for by applying safety margins to the target volume, but this will increase the dose to normal tissue, which may induce adverse effects or potentially render curative treatment infeasible. Large anatomical changes are often dealt with by re-scanning and planning during the treatment course when considered clinically relevant [Citation2]. ART strategies have been shown to reduce dose to the parotid gland for most HNC patients, but require a library of plans for each patient to select the treatment of the day [Citation3,Citation4]. Both acute adverse effects such as oral mucositis [Citation5,Citation6] and late effects such as xerostomia and dysphagia may severely reduce patients’ quality of life during and following RT [Citation7–10]. Jensen et al. and Castelli et al. among other groups, have demonstrated a potential reduction in xerostomia through adaptive radiotherapy (ART) due to reduced radiation dose to the parotid glands [Citation11,Citation12]. Daily online adaption of the original treatment plan may potentially allow a reduction of margins and, thus, reduce the irradiated volume and subsequent adverse effects.
Hybrid magnetic resonance (MR) linear accelerators (MR linac) that allow daily ART has become clinically available over the last few years [Citation13,Citation14], allowing very precise plan adaptation over the treatment course. However, such a treatment strategy is time-consuming during each treatment fraction as the online workflow requires MR imaging, identification of targets, and organs at risk (OAR) and plan optimisation, which strains the patient and limits patient throughput [Citation15]. Shortening the time spent on each online workflow element is important to increase patient comfort and compliance as well as ensuring efficient usage of the MR linac.
Both the inter- and intra-observer variations in structure delineation has been established as some of the important uncertainties in radiotherapy planning for HNC [Citation16–19]. Over a treatment course where the dose plan is adapted daily, these uncertainties are relevant for each fraction. Automatic propagation of target and OAR structures defined during initial treatment planning performed on an MR or CT reference image to the MR of the day (session MR) is one way to reduce overall online workflow time, as well as the risk of human error induced by a time-pressured work environment at the MR linac. It has been demonstrated that an intra-modal MR deformation workflow will provide more accurate structure propagations than CT-to-MR deformation for prostate cancer patients [Citation20]. However, also within an MR-only deformation strategy, it is possible to choose different workflows; either the planning MR could be used for each fraction, or the MR acquired at the latest fraction with the most recently approved structures could be used, ideally without any manual corrections. Some patients experience large anatomical changes over their treatment course such as shrinkage of the gross tumour volume (GTV) or parotid glands [Citation21]. Therefore, using the most recently acquired image set rather than the planning MR at each fraction, might provide a better starting point for the deformable image registration (DIR) and thus, potentially lead to more accurate structure propagation.
This study aimed to evaluate the accuracy of three different workflows based on MR-MR deformable image registrations, all performed in the dedicated treatment planning system (TPS) for a high-field MR linac. The goal was to determine which deformation workflow is more suitable for daily HNC treatment adaptation.
2. Methods
In this study, we have evaluated the accuracy of the deformable propagated structures for HNC patients against the intra-observer variation as the gold standard to determine their clinical applicability for daily MR-guided ART. Approval was granted from the regional ethics committee to acquire extra MR scans during treatment for these patients, and all participants gave their signed consent to participate.
2.1. Patients
Seventeen HNC patients referred for curative RT of 66–68 Gy in 33–34 fractions were included according to guidelines by the Danish Head and Neck cancer group (DAHANCA) [Citation22]. The primary sites were larynx (N = 3), oropharynx (N = 10), oral cavity (N = 1) and hypopharynx (N = 3). The median age was 64 years (range 53–73 years). Four patients were females and 13 males. All patients were CT and MR scanned as part of standard RT planning and treated on cone beam CT based linacs [Citation23].
2.2. Acquisition of images
All patients had a planning CT and a planning MR (pMR) scan as part of their regular treatment planning. Furthermore, the patients received session MR scans at the 10th, 20th and 30th (±2 fractions), denoted MRx (x = 10, 20 or 30). CT scans used for standard treatment planning were acquired in the treatment position, with the patient immobilised in a 5-point fixation mask (Orfit Industries, Wijnegem, Belgium). MRIs were acquired on a 1.5 T Philips Ingenia (Philips Medical Systems BV, Best, The Netherlands). For MRI, the patients were positioned in the treatment position without a fixation mask to accommodate the use of a dedicated head and neck coil. Two image sets were available for the observers; a T1w TSE scan (TE =16 ms, TR =635 ms) without Gd-contrast and a T2w TSE scan (TE =4.6 ms, TR > 3500 ms). Both T1w and T2w MR images were acquired as with a field of view of 250 ×250×249 mm3 and reconstructed with voxel size 0.9×0.9×3 mm3.
2.3. Structure delineation
Delineations were made using the standard clinical TPS, Pinnacle v14.0 (Philips, Fitchburg, WI, USA) on the T2w images. The primary gross tumour volume (GTV-T), one metastatic lymph node (GTV-N) and the larynx were delineated by an experienced oncologist. For patients who had more than one positive lymph node, the oncologist chose the most prominent one for delineation over the series of scans. Remaining OARs (brain stem, spinal cord, bilateral parotid glands, bilateral submandibular glands, and thyroid gland) were delineated by an experienced radiation therapist (RTT). Delineations were performed according to the DAHANCA guidelines [Citation22]. The same observer delineated structures on all image sets for a specific patient in order to reduce inter-observer variation. To determine the intra-observer variation (IOV), the observers repeated the delineation of all structures on the pMR 1 month or later after the initial delineations.
2.4. Image registrations and analysis
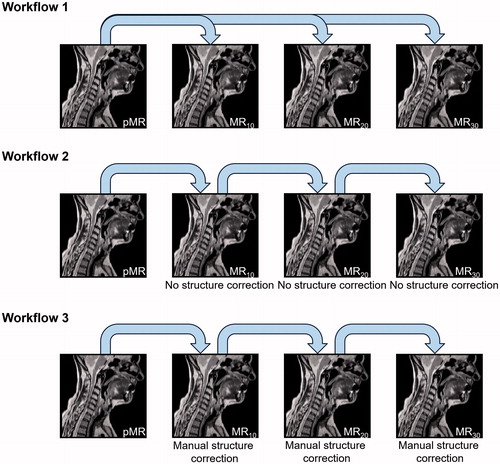
After delineation, images and structures were transferred to Monaco v. 5.40 (Elekta AB, Stockholm, Sweden), the clinical TPS for the Elekta Unity 1.5 T MRL (Elekta AB, Stockholm, Sweden). Then DIRs were performed, as schematically shown in , and structures were propagated to the session scans in the same instance. In WF1, only the planning image sets were used for DIR and contour propagation to the session MR images. In WF2, DIR was performed on the latest acquired image set without any editing of the contours generated in the previous DIR. WF3 also used the most recent image set acquired for DIR and contour propagation. However, in this case, the manually delineated ground truth contours were used for contour propagation. The deformable image registration comprises a series of steps, described in some detail in the vendor software whitepaper [Citation24]. For MR-MR registration the initial step is a rigid registration using a local cross-correlation metric to determine the best match between the new study set and the reference set. Then a coarse deformable registration is performed evaluated by the sum of absolute differences on blocks of the image. Finally, a so-called dense deformable registration is performed. The deformation vector field is resampled iteratively with gradually increased resolution and degrees of freedom. The quality of the final deformations is evaluated by a local cross-correlation metric.
Figure 1. Schematic representation of the three different DIR workflows applied. In WF1, the pMR and its structures were repetitively deformed to the session MR’s. In WF2, the latest MR and structures were deformed to the following session scan without correcting any errors in propagated structures before propagating these to the next session scan. In WF3, the latest MR and structures were deformed to the following session scan with correction of errors in propagated structures before propagating these to the next session scan. Note that the first step in all three workflows is the same.
As MR scans were performed without the fixation face mask increased differences in patient positioning between imaging sessions compared to the clinical treatment scenario could be suspected. Therefore, an analysis of patient displacement between imaging sessions was performed by extracting rotations applied for the initial rigid image registration, following the evaluated workflows. Translations can be accounted for and are thus disregarded here. Systematic and random rotations were calculated following the methodology described in detail by van Herk et al. [Citation25]. These rotations were compared to those reported for the clinically used fixation equipment reported in Hansen et al. [Citation26] to assess whether they were substantially different from the clinical treatment situation.
All DIR images and structures were exported for analysis in Matlab (v. 2017 b) (MathWorks, Natick, MA, USA). Since the deformation from pMR to MR10 was identical in all three workflows, it was omitted from the analysis as this would only serve to mask possible differences between WFs.
Three metrics were calculated to evaluate the accuracy of DIR as described in Christiansen et al. [Citation20]: The Dice similarity coefficient (DSC) which quantifies the overlap between the manually delineated structure and the corresponding deformable propagated structure [Citation27,Citation28]. This measure is highly dependent on the volume of the given structure and most suitable for comparing DIR performance per structure, rather than across different structures. The mean surface distance (MSD) gives the average distance between the manual and deformed structure in absolute measures, which is particularly relevant in areas of steep dose gradients [Citation29]. The Hausdorff distance (HD) gives the maximum absolute distance between the manual and the deformed structure [Citation29]. For each patient, the median values of the DSC, MSD and HD were calculated for each structure investigated and compared to the intra-observer variation and between workflows. For these analyses, the structures were converted to binary masks based on the build-in Matlab function roipoly. The DSC was calculated directly from these masks. For calculation of distances between structures, the manually delineated structure was converted to a binary mask and the shortest distance to this mask was calculated from each point in the corresponding deformable propagated structure.
To evaluate spatial patterns in the distribution of variation between the ground truth and deformed or re-delineated contours, transversal, sagittal, and coronal surface distance projection images were generated for each structure as described in detail in Christiansen et al. [Citation20]. Briefly, the distance between the surface of the reference structure and propagated structure at each session was measured and projected into each of the transversal, sagittal, and coronal planes, after which the average pixel-wise differences was calculated in the planes. Population-based surface distance projection images were subsequently calculated based on the 50 percentile (representing the population median) and 90 percentile (showing the distance within which 90% of the population propagations were contained) of the individual projections. These maps are useful for OAR, which are similar in size and shape across the population, whereas GTV structures vary substantially between patients and these maps do not convey useful information.
2.5. Statistics
The findings of this study are reported using descriptive statistics, as many structures were evaluated and many of these were not independent, to avoid the multiple testing problem. For each of the 17 patients, the median DSC, MSD and HD of the evaluated propagations within each workflow were calculated per structure. Then the median DSC, MSD and HD were calculated over the population as the median of each patients’ median per structure and for each workflow.
3. Results
Of the 17 patients, 16 had a GTV-T and 15 had a GTV-N. The observed patient rotations between imaging sessions were largest around the S–I axis (∑ =1.1° and σ = 0.9° for WF1 and ∑ =1.6° and σ = 0.6° for WF3), and overall no larger than those reported when using the clinical fixation system reported by Hansen et al. [Citation26] (see Table A1 in the Supplementary Appendix).
Table 1. (A) Population medians of patient median DSC, MSD and HD calculated for each structure resulting from each of the three deformation workflows as well as the IOV. IOV delineations of the larynx were not performed. (B) Patient subgroup median DSC, MSD and HD of the GTV-N resulting from each of the 3 deformation workflows. Individual deformations were divided into two groups based on whether their volume change was below (relatively small tumour volume change) or above (relatively large tumour volume change) the population median.
The population median values of each patient’s median DSC, MSD and HD for each evaluated structure, workflow and IOV are summarised in . Comparison of the three DIR workflows revealed only small differences in terms of both DSC and MSD, although WF2 was generally inferior to WF1 and WF3, expressed by lower DSC and higher MSD. The median DSC for GTV-N of WF3 (0.67) showed superiority over WF1 (0.58) and WF2 (0.56). In terms of the HD, WF3 yielded the lowest values for most structures (7 of 10) and WF2 was larger for most structures (7 of 10), indicating that WF3 was most accurate and WF2 was the least accurate of the three. A visual presentation of the results given in can be seen in Figure A1 in the Supplementary Appendix. Furthermore, these results are presented as boxplots in Supplementary Appendix Figures A2–A4 showing similar distributions of patient median values for all 3 workflows for targets and most OAR. Differences observed are a broader distribution for WF2 propagations of the brainstem DSC and HD and spinal cord HD, while WF3 HD was better for the thyroid gland.
None of the workflows were able to match the IOV accuracy by any of the applied metrics, except for the median MSD and HD values for GTV-T. However, the observed IOV of target structures was larger than for OAR, as indicated by the lower DSC and higher MSD and HD. The same tendency was seen for all types of DIR propagations; DSC values were higher for OAR than for targets and MSD and HD correspondingly lower for OAR than those for the targets.
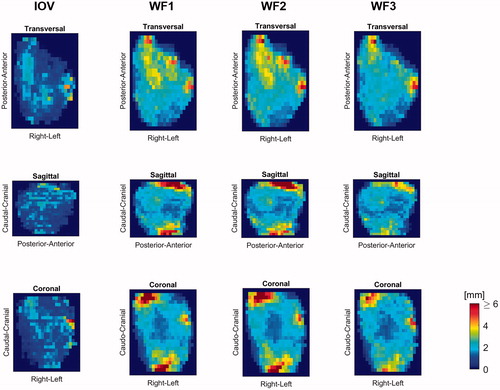
For each structure, the set of surface distance projection maps were produced to highlight areas of increased inaccuracies. In , these maps are shown for the population 90 percentile for the right parotid gland. From the sagittal and coronal projections, the caudal and cranial boundaries are seen to be propagated with inaccuracies up to 6 mm or more (red) by WF1 and WF2, approximately 4 mm with WF3 while the IOV was quite accurate, as indicated by the blue colours. Similar analyses of other OAR show that large propagation inaccuracies also were found for the caudal–cranial boundary for the brain stem, spinal cord, left parotid and thyroid gland. All DIR workflows also showed inaccuracies above 6 mm (population 90 percentile) for the thyroid gland centrally in the anterior direction. Typically, these were also regions of increased IOV, although less pronounced than the DIR propagated structures. Both the 50 and the 90 percentile surface distance projection maps of all structures are given in the Supplementary Appendix (Figures A5–A12).
Figure 2. 90 percentile surface distance projection images for the propagated right parotid gland structures based on the three workflows as well as for the intra-observer variation.
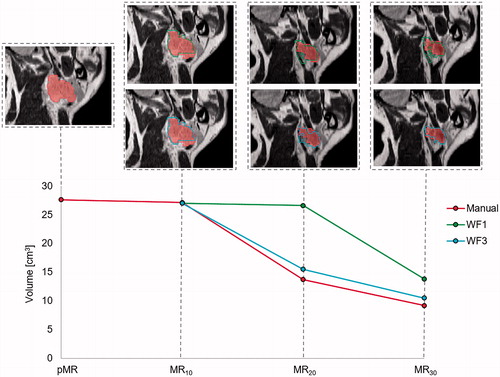
Some patients experienced large tumour shrinkage during their treatment course. Inferior DSC and MSD were observed for these patients when following WF1 compared to WF3, as exemplified in , by one patient with a large reduction in GTV-N volume over the treatment course. For this patient, the DSC for WF3 was 0.81 versus 0.71 for WF1, the MSD for WF3 was 1.2 mm versus 1.5 mm for WF1 and the HD was 6.2 mm for WF3 versus 7.9 mm for WF1.
Figure 3. One patient who experienced large relative shrinkage of the GTV-N over the treatment course, as shown by the red curve for manual delineation. The DIR propagated GTV-N from pMR to each session scan in WF1 (green) remains fairly constant in volume compared to the GTV-N propagated from the previous MR, with corrected structures of WF3 (blue), follows the shrinking tumour size better.
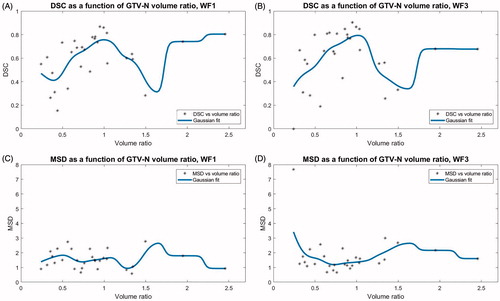
To determine whether the structure propagation accuracy was related to the amount of change in tumour size (expressed as the ratio between the manually delineated GTV-N volumes on the source image and session image) the DSC and MSD were plotted against the volume ratio. This is shown in for the GTV-N propagated by WF1 and WF3, including the moving average gaussian spline function of width 0.1. In two instances large growth of GTV-N yielded a relative volume change above 1.9. Apart from these points, the fit to DSC of both WF1 () and WF3 () indicate more accurate structure propagations when the tumour changes little in size, as the maximum values are situated approximately at a volume ratio of one. The trend was less pronounced for the MSD plotted against GTV-N volume ratios ().
Figure 4. Each patients’ DSC and MSD for WF1 and WF3 plotted against the ratio between the volumes of the GTV-N on the source image for the propagation and the session image, respectively. Volume ratios < 1 indicate GTV-N shrinkage over the treatment course. The running average, shown in blue, was a Gaussian spline function of width 0.1.
Dividing all structure propagations into two groups depending on whether the change in GTV-N volume, as represented by the manually delineated structures, was above or below the population median, shows that small relative tumour shrinkage yielded more accurate contour propagations than larger tumour volume change for all three workflows in terms of DSC and HD, while the MSD did not show any difference (see ).
4. Discussion
This study has shown that regardless of which DIR propagation workflow is chosen for daily online ART for HNC, some manual editing is required post-deformation. The intra-observer re-delineations yielded better accuracy compared to all three DIR workflows expressed by higher population median DSC and lower MSD and HD. The only exception is the MSD and HD for GTV-T, which were higher for IOV than for the DIR propagations. One likely explanation for this is that the re-delineations were performed on the pMR; the observers did not have access to any previous delineation on which they could base their current delineation. In contrast, the DIR algorithm started out with a structure set on the source image set from which the propagation was performed.
As exemplified in , some of the tumours shrink considerably over the treatment course. The increased accuracy observed in WF3 compared to WF1 indicates that the DIR algorithm provides a better result if the structure on the source image set is of similar size to the tumour on the scan of the day, i.e., the deformation required is smaller. This is confirmed by the trend observed in for the DSC’s; inaccuracies of deformation of GTV-N structures generally increase if the structure is very different in volume in the session image set from the source image set. This dependency is not surprising and has also been reported for structure deformation in the pelvic region [Citation20]. This was confirmed by subdivision of structure propagations based on the amount of volume change in GTV-N, showing higher accuracy in terms of increased DSC and decreased HD for small relative volume changes (), although substantial change is required for this to take real effect. shows maximum propagation accuracy, in terms of DSC, when the volume ratio is close to unity, and a relatively symmetric decrease around unity. The exception is the two data points with the largest volume ratio (>2) which show high DSC and corresponding low MSD. It should be noted, that the structures evaluated here have a general tendency to shrink over the treatment course [Citation21], which means that large volume ratios (>1) are underrepresented in this population.
The surface distance projections reveal that the largest uncertainties in the OAR deformations appear in the same regions as the largest intra-observer variations, e.g., the caudal and cranial boundaries of most OAR. The caudal limit of the spinal cord is defined by the scan field of view, and thus difficult for the DIR algorithm to determine. The caudal limit of the brain stem (and so cranial limit of the spinal cord) was defined by the observer as placed at the foramen magnum rather than a feature in the organ itself. This is information that cannot be conveyed into a mapping of the structure from one image set into another, and differences between ground truth and propagated structures should be expected. Generally, there is little difference between surface distance projections of the three different workflows, which indicate little clinical difference. However, WF2 performed slightly less well according to the population median DSC and MSD and certainly less well according to the HD. But when evaluating the distribution of patient medians shown as boxplots () it appears, that clinically relevant differences are unlikely. The larger errors seen for WF2 are most likely due to errors produced in one step of the DIR process was carried forth to the next DIR propagation. This would also be the case for any manually introduced miss-delineations, which are not unlikely to occur sometime over a treatment course using WF3, as daily, successive manual editing of the structures takes place under some time pressure while the patient is on the couch. With this in mind, as well as the high IOV seen for target structures, WF1 could well be the workflow least prone to errors, even though systematic changes in structure volumes were not as well accommodated as by WF3, or a mix of the two over the treatment course.
The target structures were less consistently defined by both the oncologists and the DIR algorithm than OAR. A plausible explanation is that their boundary was less sharp than for healthy tissue. In several cases, poor image contrast in the tumour area was seen due to patient motion and swallowing artefacts. A weakness in this study is that patients were scanned without the use of a fixation mask. Although misalignments of the patients were not larger than with the mask (Table A1) increased motion artefacts could be assumed e.g., in the oral cavity, in which many of the GTV-Ts were situated, due to larger tongue and swallowing motion. This is also the reason, that the propagation accuracy’s dependence on tumour shrinkage was evaluated by the GTV-N rather than GTV-T. In a clinical setting, the application of a fixation mask will likely reduce motion artefacts.
Other imaging modalities reducing the inter- and intra-observer variation of the GTVs, such as PET/CT were not used. Furthermore, the particular scan used was a T2w scan, which generally shows good tissue contrast but might not be ideal for the tumour tissue. Often diffusion weighted imaging (DWI) and T1w post-Gd-contrast images are used for tumour characterisation [Citation30]. However, daily administration of intravenous Gd-contrast is not possible in clinical practice due to kidney toxicity. DWI is currently not available for the Unity MRL online adaptive planning workflow, but it could improve delineation accuracy for HNC patients [Citation31], and so would be a desirable addition.
In this study, we have used the IOV as the gold standard measure for accuracy. However, in clinical practice, multiple oncologists and RTTs are likely to be involved in delineation over a patients’ course of ART. Thereby the inter-observer variation will influence the accuracy in clinical practice, which is greater than the IOV. Anderson et al. [Citation16] found that PET/CT and MRI yielded similar levels of inter-observer variation for HNC GTV delineations and Apolle et al. found that mean DSC based on PET/CT for a group of observers was 0.51 at treatment onset, while it decreased to 0.38 by the middle of the treatment course [Citation32]. In comparison, the levels of agreement found here for DIR propagated contours appear to be able to increase the consistency of delineations in the practical ART workflow. Which of the evaluated workflows should be used in clinical practice should be evaluated in further studies including investigation of their dosimetric effects.
In conclusion, the most accurate automatically DIR propagated structures in the daily online ART workflow were achieved by avoiding multiple, successive DIR. Workflow 3 produced the most accurate propagation of structures that show large relative shrinkage during the treatment course. However, manual review and editing of the propagated structures are required regardless of which workflow is chosen.
Supplemental Material
Download PDF (2.2 MB)Disclosure statement
No potential conflict of interest was reported by the author(s).
Additional information
Funding
References
- Barker JL, Jr., Garden AS, Ang KK, et al. Quantification of volumetric and geometric changes occurring during fractionated radiotherapy for head-and-neck cancer using an integrated CT/linear accelerator system. Int J Radiat Oncol Biol Phys. 2004;59(4):960–970.
- Hansen EK, Bucci MK, Quivey JM, et al. Repeat CT imaging and replanning during the course of IMRT for head-and-neck cancer. Int J Radiat Oncol Biol Phys. 2006;64(2):355–362.
- Brouwer CL, Steenbakkers RJHM, Langendijk JA, et al. Identifying patients who may benefit from adaptive radiotherapy: does the literature on anatomic and dosimetric changes in head and neck organs at risk during radiotherapy provide information to help? Radiother Oncol. 2015;115(3):285–294.
- Brouwer CL, Steenbakkers RJ, van der Schaaf A, et al. Selection of head and neck cancer patients for adaptive radiotherapy to decrease xerostomia. Radiother Oncol. 2016;120(1):36–40.
- Franco P, Martini S, Di Muzio J, et al. Prospective assessment of oral mucositis and its impact on quality of life and patient-reported outcomes during radiotherapy for head and neck cancer. Med Oncol. 2017;34(5):81.
- Hansen CR, Bertelsen A, Zukauskaite R, et al. Prediction of radiation-induced mucositis of H&N cancer patients based on a large patient cohort. Radiother Oncol. 2020;147:15–21.
- Jabbari S, Kim HM, Feng M, et al. Matched case-control study of quality of life and xerostomia after intensity-modulated radiotherapy or standard radiotherapy for head-and-neck cancer: initial report. Int J Radiat Oncol Biol Phys. 2005;63(3):725–731.
- Nishi T, Nishimura Y, Shibata T, et al. Volume and dosimetric changes and initial clinical experience of a two-step adaptive intensity modulated radiation therapy (IMRT) scheme for head and neck cancer. Radiother Oncol. 2013;106(1):85–89.
- Pow EH, Kwong DL, McMillan AS, et al. Xerostomia and quality of life after intensity-modulated radiotherapy vs. conventional radiotherapy for early-stage nasopharyngeal carcinoma: initial report on a randomized controlled clinical trial. Int J Radiat Oncol Biol Phys. 2006;66(4):981–991.
- Xie CY, Su HF, Li WF, et al. The effect on life quality of nasopharyngeal cancer patients through xerostomia decrease after intensity-modulated radiotherapy. Zhonghua Yi Xue Za Zhi. 2010;90:1313–1316.
- Jensen AD, Nill S, Huber PE, et al. A clinical concept for interfractional adaptive radiation therapy in the treatment of head and neck cancer. Int J Radiat Oncol Biol Phys. 2012;82(2):590–596.
- Castelli J, Simon A, Louvel G, et al. Impact of head and neck cancer adaptive radiotherapy to spare the parotid glands and decrease the risk of xerostomia. Radiat Oncol. 2015;10(1):6.
- Mutic S, Dempsey JF. The ViewRay system: magnetic resonance-guided and controlled radiotherapy. Semin Radiat Oncol. 2014;24(3):196–199.
- Raaymakers BW, Jurgenliemk-Schulz IM, Bol GH, et al. First patients treated with a 1.5 T MRI-Linac: clinical proof of concept of a high-precision, high-field MRI guided radiotherapy treatment. Phys Med Biol. 2017;62(23):L41–L50.
- Bertelsen AS, Schytte T, Moller PK, et al. First clinical experiences with a high field 1.5 T MR linac. Acta Oncol. 2019;58(10):1352–1357.
- Anderson CM, Sun W, Buatti JM, et al. Interobserver and intermodality variability in GTV delineation on simulation CT, FDG-PET, and MR images of head and neck cancer. Jacobs J Radiat Oncol. 2014;1:006.
- Mukesh M, Benson R, Jena R, et al. Interobserver variation in clinical target volume and organs at risk segmentation in post-parotidectomy radiotherapy: can segmentation protocols help? Br J Radiol. 2012;85(1016):e530–e536.
- Bekelman JE, Wolden S, Lee N. Head-and-neck target delineation among radiation oncology residents after a teaching intervention: a prospective, blinded pilot study. Int J Radiat Oncol Biol Phys. 2009;73(2):416–423.
- Breen SL, Publicover J, De Silva S, et al. Intraobserver and interobserver variability in GTV delineation on FDG-PET-CT images of head and neck cancers. Int J Radiat Oncol Biol Phys. 2007;68(3):763–770.
- Christiansen RL, Dysager L, Bertelsen AS, et al. Accuracy of automatic deformable structure propagation for high-field MRI guided prostate radiotherapy. Radiat Oncol. 2020;15(1):32.
- Wang ZH, Yan C, Zhang ZY, et al. Radiation-induced volume changes in parotid and submandibular glands in patients with head and neck cancer receiving postoperative radiotherapy: a longitudinal study. Laryngoscope. 2009;119(10):1966–1974.
- Hansen CR, Johansen J, Samsoe E, et al. Consequences of introducing geometric GTV to CTV margin expansion in DAHANCA contouring guidelines for head and neck radiotherapy. Radiother Oncol. 2018;126(1):43–47.
- Hansen CR, Bertelsen A, Hazell I, et al. Automatic treatment planning improves the clinical quality of head and neck cancer treatment plans. Clin Transl Radiat Oncol. 2016;1:2–8.
- Elekta AB and CMS software. ABAS: intra-patient deformable image registration for adaptive radiotherapy – a white paper. 2014. Obtained via personal communication.
- van Herk M. Errors and margins in radiotherapy. Semin Radiat Oncol. 2004;14(1):52–64.
- Hansen CR, Christiansen RL, Nielsen TB, et al. Comparison of three immobilisation systems for radiation therapy in head and neck cancer. Acta Oncol. 2014;53(3):423–427.
- Dice LR. Measures of the amount of ecologic association between species. Ecology. 1945;26(3):297–302.
- Vinod SK, Min M, Jameson MG, et al. A review of interventions to reduce inter-observer variability in volume delineation in radiation oncology. J Med Imaging Radiat Oncol. 2016;60(3):393–406.
- Zukauskaite R, Brink C, Hansen CR, et al. Open source deformable image registration system for treatment planning and recurrence CT scans: validation in the head and neck region. Strahlenther Onkol. 2016;192(8):545–551.
- Dai YL, King AD. State of the art MRI in head and neck cancer. Clin Radiol. 2018;73(1):45–59.
- Schakel T, Peltenburg B, Dankbaar J-W, et al. Evaluation of diffusion weighted imaging for tumor delineation in head-and-neck radiotherapy by comparison with automatically segmented 18F-fluorodeoxyglucose positron emission tomography. Phys Imaging Radiat Oncol. 2018;5:13–18.
- Apolle R, Appold S, Bijl HP, et al. Inter-observer variability in target delineation increases during adaptive treatment of head-and-neck and lung cancer. Acta Oncol. 2019;58(10):1378–1385.