
Abstract
Background
Visual inspections of anatomical changes observed on daily cone-beam CT (CBCT) images are often used as triggers for radiotherapy plan adaptation to avoid unacceptable dose levels to the target or OARs. Direct CBCT dose calculations would improve the ability to adapt only those plans where dosimetric changes are observed. This study investigates the accuracy of dose calculations on CBCTs.
Materials and methods
Calibration curves were obtained for CBCT imagers at nine identical accelerators. CBCT scans of a phantom with different density inserts were recorded for two scan modes (Head-Neck and Pelvis) and mean calibration curves were calculated. Subsequently, CBCT scans of the phantom with six different density inserts were recorded, the dose distributions on the CBCTs were calculated and compared to dose on the planning CT (pCT). The uncertainty was quantified by the dosimetric difference between the pCT and the CBCT. The two mean calibration curves were used to calculate the daily delivered CBCT dose for ten Head-Neck-, eleven Lung-, and ten pelvic patients. Additional patient calculations were performed using low-HU empirically corrected calibration curves. Patient doses were compared on target coverage and mean dose, and D1cc for OARs.
Results
The dose differences between pCT and CBCT for phantom data were small for all DVH parameters, with mean deviations below ±0.6% for both CBCT modes. For patient data, it was found that low-HU corrected calibration curves performed the best. The mean deviations for the mean dose and coverage of the target were 0.2%±0.7% and 0.1%±0.6%, across all patient groups.
Conclusion
Dose calculation on CBCT images results in target coverage and mean dose with an accuracy of the order of 1%, which makes this acceptable for clinical use. The CBCT mode specific calibration curves can be used at all identical imaging devices and for all patient groups.
Background
Radiotherapy is typically delivered daily throughout a 5-7-week period. During this time, the patient anatomy may change, for instance by disappearance of atelectasis for lung cancer [Citation1–3], fluctuations in bladder, bowel and rectum filling for pelvic cancer [Citation4–6], and tumor shrinkage for head and neck cancer [Citation7]. To mitigate the treatment uncertainties caused by anatomical changes, large safety margins are generally added to the treatment targets, with the cost of increased dose to surrounding organs at risk. Patient setup based on daily cone-beam CT (CBCT) scans adjusts for translational shifts in target and normal tissue positions [Citation8,Citation9]. However, anatomical changes often result in non-rigid deformations which may not be fully mitigated by translational shifts. To reduce margins while maintaining full target coverage and minimizing the dose to the organs at risk, the anatomical changes must be monitored and the radiotherapy plan adapted throughout the treatment course [Citation1,Citation4,Citation5,Citation10–18].
The evaluation of the need for adaptation may be based on daily or frequent visual inspections of anatomical changes observed on the CBCT scans [Citation8,Citation9]. However, having the daily CBCTs available makes the prospect of daily dose monitoring an attractive possibility. A recent review has summarized former studies reporting on the application of CBCT for dose calculation [Citation19]. A main finding was that simply using the CT calibration curve for CBCT calculations were insufficient and that a CBCT-specific calibration curve should be generated in order to obtain high precision for patient dose calculation. Such curves have previously been shown to result in accuracies of the order of 2% [Citation20–26] when obtained based on phantom calibrations, and it has been demonstrated that the accuracy can be further improved by using patient-specific or population-based calibration curves [Citation20,Citation21,Citation27] or by using HU corrected CBCT images [Citation21,Citation28,Citation29]. The purpose of the present study was to investigate the accuracy of the dose calculation on CBCT images for both phantom and patient data. The study was based on HU-to-mass density conversion curves for multiple CBCT scanners using the stoichiometric [Citation30] calibration method on a commercial phantom. Additionally, the difference between a calibration curve based on the mean value for all CBCT scanners or a low-HU corrected calibration curve was investigated.
Material and methods
Calibration
Calibration curves were obtained for CBCT imagers at nine identical accelerators (Varian TrueBeam v. 2.7, Varian Medical systems, Palo Alto, CA) using stoichiometric calibration. The CBCT scans were acquired for a Gammex (Sun Nuclear Corporation, Germany) phantom simulating either the head and neck (HN, cylindrical diameter 20 cm) or the pelvic region (flattened cylinder of height 30 cm and width 40 cm). The length of the phantom was 16 cm. The CBCT calibration scans were acquired while changing the central insert between fourteen different density inserts, ranging from 0.28 to 1.76 g/cm3, as done in previous studies [Citation30,Citation31]. The diameter of the rods was 3 cm. The scans were acquired using the institution’s clinical CBCT modes for the HN protocol (half trajectory, full-fan bow-tie, 100 kV, 150 mAs, 1.5 mm slice thickness, filtered backprojection using the FDK algorithm) or pelvis protocol (full trajectory, half-fan bow-tie, 125 kV, 1080 mAs, 2 mm slice thickness, filtered backprojection using the FDK algorithm) with a scan length of 10 cm to secure full scatter conditions. Before recording the CBCT scans, a dark field calibration of the imaging device were performed. The imaging isocenter was located in the center of the phantom. The resulting CBCT images were analyzed using homemade software using ImageJ (version 1.53a). The HU values for each insert were obtained within each rod in a virtual cylinder of diameter 1.8 cm and length 4 cm centered around the isocenter and the average value was calculated for each insert. The mean HU values and mass densities for all inserts were used as input for a stoichiometric calibration based on the method of Schneider et al. [Citation30]. The output was discretized into a curve consisting of four contiguous linear sections [Citation32]. Two mean calibration curves were created from the individual curves for the HN and the pelvic CBCT mode, respectively. Scans from a CT scanner (Siemens Somatom go.Open Pro, Siemens Healthcare GmbH, Erlangen, Germany), calibrated using a similar phantom and procedure, was used for the treatment plan calculations.
In order to test the accuracy of the calibration over time, measurements for the two calibration curves were repeated after four months for one of the CBCT imagers selected based on the calibration curve of this imager being very close to the calculated mean curves.
Phantom dose calculations
For both the HN and the pelvis phantoms, six rods with densities ranging from 0.28 g/cm3 (lung tissue) to 1.69 g/cm3 (dense bone) were inserted, see . Both phantoms were scanned at the Siemens CT scanner. Artificial volumes were delineated on the planning CT (pCT) images of the phantoms within each of the six inserts. The cranio-caudal extent of the delineations was 8 cm, symmetrically located around the center of the phantom. A static five-field plan and a two-arc intensity modulated plan were created. The dose coverage of each artificial volume was within 93%-105% for six discrete dose levels to obtain distinctive and steep DVH curves. The positions of the inserts, the extent of the artificial targets and the dose distributions for the static plan and the arc plan are shown in .
Figure 1. Top two rows: Dose color wash showing dose distribution for the static plan on the Gammex phantom in the HN setup, with the six different density inserts and the corresponding DVHs for the six artificial volumes. Two bottom rows: The volumetric modulated 2-arc plan on the Gammex phantom in the pelvis setup, with the six different density inserts and the corresponding DVHs for the six artificial volumes. The artificial tissue equivalent inserts represent: dense lung (green – at 1:30 o’clock), dense bone (red – 4:30), bone (magenta – 7:30), solid water (cyan – 9:00), lung (orange – 10:30), and CaCo3 (blue – center). The dose color wash levels are set at 90% of the mean dose of the inserts.
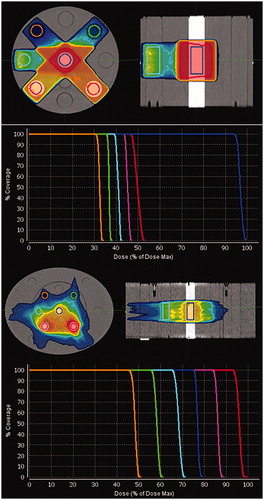
The phantoms were scanned at one of the nine CBCT scanners using the HN mode and the pelvis mode. Scans were recorded using the clinical CBCT scan length of 18.5 cm for HN and 17.5 cm for pelvis. Additionally, a scan was obtained using the clinical CBCT mode for the thorax protocol (full trajectory, half-fan bow-tie, 125 kV, 270 mAs, 2 mm slice thickness, filtered backprojection using the FDK algorithm). The target structures and treatment plans were rigidly transferred to the CBCT images, and delivered doses were calculated on all scans. All structure transferal and dose calculations were performed in MIM v.7.1.0 (MIM Software Inc., Cleveland, OH, USA) using SureCalc (Monte Carlo algorithm) with Extra Precise setting and 2 mm resolution. For the Extra Precise setting, the statistical uncertainty is 0.5% in all volumes with dose D > 0.7Dmax. Dose to medium was reported throughout the manuscript. Since, two of the chosen inserts had high mass densities (in order to represent bone and dense bone) artifacts were observed in the recorded CBCTs. To evaluate the effect of the artifacts on the dose calculation, additional calculations were performed in an artificial image with HU replacement by a water-equivalent value in the entire phantom except in the six inserts. The dose distributions were compared on the following three DVH parameters: dose coverage (V90%), near maximum dose (D1cc), and mean dose for the artificial targets within each of the six inserts. To test the accuracy across all imaging devices, CBCT scans were recorded for both the HN and pelvis phantom with the six previously used different density inserts for all nine imaging devices four months after the first calibration. All values are given as mean values ± 1 standard deviation.
Patient dose calculation
Daily CBCT scans for a group of 11 lung cancer, 10 pelvic cancer and 10 HN-cancer patients, treated at Aarhus University Hospital in 2020 were selected for assessment of calculation accuracy. Patient and plan characteristics are summarized in supplementary material (Table S1). For each patient, one of the daily CBCT scans was selected based on the criterion that the anatomy and patient positioning at the CBCT scan were as similar to that at the pCT scan as possible. The selection was based on qualitative comparison of patient anatomy on all slices of the CT and the CBCT. An example of one lung cancer patient is shown in . Examples of one HN patient and one pelvis patient are shown in the supplementary material. In order to evaluate mean doses to relevant organs at risk, which in some cases extended outside the cranio-caudal field of view of the CBCT scan, merged CBCTs were generated for all CBCT scans by stitching the deformed CT scan onto the CBCT and hereby replicating the tissue outside the field-of-view of the CBCT scan. Target structures and organs at risk were rigidly transferred to the merged CBCTs by use of a six degrees of freedom bony anatomy match. Using the same registration, the treatment plan was recalculated on the merged CBCT using the mean value calibration curve for either HN or pelvis (pelvis and thorax patients). In all patient scans, the dose coverage (D98%) and the mean dose was compared between pCT and CBCT for selected targets and the near maximum dose (D1cc) was compared for selected organs at risk.
Figure 2. Example of lung cancer patient chosen for dose comparison. The pCT is at the left (green), the merged CBCT at the right (red), and the 6 D fusion between the two is shown in the middle. Tissue being identical on both scans appears in white, yellow, brown colors (depending on tissue density). Deviations appear in red or green. Gross tumor volume for tumor and one lymph node is shown as a red line and the clinical target volumes are shown as a pink line.
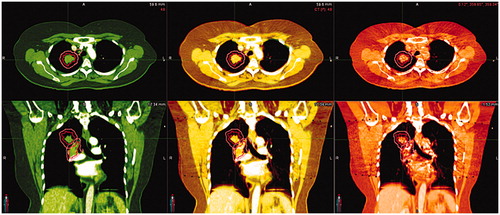
Table 1. Dose differences in percentage between the pCT and the CBCT for the six different density artificial targets shown in for the HN- and pelvis CBCT mode.
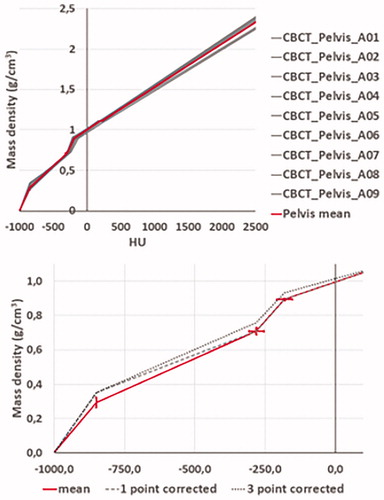
Previously, it was shown that a calibration, such as the one evaluated in this study, underestimated the dose deposited in tissues with low HUs, such as lung tissue [Citation24]. Thus, additional dose calculations were performed using 1-point corrected and 3-point corrected calibration curves. For the 1-point corrected curve, the point at −850 HU was increased by 0.06 from 0.195 (HN) or 0.293 (pelvis), see . For the 3-point corrected calibration curve, additionally, the next two points (approximately at −280 HU and −180 HU) were increased by 0.05 and 0.04, respectively. Initially, dose calculations were performed for all patients using the individual accelerator calibration curves. It was found that the curve originating from one of the accelerators minimized underestimation of dose for low HU values. The corrections values for the 1-point and 3-point corrected curves were based on the low-HU curve for this specific accelerator. All structure transferal and dose calculations were performed in MIM v.7.1.0 using SureCalc with Extra Precise setting and 2 mm resolution. The doses were compared with respect to target coverage (D98%), target mean doses, and near maximum doses (D1cc) to relevant organs at risk.
In one patient, CBCT scans from three days were selected. At day one and two, the patient was treated at the same accelerator, while the patient was treated at one of the other accelerators for the third day. For all three fractions, the dose calculated was compared. All values are given as mean values ± 1 standard deviation.
Results
CBCT imager calibration curves obtained at the nine imaging devices are shown together with the mean calibration curve in (top) for the pelvis CBCT mode. Small deviations from the mean curve were observed, with standard deviations below 29.6 HU and below 0.07 g/cm3. Corresponding curves for the HN CBCT mode are shown in the supplementary material. For HN, the deviations from the mean curve were smaller with standard deviations below 3.8 HU and below 0.03 g/cm3. For the HN CBCT mode, calibration points from the CBCT imager at accelerator 1 were not included in the mean value calculation, since the standard deviations for the individual measurements were much larger than for the other imaging devices. The HN and pelvis calibration curves obtained at the four-month single imager control measurements were within one standard deviation of the mean curve obtained from the first measurements at all nine imaging devices.
Figure 3. Top: Calibration curves measured at nine CBCT scanners (grey) and the calculated mean calibration curve (red) for the pelvis CBCT mode. Bottom: Zoom-in of the mean calibration curve (red) on the negative HU part of the x-axis, together with the 1-point corrected - (dashed black) and 3-point corrected curve (dotted black). On both plots, 1-standard deviation is shown, both x and y-direction, for the mean curve.
For the phantom measurements, the dose differences between the pCT and the corresponding CBCT are summarized in . Negative values indicate that the calculated CBCT dose was higher than the CT dose. Regarding all parameters, differences were very small, with mean deviations below ± 1.0% for both the HN and the pelvis/thorax CBCT modes. No trends were observed between the dose deviation and the mass density of the different insert or between the two CBCT modes.
Comparisons between the pelvis CBCT and the thorax CBCT mode showed very small differences, with a mean difference of −0.29% ± 0.18%. Thus, from here on, the pelvis mode is used for both thorax and pelvis patients. The dose difference between the DVH parameters calculated for the recorded CBCT images and the HU-overwritten CBCT was 0.01% ± 0.35%, thus only minor dosimetric effects arise from the artifacts in the CBCT image.
Initially, CBCT scans of the two phantom setups with different density inserts were only recorded at one accelerator. CBCT scans for the same setup were recorded at all nine imaging devices four months later. The mean deviations for the individual DVH parameters compared to the chosen reference imaging device were −0.18% ± 0.47%.
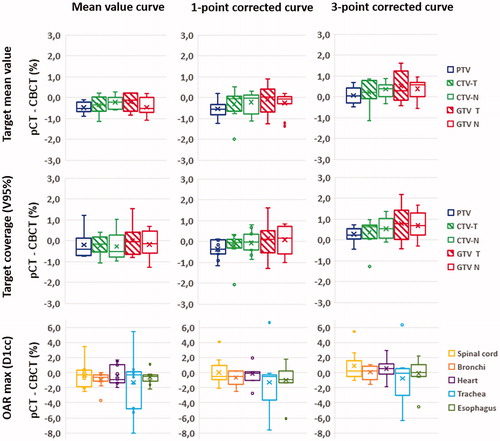
For patient dose calculations both the mean curve, the 1-point corrected curve, and the 3-point corrected curve were used. The 1-point and 3-point corrected curves are presented in Figure 3 (bottom) for Pelvis and in (bottom) for HN. For the eleven lung cancer patients, the differences in target mean dose and target coverage between the pCT and the CBCT for the three different calibration curves are summarized in for target structures: PTV, CTV-T, CTV-N, GTV-T, and GTV-N. For the mean calibration curve, the averages of the difference between the pCT and the CBCT in PTV mean dose and PTV coverage were −0.4% ± 0.4% and −0.2% ± 0.6%, respectively. This was almost unchanged for the 1-point corrected calibration curve, whereas it increased to 0.3% ± 0.5% and 0.5% ± 0.6%, respectively, for the 3-point curve. The same trend with almost no change switching to the 1-point corrected calibration curve and an increase, yielding values above zero, were observed for the other target structures. For the organs at risk (spinal cord, bronchi, heart, trachea, and esophagus), the mean value of the near maximum dose ranged between −1.3 and −0.3% when the mean curve was used, and between −0.7 and 0.9% for the 3-point corrected curve.
Figure 4. For the 11 lung cancer patients: box-plots of the difference between the pCT and the CBCT in near maximum dose for relevant organs at risk (green), target coverage (blue), and target mean values (red), calculated using one of the three different calibration curves: the mean value curve (left), the 1-point corrected curve (middle), or the 3-point corrected curve (right). For each dataset the ‘minimum’, first quartile, median, third quartile, ‘maximum’, and mean value (x) are given. Negative values indicate that the calculated CBCT dose was higher than the CT dose.
For both the pelvis and the HN cancer patients, no differences were observed in the CBCT dose distributions by switching from the mean calibration to the 1-point corrected calibration curves. For dose calculation using the 3-point corrected curve, the dose differences for both target mean doses, target coverages, and near maximum doses to organs at risk were closer to zero compared to calculations using the mean value curve. In the pelvis patients, the average of the PTV mean dose and coverage were 0.4% ± 0.4% and 0.1% ± 1.1%, respectively for the 3-point method. All near maximum doses to organs at risk were within 2% (see supplementary material). In the HN cancer patients, the average of the CTV1 mean dose and coverage was 0.0% ± 0.8% and 0.1% ± 1.0%, respectively for the 3-point method. The vast majority of near maximum doses to organs at risk were within 2% (see supplementary material).
A maximum dose difference of 0.3% was found for the PTV mean dose and coverage for the patient with multiple CBCT scans used for dose calculation.
Discussion
CBCT images are widely used in radiotherapy clinics to evaluate and correct the daily patient setup. The images may also be used in a monitoring system to detect anatomical changes, which may affect the dose delivery. Qualitative investigations of the anatomical changes may be used to trigger plan adaptation [Citation1,Citation15]. However, in order to ensure that all adaptation needs are correctly identified, daily dose calculations are required. In this study, we have evaluated the use of direct HU-to-mass density calibration curves for direct dose calculation on phantom CBCT images. Similar studies have previously been carried out and it has been found that phantom-based calibration curves yield calculation accuracies in the order of 2% [Citation20–25]. For the phantom data presented in this study, mean dose deviations below 1% were found for both CBCT modes. Furthermore, all nine imaging devices yielded close to the same dose deviation compared to the pCT (mean deviation −0.18% ± 0.47%). One of the reasons to the here observed deviations between the pCT and the CBCT doses for the phantom data could be that the calibration curves are measured with a short CBCT scan length, providing full scatter conditions in the calibration situation. The clinical CBCT scan modes used for the phantom dose calculations have scan lengths comparable to the phantom length and therefore, full scatter conditions may not be fulfilled at the ends of the phantom. Other studies have shown that the accuracy can be further improved compared to direct phantom calibrations by generating patient-specific or population-based calibration curves [Citation20,Citation21,Citation27]. In this study, we have chosen a different route and generated CBCT mode-specific calibration curves. Repeated measurements of the two calibration curves using a chosen reference imaging device, carried out with four months in between, yielded curves within one standard deviation of the mean curve. The use of patient-specific or population-based calibration curves are not generalizable and may not be transferred between departments. Furthermore, regular upgrades affecting the CBCT imaging system would require an audit of the calibration curve based on a number of patients CBCT scans obtained after the upgrade, in order to verify and update the calibration curve if needed. Methods using deformation algorithms for either dose transfer or generation of synthetic CT images based on the CBCT image rely on the accuracy of the deformation. In patients with large deformations, major discrepancies may be seen between the CBCT and the synthetic CT and affect target and organs at risk delineation, as well as and their dosimetric evaluations [Citation27,Citation33]. Since no patient data are needed to achieve dose calculation accuracies for phantom data on the order of 1%, this method is easily transferred between departments with the same imaging equipment and allows for a fast update after changes in the CBCT image system. Both the method presented here, and methods based on patient-specific or population-based calibration curves require that dose differences on actual patient scans are evaluated. When evaluating dose calculation accuracy on patient CBCT scans, patients with very constant anatomy and positioning at the two scans must be chosen. Even so, small differences will always be present and will thus limit the obtainable accuracy. Despite of this, the vast majority of our patient calculated dose differences lie within ±1%. In order to use the CBCT calibration for clinical decisions, the dose differences between the pCT and the CBCT must be small, e.g. below 1–2%. This is already achieved by using the direct phantom mean calibration curve. However, it is preferable that a dose difference for target structures, if any, is positive whereby the CBCT dose is lower than the pCT dose. Hereby, slightly too many patients will be flagged for dose deviations and will require manual inspection. This will increase the workload, but secures that patients with potential clinically relevant dosimetric changes are not overlooked. In our clinic, we have chosen the 3-point corrected calibration curve as this curve results in dose differences very close to zero or slightly above zero. One of the HN patients showed a large deviation in both target coverage and target mean dose (see supplementary materials). The dose deviation was due to a very noisy CBCT scan requiring manual inspection. For an acceptance limit of 1%, the dosimetry of the patient would have been approved if the mean calibration curve had been used. However, by using the 3-point curve, this patient was flagged for further investigations.
The increments for the 3-point corrected calibration curve were empirically chosen such that the mean dose differences to pCT were smaller than or comparable to those obtained by the mean value calibration curve. In a former study [Citation24], we have shown that the HU values in the lung tissue were considerably lower at the CBCT than at the pCT. To circumvent this, the mass density values of the calibration curve were artificially increased. For the phantom measurements we did not see this underestimation of calculated dose in the low HU-region and no correction of the calibration curves were performed. However, in lung cancer patients the lung tissue has areas with HU values as low as −800 to −900 HU while the insert which represent thin lung tissue has a mean HU value of approximately −700. Additionally, we used this curve for pelvic patients with air-filled intestines. Organ movement during the recording of the patient CBCT scan may lead to distortion of the CT values of low-density tissues as e.g. lungs and intestines.
If future changes affecting the image quality are made to the CBCT system, the 3-point correction curve will need to be validated based on new prospective patient data. However, in this period of time the mean value calibration curve can be used, with slightly changed limits for adaptation. As the CBCT curves are quite similar, the mean or 3-point calibration curve can also be used for new True Beam accelerators with the same imaging devices or at other departments. CBCT scans acquired for the same patient at two different imaging devices showed a maximum deviation of 0.3% for the target dose. This demonstrates a good robustness of the dose calculation toward differences between imaging devices.
The here reported dose differences between the pCT and the CBCT are treated as a systematic offset and can thus be mediated by introducing a corrected calibration curve. Variations on an individual patient level have not been thorough investigated. However, CBCT scans acquired for the same patient at three treatment days showed a maximum deviation of 0.3% for the target dose. Thus, clinical adaptations based on CBCT dose calculations may result in false positives or worse, false negatives. By choosing a high clinical acceptance limit one may minimize the false negatives and ensure that all relevant patients are flagged for further investigation. This may come with flagging some false positives which have to be investigated manually.
All data reported on in this study are obtained with the imaging isocenter at the center of either the phantom or the patient. If the clinical practice is to place the imaging isocenter at the tumor position, additional calibration measurements have to be recorded to evaluate the effect of a laterally positioned imaging isocenter. For the MC based algorithm SureCalc, dose to medium was reported. However, if dose to water had been applied, this correction would likely amplify dose differences for organs at density interfaces.
The aim of the present study was automated dose monitoring of the target coverage and maximum dose to critical normal tissues on the daily CBCT for all patients receiving radiotherapy. However, in order to obtain automatic flagging of patients with large deviations in the daily dose necessitating/demanding plan adaptation, specific action limits for DVH parameters have to be chosen. This imposes new challenges since it relies on correct structure delineation on the CBCT. Deformable algorithms used for transfer of target and organs at risk from the pCT to the CBCT may introduce large uncertainties, especially for pelvis cancer patients [Citation34–36]. Also, motion during the recording of the CBCT and air within the abdomen degrades the image quality, which both affects the structure transfer and dose calculation accuracy. Therefore, different strategies may be used depending on the anatomical region. For HN- and lung cancer patients where the target structures can de deformed onto the daily CBCT with high accuracy, the daily variation in selected DVH parameters can be used to evaluate the need for manual inspection and subsequent adaptation. For pelvic cancer patients, the deformable structure transfer is error prone. In these patients, the dose distribution on the CBCT may be used for visual evaluation of target coverage. An alternative approach to the one presented here is to correct the HU of the CBCT scans to correspond to that of the pCT and use the CT calibration curve to perform dose calculations [Citation21,Citation28,Citation29]. These methods have the advantage that the patient specific precision is improved and that artifacts are reduced. On the other hand, such methods require a similar pCT and CBCT for each individual patient, which is not always obtainable and/or the use of deformable registration which introduces new and for some methods possibly larger uncertainties when major anatomical changes are observed.
Conclusion
Dose calculation on CBCT images using a stoichiometric HU-to-mass density calibration curve results in target coverage and target mean doses within an accuracy on the order of 1%, which makes this acceptable for clinical use. By having two calibration curves, one for HN CBCT scans and one for thorax/pelvis scans, the same curves can be used for all TB imaging devices and for all patient groups. The dose calculations can be used for flagging of patients with a need for plan adaptation by either automatic evaluation of dose differences based on DVHs (HN and thorax), or a manual inspection of the recalculated dose distribution (pelvis region).
Supplemental Material
Download Zip (890.5 KB)Acknowledgement
We would like to acknowledge MIM Software Inc. for providing a research agreement.
Disclosure statement
No potential conflict of interest was reported by the author(s).
Additional information
Funding
References
- Møller DS, Holt MI, Alber M, et al. Adaptive radiotherapy for advanced lung cancer ensures target coverage and decreases lung dose. Radiother Oncol. 2016;121(1):32–38.
- Møller DS, Khalil AA, Knap MM, et al. Adaptive radiotherapy of lung cancer patients with pleural effusion or atelectasis. Radiother Oncol. 2014;110(3):517–522.
- Hoffmann L, Holt MI, Knap MM, et al. Anatomical landmarks accurately determine interfractional lymph node shifts during radiotherapy of lung cancer patients. Radiother Oncol. 2015;116(1):64–69.
- Vestergaard A, Muren LP, Lindberg H, et al. Normal tissue sparing in a phase II trial on daily adaptive plan selection in radiotherapy for urinary bladder cancer. Acta Oncol. 2014;53(8):997–1004.
- Heijkoop ST, Langerak TR, Quint S, et al. Clinical implementation of an online adaptive plan-of-the-day protocol for nonrigid motion management in locally advanced cervical cancer IMRT. Int J Radiat Oncol Biol Phys. 2014;90(3):673–679.
- Nijkamp J, Pos FJ, Nuver TT, et al. Adaptive radiotherapy for prostate cancer using kilovoltage cone-beam computed tomography: first clinical results. Int J Radiat Oncol Biol Phys. 2008;70(1):75–82.
- van Kranen S, Hamming-Vrieze O, Wolf A, et al. Head and neck margin reduction with adaptive radiation therapy: robustness of treatment plans against anatomy changes. Int J Radiat Oncol Biol Phys. 2016;96(3):653–660.
- Shaw CC. Cone beam Computed Tomography (Imaging in medical diagnosis and therapy). CRC Press; 2014.
- Jaffray DA, Siewerdsen JH. Cone-beam computed tomography with a flat-panel imager: initial performance characterization. Med Phys. 2000;27(6):1311–1323.
- Yan D. Adaptive radiotherapy: merging principle into clinical practice. Semin Radiat Oncol. 2010;20(2):79–83.
- Sonke J-J, Aznar M, Rasch C. Adaptive radiotherapy for anatomical changes. Semin Radiat Oncol. 2019;29(3):245–257.
- Morgan HE, Sher DJ. Adaptive radiotherapy for head and neck cancer. Cancers Head Neck. 2020;5:1.
- Tan LT, Tanderup M, Kirisits C. Image-guided adaptive radiotherapy in cervical cancer. Semin Radiat Oncol. 2019;29(3):284–298.
- Kavanaugh J, Hugo J, Robinson G, et al. Anatomical adaptation-early clinical evidence of benefit and future needs in lung cancer. Semin Radiat Oncol. 2019;29(3):274–283.
- Kwint M, Conijn S, Schaake E, et al. Intra thoracic anatomical changes in lung cancer patients during the course of radiotherapy. Radiother Oncol. 2014;113(3):392–397.
- Matuszak MM, Kashani R, Green M, et al. Functional adaptation in radiation therapy. Semin Radiat Oncol. 2019;29(3):236–244.
- Peyraga G, Robaine N, Cohen-Jonathan-Moyal E, et al. Molecular PET imaging in adaptive radiotherapy: brain. Q. J Nucl Med Mol Imaging. 2018;62(4):337–348.
- Hamming-Vrieze O, Navran A, Al-Mamgani A, et al. Biological PET-guided adaptive radiotherapy for dose escalation in head and neck cancer: a systematic review. Q J Nucl Med Mol Imaging. 2018;62(4):349–368.
- Giacometti V, Hounsell A, Mcgarry C. A review of dose calculation approaches with cone beam CT in photon and proton therapy. Phys Med. 2020;76:243–276.
- Richter A, Hu Q, Steglich D, et al. Investigation of the usability of conebeam CT data sets for dose calculation. Radiat Oncol. 2008;3(1):42–13.
- Fotina I, Hopfgartner J, Stock M, et al. Feasibility of CBCT-based dose calculation: comparative analysis of HU adjustment techniques. Radiother Oncol. 2012;104(2):249–256.
- Kaliyaperumal V, Raphael CJ, Varghese KM, et al. Study of variation in dose calculation accuracy between kV cone-beam computed tomography and kV fan-Beam computed tomography. J Med Phys. 2017; 42(3):171–180.
- Giacometti V, King RB, Agnew CE, et al. An evaluation of techniques for dose calculation on cone beam computed tomography. Br J Radiol. 2018;92(1096):1–11.
- Kaplan LP, Elstrøm UV, Møller DS, et al. Cone beam CT based dose calculation in the thorax region. Phys Imaging Radiat Oncol. 2018; 7:45–50.
- Jarema T, Aland T. Using the iterative kV CBCT reconstruction on the Varian Halcyon linear accelerator for radiation therapy planning for pelvis patients. Phys Med. 2019;68:112–116.
- De Smet M, Schuring D, Nijsten S, et al. Accuracy of dose calculations on kV cone beam CT images of lung cancer patients. Med Phys. 2016;43(11):5934–5940.
- Marchant TE, Joshi KD, Moore CJ. Accuracy of radiotherapy dose calculations based on cone-beam CT: comparison of deformable registration and image correction based methods. Phys Med Biol. 2018;63(6):065003.
- Thing RS, Bernchou U, Hansen O, et al. Accuracy of dose calculation based on artefact corrected Cone Beam CT images of lung cancer patients. phiRo. 2017;1:6–11.
- Poludniowski GG, Evans PM, Webb S. Cone beam computed tomography number errors and consequences for radiotherapy planning: an investigation of correction methods. Int J Radiat Oncol Biol Phys. 2012;84(1):e109–e114.
- Schneider U, Pedroni E, Lomax A. The calibration of CT Hounsfield units for radiotherapy treatment planning. Phys Med Biol. 1996;41(1):111–124.
- Schneider W, Bortfeld T, Schlegel W. Correlation between CT numbers and tissue parameters needed for Monte Carlo simulations of clinical dose distributions. Phys Med Biol. 2000;45(2):459–478.
- Taasti VT, Petersen JBB, Muren LP, et al. A robust empirical parametrization of proton stopping power using dual energy CT. Med Phys. 2016;43(10):5547–5560.
- MacFarlane M, Wong D, Hoover DA, et al. Patient-specific calibration of cone-beam computed tomography data sets for radiotherapy dose calculations and treatment plan assessment. J Appl Clin Med Phys. 2018;19(2):249–257.
- Thor M, Petersen JBB, Bentzen L, et al. Deformable image registration for contour propagation from CT to cone-beam CT scans in radiotherapy of prostate cancer. Acta Oncol. 2011;50(6):918–925.
- Thornqvist S, Petersen JBB, Høyer M, et al. Propagation of target and organ at risk contours in radiotherapy of prostate cancer using deformable image registration. Acta Oncol. 2010;49(7):1023–1032.
- Berendsen FF, van der Heide U, Langerak TR, et al. Free-form image registration regularized by a statistical shape model: application to organ segmentation in cervical MR. Comput Vision Image Understand. 2013;117(9):1119–1127.