
Abstract
Background
Standard treatment of advanced biliary tract cancer (aBTC) is represented by first-line chemotherapy (CT1). However, some patients do not gain any benefit from CT1, contributing to the overall dismal prognosis of aBTC. The present study aimed to devise a prognostic model in aBTC patients receiving CT1.
Methods
A large panel of clinical, laboratory, and pathology variables, available before the start of CT1, were retrospectively assessed in a multi-centric cohort to determine their prognostic value on univariate and multivariate regression analysis. The variables that showed a significant correlation with overall survival (OS) were computed in a three-tier prognostic score. External validation of the prognostication performance was carried out.
Results
Clinical histories of 935 patients (median OS 10.3 months), with diagnosis dates ranging from 2001 to 2017, were retrieved from 14 institutions. According to multivariate analysis, Eastern Cooperative Oncology Group performance status, carbohydrate antigen 19.9, albumin levels, and neutrophil/lymphocyte ratio were strongly associated with OS (p <0.01). The prognostic score could generate a highly significant stratification (all between-group p values ≤0.001) into groups of favorable (comprising 51.5% of the sample), intermediate (39.2%), and poor prognosis (9.3%): median OS was 12.7 (CI95% 11.0–14.4), 7.1 (CI95% 5.8–8.4), and 3.2 months (CI95% 1.7–4.7), respectively. This OS gradient was replicated in the validation set (129 patients), with median OS of 12.7 (CI95% 11.0–14.3), 7.5 (CI95% 6.1–8.9), and 1.4 months (CI95% 0.1–2.7), respectively (all between-group p values ≤0.05).
Conclusion
A prognostic score, derived from a limited set of easily-retrievable variables, efficiently stratified a large population of unselected aBTC patients undergoing CT1. This tool could be useful to clinicians, to ascertain the potential benefit from CT1 at the start of treatment.
Background and rationale
Biliary tract cancer (BTC) comprises epithelial malignancies arising from the different portions of the biliary tree, namely gallbladder carcinoma (GC), ampullary carcinoma (AC), and intrahepatic (ICC), proximal (pECC), and distal (dECC) extrahepatic cholangiocarcinoma. Age-standardized incidence of BTC in Southern Europe (6 cases/100,000 inhabitants/year) is higher than in Central and Northern Europe [Citation1]. In particular, with an incidence of approximately 7–8 cases/100,000/year, BTC represents 1% of all tumor diagnoses in Italy [Citation2]. Diagnosis often occurs at an advanced stage (aBTC), that is no longer amenable to curative surgery, and, even in the resected cases, recurrence rate is high [Citation3]: these malignancies are, therefore, globally characterized by high lethality [Citation4].
However, multi-level differences in biologic features and clinical behaviors are increasingly recognized across aBTC primary sites, as well as within the single primary site [Citation5–9]. In spite of this heterogeneity, the only standard chemotherapy regimen approved in the Western world for aBTC is represented by first-line chemotherapy (CT1) with gemcitabine-platinum salts (cisplatin, oxaliplatin), or gemcitabine monotherapy [Citation10] in unfit patients. Moreover, this option was established quite recently [Citation11], as compared to other malignancies. However, some patients do not derive any benefit from CT1, contributing to the overall dismal prognosis of aBTC.
The purpose of the present study was to develop and validate a new prognostic model for overall survival (OS) from the start of CT1, based on individual clinical, laboratory, and pathology data.
Patients and methods
This study is a multi-center retrospective analysis of aBTC cases conducted by the Cholangiocarcinoma Italian Group Onlus (G.I.C.O.; Gruppo Italiano Colangiocarcinoma Onlus). Inclusion criteria were: histological or cytological diagnosis of aBTC after 2000, and administration of at least one cycle of CT1. Patients with insufficient treatment information were excluded.
Values were collected for an extensive panel of variables, from electronic medical records. Anamnestic and pathology data included sex, primary site, tumor grading, prior biliary stenting, and prior surgery. Inter-center heterogeneity in tumor grading was standardized as follows: well-differentiated tumors were termed as G1, moderately differentiated as G2, poorly differentiated as G3, and undifferentiated or anaplastic as G4; in the case of intratumoral heterogeneity, the maximum grade was recorded; Gx defined a lack of information in the pathology report, such as in the case of certain cytology reports. Values at CT1 initiation were collected for age, disease extension (locoregional, which grouped locally advanced, unresectable disease, and locoregional relapse; distant spread, which grouped initially metastatic disease and recurrence with metastases), number of metastatic sites (no, single, or multiple metastases), Eastern Cooperative Oncology Group performance status (ECOG PS) at the start of CT1. Laboratory analyses, recorded at the medical visit for CT1 initiation or up until two weeks prior to CT1 initiation, included: carcinoembryonic antigen, carbohydrate antigen 19.9 (Ca19.9), hemoglobin (Hb), red blood cell distribution width (RDW), platelets, leucocytes, lymphocytes, neutrophils, monocytes, prothrombin time international normalized ratio, total bilirubin, γ-glutamyl transpeptidase (GGT), alkaline phosphatase (ALP), aspartate aminotransferase (AST), alanine aminotransferase (ALT), albumin, and lactate dehydrogenase. Several derived indicators, already evaluated either in BTC or malignancies of the same district (hepatocellular carcinoma, pancreatic adenocarcinoma), were also calculated: the neutrophil/lymphocyte (NLR), lymphocyte/monocyte, platelet/lymphocyte, ALT/lymphocyte, albumin/GGT, GGT/ALT, albumin/ALP, GGT/platelet, and Hb/RDW ratios, in addition to the systemic inflammation (neutrophils × platelets/lymphocytes) and the prognostic nutritional (10 × albumin + 0.005 × lymphocytes) indexes. Dates of death were retrieved from electronic medical records or administrative files. Data were collected until December 2019 and subsequently analyzed.
OS, defined as the time interval from the first CT1 cycle to death from any cause, was the primary endpoint, and was calculated using the Kaplan–Meyer estimator. OS of patients still under treatment or lost to follow-up were censored at the last follow-up. Confidence intervals were set at 95% (CI95%), and two-sided p values < 0.05 were considered statistically significant unless Bonferroni correction was applied for multiple comparisons. Given its retrospective nature, the study did not consider a pre-planned sample size.
A multivariate analysis by backward stepwise elimination was performed on a limited panel of variables. These variables were selected post hoc, from those that had displayed a significant correlation with OS on univariate analysis, and were chosen without pre-specified criteria as the most meaningful and clinically relevant. Continuous variables were dichotomized using relevant cut points (e.g. definition of anemia). A prognostic model was devised in the form of a score, and calculated as follows: the value of 1 was assigned to each of the four identified highly-significant independent predictors of OS whenever the case fell in the favorable category (e.g. albumin levels ≥3.50 mg/dl), or the respective hazard ratio (HR), rounded to the first decimal place, ascertained by univariate analysis if the patient was identified as being in the unfavorable category (e.g. albumin levels <3.50). Individual prognostic index values (PI) were derived from the sum of these four values. Patients were then categorized into three groups according to their PI. The form of the model, a three-tier prognostic score (favorable, intermediate, and unfavorable prognosis), had been established in advance, whereas optimal cutoff values were empirically researched to achieve an optimized stratification. In particular, the model aimed to maximize the favorable-prognosis group and to minimize the unfavorable-prognosis one, while maintaining very distinct group-specific survivals. Patients with unavailable data were excluded, according to complete case analysis. Survival analysis employed the log-rank test and Cox regression model. Harrell’s c-index, calculated as average from time 0–12 months, as well as areas under the receiver operating characteristic curves for OS events at 6 (AUC6) and 12 (AUC12) months, were employed as estimators of the discriminatory power of the prognostic index. OS curves for selected subgroups of interest were also calculated. External validation was conducted on a cohort from Modena Cancer Center (Italy) selected with identical criteria. Differences in characteristics between the cohorts were assessed by Chi-square and Mann–Whitney U tests. IBM SPSS Statistics for Windows, version 20 (IBM Corp., Armonk, NY, USA) was used as the main statistical program.
The study protocol followed the principles stated by the World Medical Association’s Declaration of Helsinki, and was revised and approved (protocol no 0072135) by the institutional Ethics Committee (Comitato Etico interaziendale AOU Città della Salute e della Scienza di Torino – AO Ordine Mauriziano di Torino – ASL Città di Torino). The validation cohort received approval from the local Institutional Review Board (prot. no AOU 0006255/19). The manuscript was reviewed for adherence to the STROBE (STrengthening the Reporting of OBservational studies in Epidemiology) and TRIPOD (Transparent Reporting of a multivariable prediction model for Individual Prognosis Or Diagnosis) statements [Citation12,Citation13].
Results
Study population
Clinical histories from 935 patients (training cohort) fulfilling the eligibility criteria were retrieved from 14 Italian medical institutions. The diagnosis period ranged from April 2001 to August 2017. Demographic and baseline clinical, pathological and laboratory characteristics of the study population are listed in . In particular, median age was 65.9 years; 51.4% were male; the main primary site was ICC in 50.3% of patients, followed by GC in 21.1%, dECC in 14.2%, pECC in 8.2%, AC in 5.9%, and unknown site in 0.3%. Regarding treatment, 562 patients (60.1%) received per intention-to-treat a gemcitabine-platinum salt doublet as CT1, 224 (24.0%) received gemcitabine monotherapy, and 149 (15.9%) received other regimens. Second-line treatment was received by 45.3% of patients. A total of 814 OS events had already occurred at the data cutoff, and the median OS of the entire cohort was 10.3 months (CI95% 9.5–11.1). Patients treated with gemcitabine monotherapy (7.5 months, CI95% 6.6–8.4), but not those treated with other treatments (12.4 months, CI95% 10.4–14.4), experienced shorter OS (p < 0.001, and p 0.12, respectively) than patients treated with gemcitabine-platinum salts (11.7 months, CI95% 10.8–12.6).
Table 1. Characteristics of the training and validation cohorts.
Prognostic factors
Among the several variables that had a prognostic association with OS on univariate regression analysis [Supplementary Table 1], eight of the most relevant were dichotomized and subject to multivariate analysis. ECOG PS ≥2, Ca19.9 >120 U/l, albumin <3.50 mg/dl, and NLR >3.1 retained a high statistical significance (p <0.01), whereas Hb <12.5 g/dl, prior R0 surgery, disease status, and platelet count >400,000/µl did not ().
Table 2. Univariate and multivariate analysis performed on dichotomized variables.
Prognostic model
All of necessary data for a PI to be calculated were available for 421 patients (training set). The distribution of relevant variables in the training and validation sets was not significantly different from their respective original cohorts [Supplementary Table 2].
The resulting equation of the index was: PI = [1 or 3.0 (ECOG PS)] + [1 or 1.5 (Ca19.9)] + [1 or 2.0 (albumin)] + [1 or 1.7 (NLR)]. Values ranged from 4.0 to 8.2, with a median of 5.0. Patients were categorized into three risk groups, with prognoses categorized as favorable (PI ≤5.0, n = 217, 51.5% of the training set), intermediate (5.0< PI ≤6.5, n = 165, 39.2%), and unfavorable (PI >6.5, n = 39, 9.3%). These groups showed a clear OS gradient, with median values of 12.7 months (CI95% 11.0–14.4), 7.1 months (CI95% 5.8–8.4), and 3.2 months (CI95% 1.7–4.7), respectively, and 1-year OS rates of 55%, 27%, and 13%, respectively. The early and persistent separation of the corresponding survival curves resulted in marked and statistically significant differences (all between-group p values ≤0.001) (; ).
Figure 1. Overall survival in the training set. Blue line, favorable prognosis; green line, intermediate prognosis; red line, unfavorable prognosis.
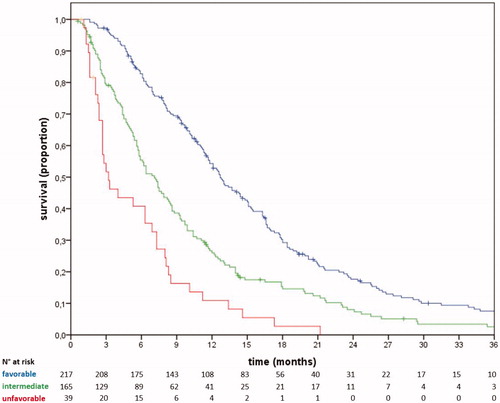
Table 3. Survival according to prognostic group in the training and validation sets.
The c-index, AUC6, and AUC12 of the prognostic model in the training set were 0.69, 0.68 (CI95% 0.62–0.73), and 0.66 (0.61–0.72), respectively [Supplementary Figure 1]. The model retained its prognostic performance in most of the subgroups explored (primary sites, CT1 regimen, advanced age) [Supplementary Table 3, Supplementary Figure 2]. The mere PI, not categorized in prognostic groups, achieved an AUC6 of 0.72 (CI95% 0.67–0.77) and an AUC12 of 0.69 (CI95% 0.63–0.74). Patients with ECOG PS of 0, 1, and 2 achieved median OS of 13.1 (CI95% 11.1–15.1), 7.7 (CI95% 6.1–9.3), and 4.0 (CI95% 0.4–7.6) months, respectively. Stratification according to ECOG PS achieved AUC6 0.65 (CI95% 0.60–0.71) and AUC12 0.67 (CI95% 0.62–0.72), similar to those obtained with the risk score (p = ns).
Validation
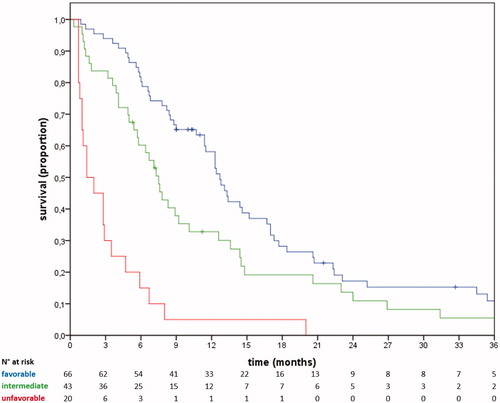
The validation cohort consisted of 159 clinical histories, diagnosed from November 2000 to March 2018. The median OS in the validation cohort was 8.0 months (CI95% 6.7–9.3) (). The necessary data were available for 129 patients (validation set). The stratification performed by the prognostic model retained its statistical significance and clinical validity. In particular, patients classified with favorable (51.2% of the validation set), intermediate (33.3%), and unfavorable (15.5%) groups experienced median OS of 12.7 months (CI95% 11.1–14.3), 7.5 months (CI95% 6.2–8.8), and 1.4 months (CI95% 0.1–2.7), respectively. The 1-year OS was 57%, 33%, and 5%, respectively (; ). C-index, AUC6, and AUC12 values of the model in the validation set were 0.73, 0.75 (CI95% 0.66–0.84), and 0.69 (0.59–0.78), respectively [Supplementary Figure 1].
Figure 2. Overall survival in the validation set. Blue line, favorable prognosis; green line, intermediate prognosis; red line, unfavorable prognosis.
Discussion
Against the backdrop of a poor global prognosis, a certain variability in aBTC clinical histories can be demonstrated. Separating clinical trajectories ex ante carries the ultimate goal of selecting patients for specific tailored treatments. Indeed, some particularly fragile patients do not benefit from chemotherapy, due to primarily progressive disease, treatment complications and/or clinical deterioration. Conversely, other fitter patients will reach second-line chemotherapy [Citation14,Citation15]. While modeling in pretreated aBTC provided interesting results [Citation16,Citation17], the first-line setting appears even more compelling, considering the high dropout rate between lines of treatment observed in real-world practice [Citation18].
A pattern emerges from the heterogeneous available literature on OS predictors: variables most frequently associated with prognosis concern the areas of patient general condition (reflected, for example, by age and ECOG PS) [Citation19–22], nutritional status and residual organ synthetic function (albumin, anemia, prognostic nutritional index) [Citation21,Citation23–27], inflammatory status (such as, notably, NLR) [Citation23,Citation25,Citation28–34], biological aggressiveness (tumor grade, prior surgery) [Citation16,Citation23,Citation35], and tumor burden (metastatic disease, carcinoembryonic antigen, Ca19.9) [Citation21,Citation22,Citation26,Citation32,Citation33].
Considering the risks of collinearity and interference related to a high initial number of variables, not all the significant prognosticators on univariate analysis were indiscriminately tested on a multivariate level. Instead, eight relevant prognosticators were chosen, so that all five of the mentioned areas of the disease-patient interaction were covered. Four variables emerged as strong independent predictors of OS, each reflecting, unlike other reports [Citation25], a distinct domain of the tumor-host dyad: ECOG PS, NLR, albumin, and Ca19.9.
By combining these prognosticators, we devised a reliable prognostic estimator. Prognostic modeling in aBTC is heterogeneous, regarding examined population, study design, and final outcome. Firstly, few studies are dedicated to specific primary sites [Citation32,Citation36,Citation37]; conversely, following the consideration that the treatment is not differential according to the primary site, our analysis considered all disease sites together. In particular, our model included AC cases (which, however, only accounted for 5.6% of the sample), similar to other relevant models [Citation26,Citation35,Citation38,Citation39]. While consistent with most of the existing literature in the field, this approach could be theoretically flawed by differences in prognosis and prognostic criteria between primary sites. Indeed, in accordance with other studies [Citation35,Citation40], our analysis suggested poorer outcomes for GC and a trend toward a favorable impact for AC. However, this issue has not yet been unequivocally demonstrated, with studies reporting a particularly unfavorable prognosis to other primary sites [Citation20,Citation41,Citation42], and the majority of the available literature not observing a differential impact of disease site on OS.
Following the paradigm of treatment homogeneity, unlike others [Citation26,Citation32], we included locally advanced, unresectable disease; clinical histories that would not consider CT1, such as surgically cured disease [Citation35], or patients who would never reach active oncologic care [Citation26,Citation32], were excluded. A minority of patients received nonstandard regimens, which lack level-1 evidence of efficacy. However, given that the intention was to define areas of very high and low benefit from chemotherapy per se, we included these patients in the analysis.
The oncology institutions involved in the present study ranged from small peripheral facilities to high-volume, academic centers. This type of multi-center nature added to the real-life blueprint of the work, as not all patients are treated in large hospitals or enrolled in clinical trials.
We developed a prognostic model in the form of a three-tier prognostic score. In contrast to the mere addition of risk factors [Citation37,Citation39], assigning a coefficient to each addend allows accounting for the weight of each prognostic contributor: in previous comparable models [Citation20,Citation25,Citation26,Citation37,Citation43], these coefficients were variably derived from rounded Chi-square values, regression coefficients, or HRs. Among the analogous models with c-index or AUC provided, these parameters ranged from 0.68 to 0.83, and from 0.63 to 0.65, respectively [Citation25,Citation26,Citation43]. Therefore, the discriminatory performance of the prognostic score resulted as being similar to the comparable literature.
Our model, in which ECOG PS was assigned the highest weight, did not outperform this parameter in mere terms of AUC. However, our attempt was triggered by the specific intent of convenience from the clinician’s point of view. In particular, patients identified as having a favorable prognosis would be good candidates for future, intensified regimens (NCT02591030, NCT03768414), or clinical trials. In modeling, we prioritized the maximization of this subpopulation over obtaining higher survivals in smaller groups [Citation25,Citation44]. Favorable-prognosis patients represented more than half of the population and could expect a satisfactory median OS of 12.7 months, and a 75% chance to live longer than 7 months. At the other end of the spectrum, chances of benefitting from chemotherapy were very low for the unfavorable-prognosis group. Importantly, unlike other comparable models [Citation25,Citation43], our prognostic score circumscribed this population, most suited to best supportive care due to an expected median OS of 3.2 months, to less than 10% of patients. However, we could not compare these outcomes with those of patients undergoing palliative care [Citation26], and only a prospective evaluation may ultimately confirm the lack of benefit from CT1. Therefore, we would not recommend referral of these patients to palliation on the sole basis of our work.
Our work has some limitations. Firstly, the retrospective nature of our study entails not-on-purpose data collection, missing information, numerical imbalance between cohorts, and intrinsic patient selection. Important variables such as C-reactive protein levels, cachexia, weight loss, and state and severity of liver disease were not collected. Only a minority of patients in the training cohort could be evaluated for all the necessary variables to the model. However, the sample size remained large (421 patients), and no significant differences were demonstrated regarding relevant variables, including those prognosticators tested on multivariate analysis. Dichotomization of continuous variables introduces a loss of information. To reduce this problem, cut points were chosen to be clinically meaningful (thresholds for anemia, thrombocytosis, hypoalbuminemia), or to approximate consolidated ones (NLR) [Citation22,Citation23,Citation26]; the median value was used for Ca19.9.
However reasoned, some passages of the model construction were made arbitrarily and post hoc. This called for further testing on an external validation dataset. This model showed good reproducibility in this population, which trended toward worse prognosis. Prospective validation is required for a higher degree of reliability.
Conclusions
Here, we have proposed a set of easily-retrievable prognostic variables, capable of predicting OS in a large, unselected, real-life population of aBTC patients undergoing CT1. Computation of selected variables into a prognostic score provided a tool to perform prognostic stratification with moderate accuracy. This tool could result in being useful to the clinician, in order to ascertain the potential benefit from CT1 during the clinician-patient discussion at the start of treatment.
| Abbreviations | ||
| aBTC | = | advanced biliary tract cancer |
| AC | = | ampullary carcinoma |
| ALP | = | alkaline phosphatase |
| ALT | = | alanine aminotransferase |
| AST | = | aspartate aminotransferase |
| BTC | = | biliary tract cancer |
| Ca19.9 | = | carbohydrate antigen 19.9 |
| CI95% | = | 95% confidence interval |
| CT1 | = | first-line chemotherapy |
| dECC | = | distal extrahepatic cholangiocarcinoma |
| ECOG PS | = | Eastern Cooperative Oncology Group performance status |
| GC | = | gallbladder carcinoma |
| GGT | = | γ-glutamil transpeptidase |
| Hb | = | hemoglobin |
| HR | = | hazard ratio |
| ICC | = | intrahepatic cholangiocarcinoma |
| NLR | = | neutrophil/lymphocyte ratio |
| OS | = | overall survival |
| pECC | = | proximal extrahepatic cholangiocarcinoma |
| PI | = | prognostic index value |
| RDW | = | red blood cell distribution width |
Supplemental Material
Download Zip (864 KB)Acknowledgments
The authors acknowledge all the G.I.C.O. investigators and collaborators for their contribution and support to the present work, with particular regard to Giorgio Valabrega, Eva Galizia, Giorgio Frega, Stefania De Lorenzo, Eleonora Lai, Pina Ziranu, Marco Puzzoni, Pusceddu Valeria, Daniele Santini, Oronzo Brunetti, Antonella Argentiero, Sabina Delcuratolo.
Disclosure statement
The authors declare no conflict of interest with the subject of the present study.
References
- Minicozzi P, Cassetti T, Vener C, et al. Analysis of incidence, mortality and survival for pancreatic and biliary tract cancers across Europe, with assessment of influence of revised European age standardisation on estimates. Cancer Epidemiol. 2018;55:52–60.
- AIRTUM, AIOM Working Group – The figures of cancer in Italy (I numeri del cancro in Italia), Intermedia ed. 2019.
- Primrose JN, Fox RP, Palmer DH, et al. Capecitabine compared with observation in resected biliary tract cancer (BILCAP): a randomised, controlled, multicentre, phase 3 study. Lancet Oncol. 2019;20(5):663–673.
- Miyakawa S, Ishihara S, Horiguchi A, et al. Biliary tract cancer treatment: 5,584 results from the Biliary Tract Cancer Statistics Registry from 1998 to 2004 in Japan. J Hepatobiliary Pancreat Surg. 2009;16(1):1–7.
- Jusakul A, Cutcutache I, Yong CH, et al. Whole-genome and epigenomic landscapes of etiologically distinct subtypes of cholangiocarcinoma. Cancer Discov. 2017;7(10):1116–1135.
- Nakamura H, Arai Y, Totoki Y, et al. Genomic spectra of biliary tract cancer. Nat Genet. 2015;47(9):1003–1010.
- Sia D, Hoshida Y, Villanueva A, et al. Integrative molecular analysis of intrahepatic cholangiocarcinoma reveals 2 classes that have different outcomes. Gastroenterology. 2013;144(4):829–840.
- Nepal C, O'Rourke CJ, Oliveira DVNP, et al. Genomic perturbations reveal distinct regulatory networks in intrahepatic cholangiocarcinoma. Hepatology. 2018;68(3):949–963.
- Jain A, Borad MJ, Kelley RK, et al. Cholangiocarcinoma with FGFR genetic aberrations: a unique clinical phenotype. J Clin Oncol Precis Oncol. 2018;2:1–12.
- Valle JW, Borbath I, Khan SA, et al. Biliary cancer: ESMO Clinical Practice Guidelines for diagnosis, treatment and follow-up. Ann Oncol. 2016;27(suppl 5):v28–v37.
- Valle J, Wasan H, Palmer DH, et al. Cisplatin plus gemcitabine versus gemcitabine for biliary tract cancer. N Engl J Med. 2010;362(14):1273–1281.
- Collins GS, Reitsma JB, Altman DG, et al. Transparent reporting of a multivariable prediction model for individual prognosis or diagnosis (TRIPOD): the TRIPOD statement. Br J Cancer. 2015;112(2):251–259.
- von Elm E, Altman DG, Egger M, et al. The Strengthening the Reporting of Observational Studies in Epidemiology (STROBE) statement: guidelines for reporting observational studies. Ann Intern Med. 2007;147(8):573–577.
- Brieau B, Dahan L, De Rycke Y, et al. Second-line chemotherapy for advanced biliary tract cancer after failure of the gemcitabine-platinum combination: a large multicenter study by the Association des Gastro-Entérologues Oncologues. Cancer. 2015;121(18):3290–3297.
- Schweitzer N, Kirstein MM, Kratzel AM, et al. Second line chemotherapy in biliary tract cancer: outcome and prognostic factors. Liver Int. 2019;39(5):914–923.
- Fornaro L, Cereda S, Aprile G, et al. Multivariate prognostic factors analysis for second-line chemotherapy in advanced biliary tract cancer. Br J Cancer. 2014;110(9):2165–2169.
- Neuzillet C, Casadei Gardini A, Brieau B, et al. Prediction of survival with second-line therapy in biliary tract cancer: actualisation of the AGEO CT2BIL cohort and European multicentre validations. Eur J Cancer. 2019;111:94–106.
- Takahara N, Nakai Y, Isayama H, et al. Second-line chemotherapy in patients with advanced or recurrent biliary tract cancer: a single center, retrospective analysis of 294 cases. Invest New Drugs. 2018;36(6):1093–1102.
- Ma L, Qiu J, Zhang Y, et al. Prognostic factors for operable biliary tract cancer: serum levels of lactate dehydrogenase, a strong association with survival. OTT. 2018;11:2533–2543.
- Park I, Lee JL, Ryu MH, et al. Prognostic factors and predictive model in patients with advanced biliary tract adenocarcinoma receiving first-line palliative chemotherapy. Cancer. 2009;115(18):4148–4155.
- Bridgewater J, Lopes A, Wasan H, et al. Prognostic factors for progression-free and overall survival in advanced biliary tract cancer. Ann Oncol. 2016;27(1):134–140.
- Cho KM, Park H, Oh DY, et al. Neutrophil-to-lymphocyte ratio, platelet-to-lymphocyte ratio, and their dynamic changes during chemotherapy is useful to predict a more accurate prognosis of advanced biliary tract cancer. Oncotarget. 2017;8(2):2329–2341.
- McNamara MG, Templeton AJ, Maganti M, et al. Neutrophil/lymphocyte ratio as a prognostic factor in biliary tract cancer. Eur J Cancer. 2014;50(9):1581–1589.
- Salati M, Filippi R, Vivaldi C, et al. The prognostic nutritional index predicts survival and response to first-line chemotherapy in advanced biliary cancer. Liver Int. 2020;40(3):704–711.
- Salati M, Caputo F, Cunningham D, et al. The A.L.A.N. score identifies prognostic classes in advanced biliary cancer patients receiving first-line chemotherapy. Eur J Cancer. 2019;117:84–90.
- Park HS, Park JS, Chun YJ, et al. Prognostic factors and scoring model for survival in metastatic biliary tract cancer. Cancer Res Treat. 2017;49(4):1127–1139.
- Akgül Ö, Bagante F, Olsen G, et al. Preoperative prognostic nutritional index predicts survival of patients with intrahepatic cholangiocarcinoma after curative resection. J Surg Oncol. 2018;118(3):422–430.
- Buettner S, Spolverato G, Kimbrough CW, et al. The impact of neutrophil-to-lymphocyte ratio and platelet-to-lymphocyte ratio among patients with intrahepatic cholangiocarcinoma. Surgery. 2018;164(3):411–418.
- Zhou LH, Luo XF. Platelet to lymphocyte ratio in biliary tract cancer: review and meta-analysis. Clin Chim Acta. 2017;474:102–107.
- Hu G, Liu Q, Ma JY, et al. Prognostic significance of platelet-to-lymphocyte ratio in cholangiocarcinoma: a meta-analysis. Biomed Res Int. 2018;2018:1–8.
- Beal EW, Wei L, Ethun CG, et al. Elevated NLR in gallbladder cancer and cholangiocarcinoma - making bad cancers even worse: results from the US Extrahepatic Biliary Malignancy Consortium. HPB. 2016;18(11):950–957.
- Du JH, Lu J. Circulating CEA-dNLR score predicts clinical outcome of metastatic gallbladder cancer patient. J Clin Lab Anal. 2019;33(2):e22684.
- Lee BS, Lee SH, Son JH, et al. Neutrophil-lymphocyte ratio predicts survival in patients with advanced cholangiocarcinoma on chemotherapy. Cancer Immunol Immunother. 2016;65(2):141–150.
- Zhang Y, Shi SM, Yang H, et al. Systemic inflammation score predicts survival in patients with intrahepatic cholangiocarcinoma undergoing curative resection. J Cancer. 2019;10(2):494–503.
- Song W, Zhu ZG, Wu Q, et al. A nomogram to predict overall survival for biliary tract cancer. Cancer Manag Res. 2018;10:1535–1541.
- Xing KL, Lu LH, Huang X, et al. A novel prognostic nomogram for patients with recurrence of intrahepatic cholangiocarcinoma after initial surgery. Front Oncol. 2020;10:434.
- Kim BH, Kim K, Chie EK, et al. Risk stratification and prognostic nomogram for post-recurrence overall survival in patients with recurrent extrahepatic cholangiocarcinoma. HPB. 2017;19(5):421–428.
- Park BK, Paik YH, Park JY, et al. The clinicopathologic significance of the expression of vascular endothelial growth factor-C in intrahepatic cholangiocarcinoma. Am J Clin Oncol. 2006;29(2):138–142.
- Suzuki Y, Kan M, Kimura G, et al. Predictive factors of the treatment outcome in patients with advanced biliary tract cancer receiving gemcitabine plus cisplatin as first-line chemotherapy. J Gastroenterol. 2019;54(3):281–290.
- McNamara MG, Aneja P, Maganti M, et al. Do recurrent and de novo metastatic biliary tract cancer patients have the same outcome on treatment? Abstract #351, ASCO 2015. J Clin Oncol. 2015;33(3_suppl):351–351.
- Kim BJ, Yoo C, Kim KP, et al. Efficacy of fluoropyrimidine-based chemotherapy in patients with advanced biliary tract cancer after failure of gemcitabine plus cisplatin: retrospective analysis of 321 patients. Br J Cancer. 2017;116(5):561–567.
- Peixoto RD, Renouf D, Lim H. A population based analysis of prognostic factors in advanced biliary tract cancer. J Gastrointest Oncol. 2014;5(6):428–432.
- Rovesti G, Leone F, Brandi G, et al. Prognostic role of a new index tested in European and Korean advanced biliary tract cancer patients: the PECS Index. J Gastrointest Cancer. 2021. DOI:https://doi.org/10.1007/s12029-021-00596-z
- Schweitzer N, Fischer M, Kirstein MM, et al. Risk estimation for biliary tract cancer: development and validation of a prognostic score. Liver Int. 2017;37(12):1852–1860.