
Abstract
Background
A common feature of solid tumours that are resistant to therapy is the presence of regions with low oxygen content (i.e., hypoxia). Oxygen electrode studies suggest that localized prostate adenocarcinoma is commonly hypoxic, although conflicting data have been reported between immunohistochemical detection of hypoxia-induced proteins in biopsy specimens and positron emission tomography (PET) imaging of 18F-labeled hypoxia reporters. Although the 2-nitroimidazole 18F-EF5 is well-established to label hypoxic tumour cells in pre-clinical tumour models and clinical trials of multiple primary tumour sites, it has yet to be tested in prostate cancer. The purpose of this study was to evaluate the feasibility of using 18F-EF5 to detect hypoxia in clinical prostate tumours.
Material and methods
Patients with localized adenocarcinoma of the prostate were recruited for pre-treatment 18F-EF5 PET scans. Immunohistochemistry was conducted on diagnostic biopsies to assess the expression of glucose transporter 1 (GLUT1), osteopontin (OPN), and carbonic anhydrase IX (CAIX). Immunoreactivity scores of staining intensity and frequency were used to indicate the presence of tumour hypoxia.
Results
We found low tumour-to-muscle ratios of 18F-EF5 uptake that were not consistent with tumour hypoxia, causing early termination of the study. However, we observed GLUT1 and OPN expression in all prostate tumour biopsies, indicating the presence of hypoxia in all tumours.
Conclusion
Our data do not support the use of 18F-EF5 PET to detect hypoxia in prostate adenocarcinoma, and suggest the use of immunohistochemistry to quantify expression of the hypoxia-inducible proteins GLUT1 and OPN as indications of prostate tumour hypoxia.
Introduction
Solid tumours often contain regions with low oxygen content (hypoxia). Preclinical studies have linked hypoxia to resistance to radiation therapy [Citation1] and chemotherapeutics [Citation2,Citation3], and mechanistic observations support that hypoxia promotes metastatic growth [Citation4]. Clinical data mirror these reports, with solid tumour hypoxia associating with worse patient outcome regardless of primary tumour origin [Citation1] or treatment strategy [Citation5,Citation6]. Overall, tumour hypoxia is a validated predictor of therapy resistance and tumour aggression across many tumour types, although the most appropriate method to quantify tumour hypoxia is not always clear. The gold standard measurement of tissue oxygenation is direct quantification via an oxygen microelectrode probe within a needle inserted into the tissue. Multiple studies have found that the majority of cancerous prostate tissue exhibits a median oxygen electrode reading below 5 mmHg [Citation7,Citation8]. Cellular responses to hypoxia commonly occur at oxygenation levels below 2% O2 (∼15 mmHg), and oxygen electrode readings below 5 mmHg are strongly correlated with tumour radiation resistance [Citation1,Citation9]. Indeed, decreased tumour oxygenation is associated with higher tumour stage [Citation5] and poor outcomes in prostate cancer patients [Citation5,Citation7,Citation8]. Thus, localized prostate adenocarcinomas are commonly hypoxic and hypoxia predicts worse outcome, although quantification of hypoxia is not routinely performed in the clinic. Several less invasive methods to quantify tumour hypoxia have been developed over the past several decades, including assessment of hypoxia-induced protein expression in biopsy samples and drugs that can bind in hypoxic cells for subsequent quantification in biopsy tissue or by non-invasive imaging.
Radiolabelled 18F-fluoromisonidazole (18F-FMISO), 18F-fluoroazomycin-arabinoside (18F-FAZA), and 18F-[2-(2-nitro-1H-imidazol-1-yl)-N-(2,2,3,3,3-pentafluoropropyl) acetamide] (18F-EF5), and the copper-based radiotracer 64Cu-diacetyl-bis[N4-methylthiosemicarbazone] (64Cu-ATSM), have been used to non-invasively measure tumour hypoxia by positron emission tomography (PET). The arguments for and against each radiotracer have been reviewed previously [Citation10–12]. Despite wide testing in breast, lung, head, and neck, and cervical cancers, limited data have been published on PET imaging of hypoxia radiotracers in prostate cancer. Uptake of 18F-FMISO in a small study of four patients with localized, locally advanced, or metastatic prostate cancer showed a wide range in 18F-FMISO demarcated fractional hypoxic volume from 0% to 94%, although anatomical computed tomography (CT) or magnetic resonance imaging (MRI) were not used to identify the prostate gland in this study [Citation13]. More recently, Mainta et al. reported significant uptake of 18F-FMISO in 7 out of 11 high-grade prostate cancer cases by PET/MRI [Citation14], and Supiot et al. used PET/CT to identify significant 18F-FMISO uptake in one-third of patients with intermediate-risk prostate cancer [Citation15]. However, minimal uptake of 18F-FAZA has been reported in prostate cancer tissue compared to benign prostate tissue in 14 patients with untreated localized prostate adenocarcinoma, despite significant hypoxia-inducible factor 1α (HIF1α) staining [Citation16]. The authors concluded that 18F-FAZA PET imaging is not suitable for detecting hypoxic regions in prostate cancer and suggested the degree of hypoxia present may have been below the limit of radiotracer detection. Thus, despite hypoxia being observed by oxygen electrode measurements in prostate tumours [Citation5,Citation7,Citation8] and significant uptake of 18F-FMISO found in a proportion of prostate cancer patients [Citation13–15], the suitability of other PET-based radiotracers to detect hypoxia in prostate cancer patients is unclear.
EF5 has been extensively used in pre-clinical studies across many tumour types to label and quantify hypoxic tumour cells and has shown promising results in clinical settings with head and neck cancer, including correlation with patient outcome [Citation17]. PET measurement of 18F-EF5 uptake has been used to quantify tumour hypoxia in lung cancer [Citation18], head and neck cancer [Citation17,Citation19,Citation20], and ovarian cancer [Citation21]. Yapp et al. previously found 18F-EF5 PET to effectively detect hypoxia in the Shionogi model of prostate cancer, in both the androgen-dependent and independent phases of the model [Citation22,Citation23], but 18F-EF5 PET has yet to be tested for detecting hypoxia in clinical prostate cancer.
The purpose of the current study was to evaluate the suitability of 18F-EF5 for the detection of hypoxia in localized prostate adenocarcinoma by PET. We, therefore, compared 18F-EF5 uptake with immunohistochemistry (IHC) based assessment of the hypoxia-induced proteins glucose transporter-1 (GLUT1), osteopontin (OPN), and carbonic anhydrase-9 (CAIX).
Methods
Patients
Eight men with newly diagnosed localized adenocarcinoma of the prostate were recruited for this study. Between 8 and 12 core needle biopsies were collected from each patient for pathology assessment at diagnosis, with 42–100% of biopsied tissue containing tumour (). A subset of 2–3 tumour-positive biopsy specimens was selected from each patient for IHC evaluation of GLUT1, OPN, and CAIX staining. Biopsies were selected for IHC analysis based on the following criteria: greatest proportion of tumour tissue in the biopsy, highest total Gleason score within the biopsy, and preference for selecting biopsies from opposite sides of the prostate to account for spatial heterogeneity. The average time between diagnostic biopsy acquisition and 18F-EF5 PET scan was approximately 3 months. This study was approved by the BC Cancer Research Ethics Board.
Table 1. Patient characteristics, pathology, and 18F-EF5 measurements.
18F-EF5 synthesis & imaging
Preparation of 18F-EF5 was conducted at the TRIUMF particle accelerator centre (University of British Columbia, Vancouver, Canada) with a molar activity of 2.6 ± 0.2 Ci/mmol (95 ± 9 GBq/mmol) via an electrophilic addition reaction using 18F-F2 as previously described [Citation24]. Patients were given an intravenous (iv) infusion of 300–374 MBq of 18F-EF5 as a slow bolus (over 60 s) followed by a 20 mL normal saline flush. Patients received 20 mg of furosemide iv 30 min prior to imaging to void the bladder. Two or three hours after 18F-EF5 infusion, patients were positioned supine and centred on the scanner bed, with a CT topogram acquired to define the PET scanning field centred on the prostate gland. Non-contrast CT images of the pelvic region were acquired for attenuation correction and localization of PET emission data. Immediately thereafter, PET data were acquired in 3D mode using a Siemens Biograph 16 HI-REZ PET/CT scanner (Siemens Medical Solutions, Knoxville, TN, USA). PET imaging consisted of two fields of view over the pelvis for 4 min per bed position. The voxel size was 1.02 × 1.02 × 1.5 mm (x,y,z), with an axial resolution of 4.2 mm at the radial centre and 5.4 mm at a 10 cm radius. Regions of interest were centred on the prostate gland and a 30 mm diameter region of the gluteus maximus muscle, and used to generate maximum standardized uptake values (SUVmax). A tumour to muscle SUVmax ratio of 1.5 or greater was considered hypoxic based on previous publications in other tumour sites [Citation17,Citation20].
Histology
GLUT1 IHC was carried out at the BC Cancer Centre for Translational and Applied Genomics (Vancouver, Canada). CAIX and OPN IHC was performed by the BC Cancer Molecular and Cellular Immunology Core Facility (Victoria, Canada). Primary antibodies were anti-GLUT1 (Millipore, 07-1401, 1:200), anti-OPN (Abcam, ab69498, 1:250), and anti-CAIX (BioScience Slovakia, AB1001, 1:200). Immunoreactive sites were visualized with DAB chromogen followed by haematoxylin counterstain. GLUT1, OPN, and CAIX were individually scored for both staining intensity and proportion of positive staining within the sections. The intensity was scored as negative (0), weak (1), moderate (2), or strong (3). The frequency of positive tumour tissue was quantified using a scoring system based on percentage of tissue staining positively as no staining (0), <1% (1), 1–10% (2), 11–33% (3), 34–67% (4), or >68% (5). Immunoreactive scores (IRS) were calculated by adding together the staining intensity scores and the frequency scores for each biopsy. IRS from multiple biopsies from the same patient were averaged to produce an average IRS for each tumour.
Statistics
Statistical analyses were conducted using Prism8 software (GraphPad). A non-parametric Kruskal–Wallis test with Dunn’s multiple comparison analysis was used to determine the significance of immunoreactive scores. Agreement between GLUT1, OPN, and CAIX staining was interpreted using the Bland–Altman method [Citation25].
Results
Patients were aged 61–75 years with stage T1c to T4 prostate adenocarcinoma and initial prostate serum antigen (iPSA) concentrations ranging from 1.3 to 24 ng/mL (). Volume of the prostate on transrectal ultrasound ranged from 18 to 44 cc. Gleason scores ranged from 3 + 3 to 4 + 5 across all diagnostic biopsy specimens used for clinical pathology and IHC analyses.
PET/CT scans were conducted 2 h post-injection of 18F-EF5. Sample PET/CT images from patient #4 are shown in , with three image slices through the pelvic region showing radiotracer clearance through the bladder (white arrow) and the largely absent uptake in the prostate (dashed circle). Prostate 18F-EF5 SUVmax values ranged from 1.5 to 2.9, although SUVmax values for muscle had a similar range (1.4–2.2), producing tumour-to-muscle (T/M) SUVmax ratios of 0.95 to 1.32 (). While multiple patients had small focal areas of apparent 18F-EF5 uptake that may be consistent with the focal nature of prostate adenocarcinoma, we observed similar small focal areas of 18F-EF5 uptake in skeletal muscle and T/M SUVmax ratios were below the commonly used threshold of 1.5 to identify hypoxia. T/M ratios did not correlate with any clinical features including clinical stage, Gleason score, or extent of disease as indicated by prostate volume or the proportion of tumour-containing biopsies ().
Figure 1. 18F-EF5 uptake in prostate cancer. (A) Representative 18F-EF5 PET (left), CT (centre), and merged PET/CT (right) images of three slices from superior (top) to inferior (bottom) through the pelvic region of patient #4 imaged 2 h after 18F-EF5 injection. 18F-EF5 signal in the bladder is indicated by the white arrow; prostate regions are indicated by the dashed circles. (B) Representative 18F-EF5 PET (top), CT (centre), and merged PET/CT (bottom) images from patient #8 taken 2 and 3 h after 18F-EF5 injection.
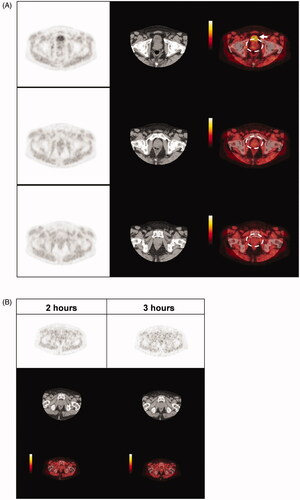
We also performed PET/CT scans 3 h after 18F-EF5 injection in a subset of 4 patients (). We found that between 2 and 3 h after 18F-EF5 injection, the SUVmax T/M ratios decreased in two patients, was unchanged in one patient, and increased in one patient, with T/M ratios ranging from 0.84 to 1.56. Patient #8 had a T/M ratio >1.5 and there may be a potential region of hypoxia indicated by 18F-EF5 uptake in the prostate (). However, several focal spots of 18F-EF5 uptake were again noted in regions outside of the prostate, making it difficult to conclude whether 18F-EF5 was identifying tumour hypoxia in this patient. It should also be noted this patient did not exhibit tumour characteristics that have previously been associated with prostate tumour hypoxia in some studies [Citation14,Citation26] including higher clinical stage, higher Gleason scores, or greater extent of disease compared to the other patients (). This study was terminated after insufficient 18F-EF5 uptake could be identified in the first eight patients recruited, and we then proceeded to test for the presence of tumour hypoxia in these patients based on IHC staining of hypoxia-inducible proteins.
Table 2. 18F-EF5 uptake measured 2 and 3 h post-injection of radiotracer.
Patient biopsies were stained for GLUT1, OPN, and CAIX [Citation27–30], and positive staining was restricted to cancerous tissue in the biopsies. The majority of GLUT1 staining in prostate cancer tissue was intracellular, with similar staining in the cervical cancer tissue employed as a positive control for hypoxic tumour tissue (Supplemental Figure 1(A–C)). Cytosolic GLUT1 staining in IHC has been previously reported in prostate tumour cells, as well as other adenocarcinomas [Citation31], while intracellular GLUT1 localized to Golgi vesicles has been previously reported in prostate carcinoma cell lines [Citation32]. We found cytosolic OPN staining regions in prostate tumours and the positive control tissue (Supplemental Figure 1(G–I)), and strong membranous CAIX staining in the positive control cervical cancer tissue (Supplemental Figure 1(D)) consistent with the known function of CAIX as a membrane glycoprotein involved in pH regulation [Citation33]. Interestingly, we did not observe CAIX staining in most of the prostate tumour samples and in the few prostate lesions positive for CAIX, we observed cytoplasmic and nuclear staining of CAIX with little membrane localization (Supplemental Figure 1(E–F)).
Immunoreactive scores (IRS) for individual biopsies are summarized in . We found that 21 biopsies across 8 patients stained positively for GLUT1, with 1/8 lesions displaying weak staining intensity, 6/8 lesions displaying moderate staining intensity, and 1/8 lesions displaying strong staining intensity in at least one biopsy. Analysis of the frequency of GLUT1 staining revealed that more than 67% of the prostate tumour stained positively for GLUT1 in at least one biopsy from all patients. Similar to GLUT1, all eight prostate lesions stained positively for OPN with one lesion displaying weak staining and seven lesions showing moderate OPN staining intensity. OPN positivity ranged from 1 to 10% in one lesion, 34–67% in two lesions, and more than 67% positive staining in five prostate lesions. Conversely, only three out of eight prostate tumours stained positively for CAIX, with two lesions displaying weak CAIX staining intensity and one lesion showing moderate CAIX staining intensity. CAIX positive tissue was 1–10% in two patients and more than 67% in only one patient. CAIX did not co-localize with GLUT1 or OPN staining (), and combining individual biopsy IRSs to generate a global tumour IRS for each marker indicates that GLUT1 and OPN staining is significantly higher than CAIX across patients (). Matched biopsy specimens sectioned and stained for GLUT1, OPN, and CAIX show consistency between GLUT1/OPN staining and mismatch with CAIX expression in seven out of eight prostate lesions in our cohort (Supplemental Figure 2(A–C)). We used the Bland-Altman method to quantitatively assess potential agreement between GLUT1, OPN, and CAIX IRS within individual biopsies (). Briefly, data points indicate the difference between IRS for the indicated markers within each biopsy (2–3 per patient), which is plotted against the average of the two IRSs [Citation25]. A ‘mean difference’ (dashed line) close to zero and a narrow 95% confidence interval (dotted lines) indicates strong agreement between the two markers. The mean difference between GLUT1 and OPN IRS was 0.59 (95% CI limits: −1.8 to 3.0), while the mean IRS difference between GLUT1 and CAIX was 5.1 (95% CI limits: 0.25–9.93), and the mean IRS difference between OPN and CAIX was 4.2 (95% CI limits: −0.54 to 9.01). These data indicate substantially greater agreement between GLUT1 and OPN than either marker with CAIX. Together, these data indicate that CAIX does not agree with either OPN or GLUT1 expression and that there is strong agreement between OPN and GLUT1 staining in prostate cancer biopsies consistent with previous work [Citation30].
Figure 2. Immunohistochemical detection of GLUT1, OPN, and CAIX expression in prostate cancer tissue. (A) Representative images of moderate GLUT1 staining, (B) moderate OPN staining, and (C) negative CAIX staining in serial sections of biopsy ‘a’ from patient #5. Boxed regions in the left images are enlarged on the right. Scale bars = 200 µm (left) or 50 µm (right). (D) Immunoreactive scores (IRS) were calculated for each patient by averaging IRS values for GLUT1, OPN, and CAIX IHC staining from 2 to 3 biopsies per patient. Data are mean ± SD (n = 8, *p < 0.05, ***p < 0.001, Kruskal–Wallis test with Dunn’s post-hoc analysis).
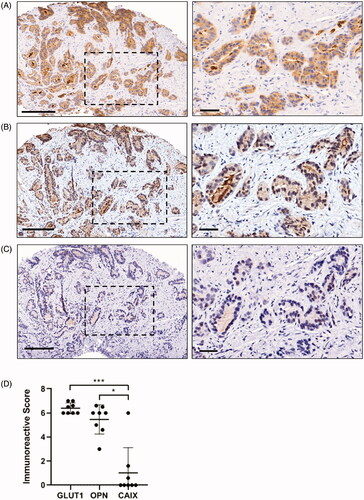
Figure 3. Bland–Altman plots comparing similarities between GLUT1, OPN, and CAIX immunoreactive scores. (A) The difference between GLUT1 IRS values and OPN IRS values within individual biopsies are plotted on the y-axis (closer to zero is more similar) with the average GLUT1/OPN IRS value for the biopsy on the x-axis (higher IRS values indicate more intense and frequent staining). Data points represent individual biopsies (n = 17–22). Dashed line indicates the mean difference between the two markers with 95% CI indicated by the dotted lines; a mean difference close to zero indicates strong agreement between the two markers. (B) GLUT1 IRS compared to CAIX IRS. (C) OPN IRS compared to CAIX IRS.
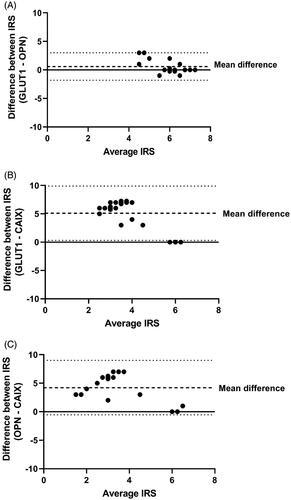
Table 3. GLUT1, OPN, and CAIX IHC scores, Gleason scores, and 18F-EF5 measurements.
We then compared the GLUT1 and OPN IRS with the T/M ratios for 18F-EF5 uptake in each patient (). We found expression of GLUT1 and OPN in biopsies from all prostate tumours imaged by 18F-EF5 PET, and our dataset does not suggest a relationship between 18F-EF5 uptake and hypoxia-associated IHC scores. While patient #8 had the highest T/M ratio 2 and 3 h after radiotracer injection, GLUT1 and OPN staining in this tumour was comparable to other patients. Taken together, these data indicate that 18F-EF5 PET does not adequately detect hypoxia in clinical prostate tumours.
Discussion
Hypoxic regions are a common characteristic of solid tumours. Tumour hypoxia is associated with metastatic dissemination, resistance to therapy, and poor outcome of several tumour types, including prostate cancer [Citation1,Citation3,Citation4]. Early detection of hypoxia in localized prostate adenocarcinoma by non-invasive PET imaging could identify high-risk patients requiring more aggressive treatment approaches, and published evidence suggests 18F-FMISO can be used to identify hypoxia in prostate tumours by PET [Citation13–15]. The objective of this study was to evaluate the suitability of 18F-EF5 for the detection of hypoxia in prostate cancer patients. We found minimal tumour 18F-EF5 uptake despite all prostate tumours scoring positively for two proteins that have been used in the past to indicate hypoxia in prostate tumours, GLUT1 [Citation30,Citation34] and OPN [Citation30,Citation35], suggesting 18F-EF5 PET is not suitable to identify hypoxia in prostate cancer.
The biodistribution of 18F-EF5 in patients has been studied previously, showing rapid and uniform distribution throughout the body within less than 15 min of injection [Citation36]. A range of half-lives has been cited for 18F-EF5 in patients (on the order of 7.5–10.5 h), with some suggestion that shorter half-lives are associated with higher molar activities of 18F-EF5 (i.e., lower concentrations of 18F-EF5 for a given 300 MBq injection) [Citation36]. The specific activity of 18F-EF5 in our study is ∼24-fold higher than these earlier studies [Citation36], but ∼84-fold lower than more recent work showing robust 18F-EF5 uptake by hypoxic head and neck tumours [Citation19]. Our inability to detect significant 18F-EF5 uptake in prostate tumours was therefore not limited by the injected dose of 18F-EF5.
We imaged all tumours 2 or 3 h after 18F-EF5 injection, and it is possible that the sensitivity of 18F-EF5 to identify regions of hypoxia may improve with longer time periods allowed for 18F-EF5 uptake and binding in the tumour. We conducted PET/CT imaging at both 2 and 3 h after 18F-EF5 injection in four patients but found that the T/M ratio improved with time in only one individual while all four patients exhibited IHC-based evidence of hypoxia with average GLUT1 or OPN IRSs of at least 6. The kinetics of 18F-EF5 uptake have been previously examined in head and neck cancer patients where it was observed that the 18F-EF5 T/M ratio can increase during the first 3 h post-injection, but decreases between 3 and 4 h post-injection [Citation20]. Based on these data and the low T/M ratios observed in our study, it is unlikely that 18F-EF5 PET T/M ratios would significantly increase with longer durations between radiotracer injection and PET imaging.
An 18F-EF5 T/M ratio >1.5 is typically used to indicate tumour hypoxia [Citation17,Citation20], and patient #8 imaged 3 h after radiotracer injection had a T/M ratio of 1.56. While the focal 18F-EF5 signal in this patient may represent tumour hypoxia, the presence of similar 18F-EF5 signal foci in the surrounding tissue and unremarkable IHC-based hypoxia scoring from this patient reinforce our conclusion that 18F-EF5 PET should not be relied upon to indicate prostate tumour hypoxia. While biopsies from patient #8 had a high GLUT1 IRS of 7.0, this GLUT1 IRS value was also observed in patient #3 who had the lowest T/M ratio of 0.95. Biopsies from patient #8 and patient #4 had high OPN IRS values of 6–7 and the two highest T/M ratios, although there was a range of T/M ratios for patients with average OPN IRS values greater than 6. Overall, these data suggest that 18F-EF5 PET exhibits limited sensitivity to detect hypoxia in localized prostate adenocarcinoma lesions that stain strongly for two immunohistochemical markers normally associated with tumour hypoxia.
GLUT1 is commonly over-expressed in hypoxic tumour cells to optimize cell metabolism in anaerobic conditions. GLUT1 mRNA expression was previously reported to distinguish prostate cancer from benign prostate hyperplasia, and high GLUT1 mRNA correlated with Gleason score [Citation29]. In localized prostate adenocarcinoma, GLUT1 expression has been observed in core biopsies in conjunction with HIF1α expression [Citation37] and correlated with poor patient outcome in a tissue microarray-based study [Citation34]. However, while some groups have found a high frequency of GLUT1 staining in prostate tumours [Citation31,Citation37], GLUT1 does not always correlate with Gleason score, tumour stage, or PSA levels, and some groups have found only weak GLUT1 staining in prostate tumours [Citation15,Citation38,Citation39]. Supiot et al. also found that weak GLUT1 staining by IHC was not associated with 18F-FMISO uptake in a cohort of prostate cancer patients [Citation15]. Since there is a disparity in the literature regarding the use of GLUT1 to indicate hypoxia in prostate tumours, we stained prostate tumour samples with GLUT1 and OPN, which Rupp et al. used in combination to indicate prostate tumour hypoxia (as defined by pimonidazole staining) [Citation30]. Importantly, pimonidazole was previously shown to correlate strongly with hypoxia quantified by magnetic resonance imaging in over 40 prostate cancer patients [Citation26]. Vergis et al. showed increased OPN expression detected via IHC predicted for worse outcomes in prostate cancer patients treated with surgery [Citation35]. Others have shown that increased OPN levels in prostate cancer tissue positively correlated with Gleason scores [Citation40]. We found frequent moderate to high-intensity staining of both GLUT1 and OPN in our patient cohort, consistent with tumour hypoxia. While GLUT1 and OPN staining levels did not associate with Gleason scores, our dataset is of limited size, and biopsies submitted for IHC were selected in part to assess samples with greater Gleason scores rather than a range of Gleason scores. An IHC-based analysis of radical prostatectomy specimens, rather than the diagnostic needle biopsies analyzed in our study, would provide a more complete depiction of the overall levels and distribution of hypoxia within the prostate tumours. Nevertheless, the agreement between GLUT1 and OPN staining supports further use of these markers in combination [Citation30] for detecting hypoxia in prostate cancer.
A likely explanation for the difficulty in using 18F-EF5 PET to quantify hypoxia in clinical prostate tumours is the diffuse nature of prostate cancer within the prostate gland. Rather than a single tumour mass as is typical of solid tumour types that exhibit high 18F-EF5 T/M ratios that indicate tumour hypoxia [Citation17–21], prostate tumours tend to be multi-focal, with cancerous cells interspersed throughout the prostate. Since hypoxic tumour cells make up only a fraction of tumour cells in a given lesion, quantifying 18F-EF5 uptake in a fraction of prostate tumour cells may be limited by the detection sensitivity of PET. Notably however, previous success with 18F-FMISO PET to detect hypoxia in prostate tumours [Citation13–15] suggests the imaging modality is not likely a significant limitation for using 18F-EF5 in prostate cancer.
Our 18F-EF5 data agree with a previous report testing 18F-FAZA to image hypoxia in prostate adenocarcinoma by PET, in which no significant radiotracer uptake or CAIX IHC staining was observed across 14 patients despite heterogeneous HIF1α staining [Citation16]. While CAIX, a transmembrane protein involved in pH regulation, has been used as an endogenous marker of hypoxia in a range of tumour types including breast cancer [Citation41], non-small cell lung cancer [Citation42], and bladder cancer [Citation43], the dependence of CAIX expression on hypoxia in prostate tumours is controversial. While Ambrosio et al. reported that CAIX significantly correlated with HIF1α staining and Gleason scores in 110 prostate cancer biopsies [Citation44], multiple studies of localized prostate adenocarcinoma report that CAIX is absent in tumours that are positive for HIF1α [Citation45] and in tumours positive for both HIF1α and GLUT1 [Citation37]. Our data agree with these latter studies in that we did not observe CAIX staining in most of our patient cohort, and the CAIX staining that was present did not co-localize with GLUT1 or OPN. It is possible that pH regulation in prostate cancer cells is dependent on alternative mechanisms that do not involve CAIX, or perhaps prostate tumours are less acidic and do not require CAIX-mediated pH regulation, although further studies are required to determine the precise role of pH and CAIX in prostate cancer.
The metabolic redox balance specific to malignant prostate cancer cells is a potential explanation for the low uptake of 18F-EF5 (and 18F-FAZA) [Citation16] in clinical prostate lesions, although pimonidazole has been shown to bind in hypoxic cells in several clinical prostate tumour studies. One study reports pimonidazole staining in 70% of the tumour-positive regions analyzed across 24 patients [Citation46], another reports positive pimonidazole staining in 34 out of 37 patients [Citation47], and a third study found pimonidazole staining to be associated with increased Gleason score and advanced tumour stage [Citation26]. The ability of pimonidazole to identify a high proportion of prostate adenocarcinomas as hypoxic argues that the limitations of 18F-FAZA and 18F-EF5 are unlikely to be explained by issues of prostate tumour cell biochemistry. It is worth noting that anoxic prostate tumour cells in vitro exhibit decreased Cu-ATSM labelling compared to mammary carcinoma cells [Citation48], and this decreased Cu-ATSM labelling was dependent on the relatively high expression of fatty acid synthase found in prostate tumour cells. The metabolic phenotype associated with high fatty acid synthase expression can hijack cellular reducing potential even in hypoxic conditions, resulting in a limited ability to reduce and therefore trap Cu-ATSM inside of the cell [Citation48,Citation49]. To our knowledge, no studies have specifically investigated the effect of fatty acid synthase expression on the binding efficiency for any of the major 2-nitroimidazole based hypoxia reporters (e.g., pimonidazole, EF5, FAZA, misonidazole), although the binding of these hypoxia markers also relies on intracellular reducing potential. Ultimately, with several published studies using pimonidazole to demarcate hypoxic cells in clinical prostate tumours [Citation26,Citation30,Citation46,Citation47], there is a need to evaluate immunohistochemical staining of non-radiolabeled EF5 to further determine whether EF5 is capable of detecting hypoxia in clinical prostate tumours.
Collectively, our data do not support the use of 18F-EF5-based PET to identify hypoxia in clinical prostate tumours. The use of other methods to quantify hypoxia, such as 18F-FMISO PET, pimonidazole, and IHC-based analyses of GLUT1 and OPN staining in diagnostic biopsies, is recommended to evaluate hypoxia in prostate cancer.
Supplemental Material
Download MS Word (11.8 KB)Supplemental Material
Download TIFF Image (32.8 MB)Supplemental Material
Download TIFF Image (21.2 MB)Disclosure statement
The authors report no potential conflict of interest.
Additional information
Funding
References
- Vordermark D, Horsman M. Hypoxia as a biomarker and for personalized radiation oncology. Recent Results Cancer Res. 2016;198:123–142.
- Cosse J-P, Michiels C. Tumour hypoxia affects the responsiveness of cancer cells to chemotherapy and promotes cancer progression. Anticancer Agents Med Chem. 2008;8(7):790–797.
- Saggar JK, Tannock IF. Chemotherapy rescues hypoxic tumor cells and induces their reoxygenation and Repopulation-An Effect That Is Inhibited by the Hypoxia-Activated Prodrug TH-302. Clin Cancer Res. 2015;21(9):2107–2114.
- Rankin EB, Giaccia AJ. Hypoxic control of metastasis. Science. 2016;352(6282):175–180.
- Movsas B, Chapman JD, Greenberg RE, et al. Increasing levels of hypoxia in prostate carcinoma correlate significantly with increasing clinical stage and patient age. Cancer. 2000;89(9):2018–2024.
- Höckel M, Schlenger K, Aral B, et al. Association between tumor hypoxia and malignant progression in advanced cancer of the uterine cervix. Cancer Research. 1996;56(19):4509–4515.
- Parker C, Milosevic M, Toi A, et al. Polarographic electrode study of tumor oxygenation in clinically localized prostate cancer. Int J Radiat Oncol Biol Phys. 2004;58(3):750–757.
- Turaka A, Buyyounouski MK, Hanlon AL, et al. Hypoxic prostate/muscle Po2 ratio predicts for outcome in patients with localized prostate cancer: long-term results. Int J Radiat Oncol Biol Phys. 2012;82(3):e433–e439.
- Horsman MR, Khalil AA, Nordsmark M, et al. Measurement of Po2 in a murine tumour and its correlation with hypoxic fraction. Adv Exp Med Biol. 1994;345:493–499.
- Lopci E, Grassi I, Chiti A, et al. PET radiopharmaceuticals for imaging of tumor hypoxia: a review of the evidence. Am J Nucl Med Mol Imaging. 2014;4(4):365–384.
- Hodolič M, Fettich J, Kairemo K. Hypoxia PET tracers in EBRT dose planning in head and neck cancer. Curr Radiopharm. 2015;8(1):32–37.
- Sorger D, Patt M, Kumar P, et al. [18F]fluoroazomycinarabinofuranoside (18FAZA) and [18F] fluoromisonidazole (18FMISO): a comparative study of their selective uptake in hypoxic cells and PET imaging in experimental rat tumors. Nucl Med Biol. 2003;30(3):317–326.
- Rasey JS, Koh WJ, Evans ML, et al. Quantifying regional hypoxia in human tumors with positron emission tomography of [18F]fluoromisonidazole: a pretherapy study of 37 patients. Int J Radiat Oncol Biol Phys. 1996;36(2):417–428.
- Mainta IC, Zilli T, Tille JC, et al. The effect of neoadjuvant androgen deprivation therapy on tumor hypoxia in High-Grade prostate cancer: an 18F-MISO PET-MRI study. Int J Rad Oncol Biol Phys. 2018;102(4):1210–1218.
- Supiot S, Rousseau C, Dore M, et al. Evaluation of tumor hypoxia prior to radiotherapy in intermediate-risk prostate cancer using 18F-fluoromisonidazole PET/CT: a pilot study. Oncotarget. 2018;9(11):10005–10015.
- Garcia-Parra R, Wood D, Shah RB, et al. Investigation on tumor hypoxia in resectable primary prostate cancer as demonstrated by 18F-FAZA PET/CT utilizing multimodality fusion techniques. Eur J Nucl Med Mol Imaging. 2011;38(10):1816–1823.
- Komar G, Lehtiö K, Seppänen M, et al. Prognostic value of tumour blood flow, [18F]EF5 and [18F]FDG PET/CT imaging in patients with head and neck cancer treated with radiochemotherapy. Eur J Nucl Med Mol Imaging. 2014;41(11):2042–2050.
- Qian Y, von Eyben R, Liu Y, et al. 18F-EF5 PET-based imageable hypoxia predicts local recurrence in tumors treated with highly conformal radiation therapy. Int J Radiat Oncol Biol Phys. 2018;102(4):1183–1192.
- Silvoniemi A, Suilamo S, Laitinen T, et al. Repeatability of tumour hypoxia imaging using [18F]EF5 PET/CT in head and neck cancer. Eur J Nucl Med Mol Imaging. 2018;45(2):161–169.
- Komar G, Seppänen M, Eskola O, et al. 18F-EF5: a new PET tracer for imaging hypoxia in head and neck cancer. J Nucl Med. 2008;49(12):1944–1951.
- Laasik M, Hynninen J, Forsback S, et al. The feasibility of [18F]EF5-PET/CT to image hypoxia in ovarian tumors: a clinical study. EJNMMI Res. 2020;10(1):103.
- Yapp DTT, Woo J, Kartono A, et al. Non-invasive evaluation of tumour hypoxia in the shionogi tumour model for prostate cancer with [18F]-EF5 and positron emission tomography. BJU Int. 2007;99(5):1154–1160.
- Skov K, Adomat H, Bowden M, et al. Hypoxia in the androgen-dependent Shionogi model for prostate cancer at three stages 1. Radiat Res. 2004;162(5):547–553.
- Dolbier WR, Li AR, Koch CJ, et al. [18F]-EF5, a marker for PET detection of hypoxia: synthesis of precursor and a new fluorination procedure. Appl Radiat Isot. 2001;54(1):73–80.
- Martin Bland J, Altman DG. Statistical methods for assessing agreement between two clinical measurments. The Lancet. 1986;327(8476):307–310.
- Hompland T, Hole KH, Kon Ragnum HB, et al. Combined MR imaging of oxygen consumption and supply reveals tumor hypoxia and aggressiveness in prostate cancer patients. Cancer Res. 2018;78(16):4774–4785.
- Zhu Y, Denhardt DT, Cao H, et al. Hypoxia upregulates osteopontin expression in NIH-3T3 cells via a ras-activated enhancer. Oncogene. 2005;24(43):6555–6563.
- Christian P, Harris AL. Hypoxia inducible carbonic anhydrase IX, marker of tumor hypoxia, survival pathway, and therapy target. Cell Cycle. 2004;3(2):164–167.
- Stewart GD, Gray K, Pennington CJ, et al. Analysis of hypoxia-associated gene expression in prostate cancer: lysyl oxidase and glucose transporter-1 expression correlate with gleason score. Oncology Reports. 2008;20(6):1561–1567.
- Rupp NJ, Schuffler PJ, Zhong Q, et al. Oxygen supply maps for hypoxic microenvironment visualization in prostate cancer. J Pathol Inform. 2016;7(1):3.
- Carvalho KC, Isabela Cunha IW, Rafael Rocha IM, et al. GLUT1 expression in malignant tumors and its use as an immunodiagnostic marker. Clinics. 2011;66(6):965–972.
- Chandler JD, Williams ED, Slavin JL, et al. Expression and localization of GLUT1 and GLUT12 in prostate carcinoma. Cancer. 2003;97(8):2035–2042.
- De Simone G, Supuran CT. Carbonic anhydrase IX: biochemical and crystallographic characterization of a novel antitumor target. Biochim Biophys Acta. 2010;1804(2):404–409.
- Jans J, van Dijk JH, van Schelven S, et al. Expression and localization of hypoxia proteins in prostate cancer: prognostic implications after radical prostatectomy. Urology. 2010;75(4):786–792.
- Vergis R, Corbishley CM, Norman AR, et al. Intrinsic markers of tumour hypoxia and angiogenesis in localized prostate cancer and outcome of radical treatment: a retrospective analysis of two randomised radiotherapy trials and one surgical cohort study. The Lancet Oncology. 2008;9(4):342–351.
- Lin LL, Silvoniemi A, James SB, et al. Radiation dosimetry and biodistribution of the hypoxia tracer (18)F-EF5 in oncologic patients. Cancer Biother Radiopharm. 2012;27(7):412–419.
- Chopra S, Foltz WD, Milosevic MF, et al. Comparing oxygen-sensitive MRI (BOLD R2*) with oxygen electrode measurements: a pilot study in men with prostate cancer. Int J Radiat Biol. 2009;85(9):805–813.
- Airley R, Evans A, Mobasheri A, et al. Glucose transporter glut-1 is detectable in peri-necrotic regions in many human tumor types but not normal tissues: study using tissue microarrays. Ann Anat. 2010;192(3):133–138..
- Reinicke K, Sotomayor P, Cisterna P, et al. Cellular distribution of glut-1 and glut-5 in benign and malignant human prostate tissue. J Cell Biochem. 2012;113(2):553–562..
- Tilli TM, Thuler LC, Matos AR, et al. Expression analysis of osteopontin mRNA splice variants in prostate cancer and benign prostatic hyperplasia. Exp Mol Pathol. 2012;92(1):13–19.
- Adams A, van Brussel ASA, Vermeulen JF, et al. The potential of hypoxia markers as target for breast molecular imaging - a systematic review and Meta-analysis of human marker expression. BMC Cancer. 2013;13(1):538.
- Ilie M, Mazure NM, Hofman V, et al. High levels of carbonic anhydrase IX in tumour tissue and plasma are biomarkers of poor prognostic in patients with non-small cell lung cancer. Br J Cancer. 2010;102(11):1627–1635.
- Said J. Biomarker discovery in urogenital cancer. Biomarkers. 2005;10(1):83–86.
- Ambrosio MR, Di Serio C, Danza G, et al. Carbonic anhydrase IX is a marker of hypoxia and correlates with higher gleason scores and ISUP grading in prostate cancer. Diagn Pathol. 2016;11(1):45.
- Smyth LG, O’Hurley G, O’Grady A, et al. Carbonic anhydrase IX expression in prostate cancer. Prostate Cancer Prostatic Dis. 2010;13(2):178–181.
- Hoskin PJ, Carnell DM, Taylor NJ, et al. Hypoxia in prostate cancer: correlation of BOLD-MRI with pimonidazole Immunohistochemistry-Initial observations. Int J Radiat Oncol Biol Phys. 2007;68(4):1065–1071.
- Carnell DM, Smith RE, Daley FM, et al. An immunohistochemical assessment of hypoxia in prostate carcinoma using pimonidazole: implications for radioresistance. Int J Radiat Oncol Biol Phys. 2006;65(1):91–99.
- Vāvere AL, Lewis JS. Examining the relationship between Cu-ATSM hypoxia selectivity and fatty acid synthase expression in human prostate cancer cell lines. Nucl Med Biol. 2008;35(3):273–279.
- Hochachka PW, Rupert JL, Goldenberg L, et al. Going malignant: the hypoxia-cancer connection in the prostate. Bioessays. 2002;24(8):749–757.