
 ?Mathematical formulae have been encoded as MathML and are displayed in this HTML version using MathJax in order to improve their display. Uncheck the box to turn MathJax off. This feature requires Javascript. Click on a formula to zoom.
Abstract
Background
Small megavoltage photon fields are increasingly used in modern radiotherapy techniques such as stereotactic radiotherapy. Therefore, it is important to study the reliability of dosimetry in the small-field conditions. The IBA Razor Nano Chamber (Nano chamber) ionization chamber is particularly intended for small-field measurements. In this work, properties of the Nano chamber were studied with both measurements and Monte Carlo (MC) simulations.
Material and methods
The measurements and MC simulations were performed with 6 MV, 6 MV FFF and 10 MV FFF photon beams from the Varian TrueBeam linear accelerator. The source-to-surface distance was fixed at 100 cm. The measurements and MC simulations included profiles, percentage depth doses (PDD), and output factors (OF) in square jaw-collimated fields. The MC simulations were performed with the EGSnrc software system in a large water phantom.
Results
The measured profiles and PDDs obtained with the Nano chamber were compared against IBA Razor Diode, PTW microDiamond and the PTW Semiflex ionization chamber. These results indicate that the Nano chamber is a high-resolution detector and thus suitable for small field profile measurements down to field sizes 2 × 2 cm2 and appropriate for the PDD measurements. The field output correction factors and field OFs
were determined according to TRS-483 protocol In the 6 MV FF and FFF beams, the determined correction factors
were within 1.2% for the field sizes of 1 × 1 cm2–3 × 3 cm2 and the experimental and MC defined field output factors
showed good agreement.
Conclusion
The Nano chamber with its small cavity volume is a potential detector for the small-field dosimetry. In this study, the properties of this detector were characterized with measurements and MC simulations. The determined correction factors are novel results for the NC in the TrueBeam fields.
Background
Modern radiation therapy (RT) techniques, such as stereotactic RT, are increasingly used treatment modalities. Common features of stereotactic RT are small target volumes and high doses delivered per fraction, which are often implemented with small and flattening filter free megavoltage beams [Citation1,Citation2]. A rapid dose fall-off outside the target volume is usually required in order to spare the normal tissues. Thus, precisely defined dose distributions are important for the successful treatment outcome. This sets high demands for the dosimetry accuracy, e.g., to correctly characterize the penumbra regions with high dose gradients in profile measurements and small field output factors implementation in treatment planning systems [Citation3,Citation4]. Therefore, it is extremely important to study the reliability of dosimetry in the non-reference small-field conditions.
Recently published Razor Nano Chamber (IBA Dosimetry GmbH, Schwarzenbruck, Germany) ionization chamber is particularly intended for small-field measurements. The Razor Nano Chamber (Nano chamber) is a small ionization chamber with an active volume of 0.003 cm3. The diameter of a spherical active volume is 2 mm and the central electrode is made of graphite.
In this work, properties of the Nano chamber were studied with both dose measurements and Monte Carlo (MC) simulations using 6 MV FF, 6 MV FFF and 10 MV FFF photon beams from TrueBeam (Varian Medical Systems Inc., Palo Alto, CA, USA) linear accelerator. The measurements included central axis profiles, central axis percentage depth doses (PDD) and field output factors (FOF) in square jaw-collimated fields. The measured profiles and PDDs were compared against MC simulations. To our knowledge, similar comparisons have not been reported elsewhere. Moreover, the field output correction factors and field FOFs
were determined according to TRS-483 protocol [Citation5]. The machine-specific reference field size of 10 × 10 cm2 and the clinical field sizes of 0.5 × 0.5, 1 × 1, 2 × 2 and 3 × 3 cm2 were simulated. The determined correction factors are novel results for the Nano chamber in the TrueBeam fields.
Material and methods
Measurements
In this work, properties of the Nano chamber ionization chamber were assessed in small RT fields. The Nano chamber was compared with two commercially available and small-field recommended detectors, namely the IBA Razor Diode semiconductor detector and the PTW microDiamond (PTW-Freiburg GmbH, Freiburg, Germany) synthetic diamond detector. Moreover, the traditional PTW Semiflex ionization chamber was used for comparison in larger fields. The IBA Stealth ionization chamber (attached to the linac using the interface mount) was used as a reference signal detector relative measurements in small fields of 10 × 10 cm2 and the IBA CC13 ionization chamber (positioned to be outside the radiation beam) in larger fields. The following bias voltages were used in the measurements: 300 V for the Nano chamber, 0 V for the Razor Diode, 0 V for the microDiamond, 400 V for the Semiflex, −420 V for the Steath and 300 V for the CC13. In this study, the measurement results were not corrected for the polarity effect.
Dose measurements were performed using 6 MV flattening filter (FF), 6 MV flattening filter free (FFF) and 10 MV FFF photon beams from TrueBeam linear accelerator with dose rates of 500, 1400, and 2000 monitor units (MU)/min. The source-to-surface distance (SSD) was set to 100 cm. The measurements included central axis profiles, central axis PDDs, and FOF in square jaw-collimated fields. Dose measurements were carried out with above-mentioned radiation detectors connected to PTW MP3 Water Phantom System. The detectors were positioned at the central beam axis in all measurements. This was verified with careful mechanical phantom adjustment and with water phantom’s integrated Check of beam Center module. A schematic presentation of the measurement geometry is presented in Supplementary Figure 1(a).
Central axis profiles and percentage depth doses
Central axis profiles were obtained in inline direction at a depth of 5 cm and central axis PDD curves from the water surface to the depth of 30 cm with three nominal beam energies. Field sizes of 1 × 1, 2 × 2, 3 × 3, 10 × 10 and 40 × 40 cm2 were measured with the Nano chamber oriented in a vertical position as recommended by the manufacturer. In addition, small fields of ≤3 × 3 cm2 in size were acquired with the Razor Diode and the microDiamond, both in a vertical position. Large fields of ≥3 × 3 cm2 in size were measured with the Semiflex oriented in a horizontal position.
Field output factors
FOFs were obtained with a dose of 200 MU at the depth of 5 cm with three nominal beam energies. The measurement was repeated three times and the FOF was calculated as an average. The reference field size of 10 × 10 cm2 was used and the field sizes of 0.5 × 0.5, 1 × 1, 2 × 2, 3 × 3 and 10 × 10 cm2 were measured with the Nano chamber. The detector was oriented similarly as in the profile and PDD measurements.
Monte Carlo simulations
The MC simulations were performed with the EGSnrc (Electron Gamma Shower, National Research Council, Ottawa, ON, Canada) software system version 2018 [Citation6]. Photon beams with nominal energies of 6 MV, 6 MV FFF and 10 MV FFF from the TrueBeam linear accelerator were modeled with BEAMnrc user code [Citation7] at the SSD of 100 cm with the phase-space files available from Varian Medical Systems. The Nano chamber was modeled according to the blueprints provided by the manufacturer with egs_chamber user code [Citation8], which includes a versatile C++ geometry library. The Nano chamber model was used in the profile and PDD, the field output correction factor and the FOF
simulations. All the simulations were carried out in a large cylindrical water phantom with a radius of 30 cm and a height of 40 cm. The ICRU report 90 [Citation9] recommended material files were used in the simulations. The simulation geometries are described in more detail in the Supplementary material.
Central axis profiles and percentage depth doses
Central axis profiles were simulated at the depth of 5 cm and central axis PDDs from the water surface to the depth of 30 cm with the field sizes of 1 × 1, 3 × 3 and 10 × 10 cm2. The Nano chamber was oriented in a vertical position. Simulated and measured profiles were compared through global difference (at high-dose and out-of-field regions) and distance-to-agreement (DTA) (at high-dose gradient region) criteria. The simulated and measured PDD curves were evaluated with global difference at depths larger than the depth of dose maximum (dmax) and with DTA at depths lower than dmax.
Field output correction factor, 
The International Atomic Energy Agency (IAEA) Technical Reports Series No. 483 (TRS-483) Code of Practice [Citation5] extends the dosimetry down to small static fields. It introduces the field output correction factor, which takes into account the differences in detector responses in clinical (
), and machine-specific reference (msr) fields (
). The field output correction factor can be determined as an MC-calculated value:
(1)
(1)
where
and
are the absorbed doses to water in clinical (
) and msr fields (
) with beam qualities of
and
respectively. Correspondingly,
and
are the absorbed doses in the sensitive volume of the modeled dosimeter. The absorbed dose to water was simulated in a small cylindrical water volume with a radius of 0.1 mm and a height of 1.0 mm, according to Czarnecki et al. [Citation10]. In this study, the msr field size of 10 × 10 cm2 and the clinical field sizes of 0.5 × 0.5, 1 × 1, 2 × 2 and 3 × 3 cm2 were simulated.
Field output factor,
The FOF is defined as a ratio of absorbed doses to water in the clinical field
and in the msr field
[Citation5]:
(2)
(2)
The FOFs can be derived also from a ratio of detector readings according to
(3)
(3)
where
and
are the dosimeter readings in the fields
and
with beam qualities of
and
respectively [Citation5].
The measured FOFs were determined with EquationEquation (3)(3)
(3) ; i.e., as a ratio of detector readings multiplied by the MC-calculated correction factor
For comparison, the MC alone simulated FOFs were calculated with EquationEquation (2)
(2)
(2) . The msr field size of 10 × 10 cm2 and the clinical field sizes of 0.5 × 0.5, 1 × 1, 2 × 2, 3 × 3 and 5 × 5 cm2 were simulated.
Parameters for the Monte Carlo simulations
The transport parameters used in the MC simulations are listed in Supplementary Table S1. An intermediate phase-space scoring (IPSS) was used to store the particles around all detector positions. To improve the calculation efficiency, the variance reduction techniques were used. The photon cross-section enhancement (XCSE) was turned on with an enhancement factor of 128 and the Russian Roulette with a rejection of 128.
Uncertainties
The statistical uncertainties (Type A) in the MC simulations were less than 1.0% in PDD simulations and less than 2.5% in profile simulations. The statistical uncertainties in the simulations of EquationEquations (1)(1)
(1) and Equation(2)
(2)
(2) were less than 0.5% for
and
and less than 0.3% for
and
The combined uncertainties were calculated as a root sum of the squared uncertainty components and were about 0.8% for
and about 0.7% for
The systematic uncertainties (Type B) due to cross-section and geometry or density variations were estimated to be about 0.4% and 0.5%, respectively, according to Wulff et al. [Citation11] and Francescon et al. [Citation12]. Type A combined uncertainties in the measurement of
were below 0.4%.
Results
Central axis profiles and PDDs obtained with the Nano chamber were compared against small-field recommended detectors i.e., IBA Razor Diode and PTW microDiamond detectors. Also, the traditional PTW Semiflex (0.125 cm3) detector was used with larger fields. shows the half inline profile and PDD measured with the Nano chamber, Razor Diode, microDiamond and Semiflex detectors for the field size of 3 × 3 cm2 with 6 MV beam. The measured profiles were normalized to 100% at the central axis and the PDDs to 60% at the depth of 10 cm. The full-width at half maximum (FWHM) and the penumbrae (distance between 80% and 20% doses) were determined with the Profeel dosimetry data analysis and visualization software [Citation13]. These beam parameters for 6 MV inline profiles at the central axis are presented in . Moreover, the tissue-phantom ratios (TPR20,10) were obtained from the PDDs according to the IAEA Technical Reports Series No. 398 (TRS-398) Code of Practice [Citation14] for the Nano chamber, the microDiamond and the Semiflex for the field size of 10 × 10 cm2. The TPR20,10 values obtained with the Nano chamber were 0.48%, 1.80%, and 0.87% smaller than with the microDiamond and 1.24%, 1.79%, and 1.17% smaller than with the Semiflex in beam energies 6 MV, 6 MV FFF, and 10 MV FFF, respectively. Thus, the maximum differences were observed with 6 MV FFF beam.
Figure 1. The 6 MV central axis inline profile at the depth of 5 cm (on left) and percentage depth dose (on right) for the field size of 3 × 3 cm2 measured with Nano chamber, Razor Diode, microDiamond and Semiflex. The dose differences between the Nano chamber and the other detectors are presented.
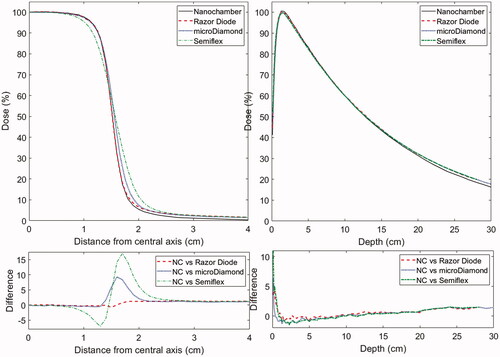
Table 1. Full-width at half maximum (FWHM) and penumbra (80–20%) values for measured inline profiles at the central axis for 6 MV FF beam at the depth of 5 cm.
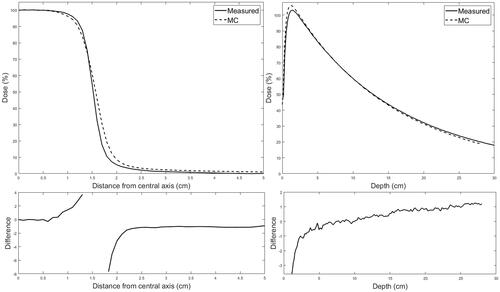
The profiles and PDDs measured with the Nano chamber were compared against MC simulations. The measured and simulated profiles were normalized to 100% at the central axis and the PDDs to 60% at the depth of 10 cm. The dose curves were not de-noised or otherwise filtered. These normalized curves were differentiated through dose difference and DTA analyzed with the Profeel software [Citation13]. The maximum difference between the simulated and measured profiles at high-dose region (dose from 100% to 90%) was 3.7% and out-of-field region (dose less than 10%) 7.7%. The DTA values at the penumbra region (dose from 90% to 10%) were less than 1.4 mm. In the case of PDDs, the maximum difference between the simulated and measured doses was 2.8% (at depths greater than dmax) and the maximum DTA was 5.5 mm (at depths lower than dmax). The profile (6 MV beam with field size of 3× 3 cm2) and PDD (6 MV beam with field size of 1 × 1 cm2) with largest differences are presented in .
Figure 2. The 6 MV central axis inline profile at the depth of 5 cm for the field size of 3 × 3 cm2 (on the left) and the 6 MV central axis percentage depth dose for the field size of 1 × 1 cm2 (on the right) with dose differences between measured and Monte Carlo (MC) simulated curves.
The field output correction factors were determined according to EquationEquation (1)
(1)
(1) . The machine-specific reference field size of 10 × 10 cm2 and the clinical field sizes of 0.5 × 0.5, 1 × 1, 2 × 2 and 3 × 3 cm2 were simulated. The results are presented in .
Table 2. Field output corrections factors determined with Monte Carlo (MC) simulations.
The FOFs determined with MC method were calculated according to EquationEquation (2)
(2)
(2) . Moreover, the FOFs
derived from a ratio of detector readings and field output correction factors
() were calculated according to EquationEquation (3)
(3)
(3) . The machine-specific reference field size of 10 × 10 cm2 and the clinical field sizes of 0.5 × 0.5, 1 × 1, 2 × 2, and 3 × 3 cm2 were simulated. The results are presented in .
Table 3. Field output factors (FOF) determined with Monte Carlo (MC) simulations and measurements.
Discussion
The Nano chamber shows the smallest FWHM and penumbra values for all except the field size of 1 × 1 cm2 (). For this field size, the Razor Diode presents 0.1 mm smaller FWHM and 0.5 mm smaller penumbra value. This agrees with the result presented by Reggiori et al. [Citation15], who demonstrated that penumbra values with the Nano chamber were on average 0.6 and 0.5 mm larger than those of the Razor Diode and the microDiamond, respectively. This is due to the ionization chamber’s larger volume effect than that of the solid-state detectors. However, the overestimation at the out-of-field region (i.e., doses below few percentages of the dose on the beam axis region) reported by Reggiori et al. [Citation15] was seen only with the smallest field sizes (1 × 1 cm2) in our study. In , it can be seen that the small active volume makes the Nano chamber a high-resolution detector and thus suitable for small field profile measurements down to field sizes 2 × 2 cm2.
In the PDD measurements, it was observed that the Nano chamber slightly underestimated the dose with increasing depths when compared to the Razor Diode, the microDiamond and the Semiflex. Similar results were shown by Gul et al. [Citation16]. On the contrary, Reggiori et al. [Citation15] found that the Nano chamber showed a slight overresponse with increasing depths. The underestimation increased with increasing field size. The underestimation might be related to the polarity effect, which was not evaluated in this study. The polarity effect on FOF results is discussed later in this chapter. Moreover, the beam energy 10 MV showed the best PDD agreement between all the detectors, which is in consensus with the observations by Reggiori et al. [Citation15] and Gul et al. [Citation16]. The TPR20,10 values were within 2% for the field size of 10 × 10 cm2 in all beam energies. This indicates that the Nano chamber is appropriate for the PDD measurements.
The verification of the Nano chamber’s MC model was performed with the profile and PDD simulations, where the dose was deposited in the active volume of the complete detector model. The simulation results were differentiated with measured curves through dose difference and DTA calculations. These comparisons show that the Nano chamber’s MC model is in a good agreement with the measurement results. The achievable low statistical uncertainty of MC simulations was restricted by the finite size of the TrueBeam phase-space files. This can be observed in the profile plot in where the dose difference at high dose region (80–100%) is wavy and was not due to the measurement. In the case of PDDs, the dose differences and DTA values are larger with smaller field sizes. Moreover, the dose difference increases slightly within depth, which can be seen in . This behavior may result from small deviation in detector positioning from the beam central axis in the measurements.
The correction factors were within 1.2% for the largest field sizes. Instead, for the smallest field size of 0.5 × 0.5 cm2, correction factors of up to 3.6% were observed. The correction factors close to unity indicate that the Nano chamber is a suitable detector for small FOF measurements. This was observed also by Zoros et al. [Citation17] who investigated correction factors in the Gamma Knife Perfexion photon fields.
The FOFs determined with MC simulation and experimentally are compared in . Large differences were found in small fields (0.5 × 0.5 cm2). This can be explained with high uncertainties in small FOF measurements, e.g., uncertainties in detector positioning and jaw adjustment. For these reasons, when performing small field measurements, several separate setups and measurements with phantom positioning and setting the jaws are recommended to decrease the measurement systematic uncertainties. In , the FOFs in the 6 MV FF and FFF beams determined with measurements are smaller than the MC defined FOFs in majority of the cases. On the contrary, the experimental FOFs in the 10 MV FFF beam are larger than the MC ones. One explanation for these differences is the polarity effect, which has been shown to be considerably large for the Nano chamber; Looe et al. [Citation18] have reported the polarity correction factor to be 1.009 for 6 MV FF beam and Gul et al. [Citation16] showed polarity correction factors up to 1.05 in 6 MV FF and 10 MV FF photon beams for the Nano chamber. The polarity correction factors would explain the smaller experimental FOFs in 6 MV beams. When applying 1.009 polarity correction for the experimental FOFs in 6 MV FF and FFF beam in , the experimental and MC defined FOFs are within 2%, which can be considered as reasonable deviation. The literature does not provide the polarity correction factors for 10 MV FFF beam, but if they were the same magnitude as the 10 MV FF beam factors presented by Gul et al. [Citation16], they would make the experimental FOFs even larger and thus, the deviation in contrast to the MC defined values would be even wider. These 10 MV FFF beam FOF results would need further investigations, including the detector and linac MC model validation, as well as polarity and volume averaging effect considerations, especially in the smallest field sizes (<1 × 1 cm2).
In summary, the IBA Nano chamber with its small cavity volume is a potential detector for the small-field dosimetry. In this study, the properties of this detector were characterized with measurements and MC simulations. The Nano chamber’s MC model was validated against profile, PDD and FOF measurements. In the 6 MV FF and FFF beams, the determined correction factors were within 1.2% for the field sizes of 1 × 1 cm2 – 3 × 3 cm2 and the experimental and MC defined FOFs
showed good agreement. The determined correction factors
are novel results for the Nano chamber in small RT fields of Varian TrueBeam accelerator.
Supplemental Material
Download MS Word (86.3 KB)Acknowledgments
The authors would like to thank IBA Dosimetry GmbH (Schwarzenbruck, Germany) for providing the IBA Razor Nano Chamber and its blueprints. The computational resources were provided by CSC IT Center for Science LTD (Finland). The authors would like to acknowledge M.Sc. Petri Sipilä from the Radiation and Nuclear Safety Authority (STUK, Helsinki, Finland) for useful discussions and a guidance with the MC model and M.Sc. Tomppa Pakarinen from Tampere University Hospital for help with the Matlab analysis script.
Disclosure statement
No potential conflict of interest was reported by the author(s).
Additional information
Funding
References
- Taylor ML, Kron T, Franich RD. A contemporary review of stereotactic radiotherapy: inherent dosimetric complexities and the potential for detriment. Acta Oncol. 2011;50(4):483–508.
- Hansen CR, Bertelsen A, Riis HL, et al. Plan quality and delivery accuracy of flattening filter free beam for SBRT lung treatments. Acta Oncol. 2015;54(3):422–427.
- Hansen AT, Poulsen PR, Høyer M, et al. Isotoxic dose prescription level strategies for stereotactic liver radiotherapy: the price of dose uniformity. Acta Oncol. 2020;59(5):558–564.
- Lechner W, Primeßnig A, Nenoff L, et al. The influence of errors in small field dosimetry on the dosimetric accuracy of treatment plans. Acta Oncol. 2020;59(5):511–517.
- International Atomic Energy Agency. Dosimetry of small static fields used in external beam radiotherapy. An international code of practice for reference and relative dose determination. Technical reports series no. 483. Vienna: IAEA; 2017.
- Kawrakow I, Rogers DWO, Mainegra-Hing E, et al. EGSnrc toolkit for Monte Carlo simulation of ionizing radiation transport. 2000. DOI:https://doi.org/10.4224/40001303
- Rogers DWO, Faddegon BA, Ding GX, et al. BEAM: a Monte Carlo code to simulate radiotherapy treatment units. Med Phys. 1995;22(5):503–524.
- Wulff J, Zink K, Kawrakow I. Efficiency improvements for ion chamber calculations in high energy photon beams. Med Phys. 2008;35(4):1328–1336.
- Seltzer SM, Fernández-Varea JM, Andreo P, et al. Key data for ionizing-radiation dosimetry: measurement standards and applications. ICRU Report 90. Oxford: ICRU; 2016.
- Czarnecki D, Zink K. Monte Carlo calculated correction factors for diodes and ion chambers in small photon fields. Phys Med Biol. 2013;58(8):2431–2444.
- Wulff J, Heverhagen JT, Zink K, et al. Investigation of systematic uncertainties in Monte Carlo-calculated beam quality correction factors. Phys Med Biol. 2010;55(16):4481–4493.
- Francescon P, Cora S, Satariano N. Calculation of for several small detectors and for two linear accelerators using Monte Carlo simulations. Med Phys. 2011;38(12):6513–6527.
- Pakarinen T, Ojala J. Profeel: Open source dosimetry data visualization and analytics software, v. 1.15. GitHub repository. 2021. [cited 2021 May 14]. Available from https://github.com/TPakar/Profeel.
- International Atomic Energy Agency. Absorbed dose determination in external beam radiotherapy. An international code of practice for dosimetry based on standards of absorbed dose to water. Technical Report Series No. 398. Vienna: IAEA; 2000.
- Reggiori G, Stravato A, Mancosu P, et al. Small field characterization of a nanochamber prototype under flattening filter free photon beams. Phys Med. 2018;49:139–146.
- Gul A, Fukuda S, Mizuno H, et al. Feasibility study of using stereotactic field diode for field output factors measurement and evaluating three new detectors for small field relative dosimetry of 6 and 10 MV photon beams. J Appl Clin Med Phys. 2020;21(11):23–36.
- Zoros E, Moutsatsos A, Pappas EP, et al. Monte Carlo and experimental determination of correction factors for gamma knife perfexion small field dosimetry measurements. Phys Med Biol. 2017;62(18):7532–7555.
- Looe HK, Büsing I, Tekin T, et al. The polarity effect of compact ionization chambers used for small field dosimetry. Med Phys. 2018;45(12):5608–5621.