
Abstract
Introduction
Radiotherapy (RT) for head and neck cancer is now guided by cone-beam computed tomography (CBCT). We aim to identify a CBCT radiomic signature predictive of progression to RT.
Material and methods
A cohort of 93 patients was split into training (n = 60) and testing (n = 33) sets. A total of 88 features were extracted from the gross tumor volume (GTV) on each CBCT. Receiver operating characteristic (ROC) curves were used to determine the power of each feature at each week of treatment to predict progression to radio(chemo)therapy. Only features with AUC > 0.65 at each week were pre-selected. Absolute differences were calculated between features from each weekly CBCT and baseline CBCT1 images. The smallest detectable change (C = 1.96 × SD, SD being the standard deviation of differences between feature values calculated on CBCT1 and CBCTn) with its confidence interval (95% confidence interval [CI]) was determined for each feature. The features for which the change was larger than C for at least 5% of patients were then selected. A radiomics-based model was built at the time-point that showed the highest AUC and compared with models relying on clinical variables.
Results
Seven features had an AUC > 0.65 at each week, and six exhibited a change larger than the predefined CI 95%. After exclusion of inter-correlated features, only one parameter remains, Coarseness. Among clinical variable, only hemoglobin value was significant. AUC for predicting the treatment response were 0.78 (p = .006), 0.85 (p < .001), and 0.99 (p < .001) for clinical, CBCT4-radiomics (Coarseness) and clinical + radiomics based models respectively. The mean AUC of this last model on a 5-fold cross-validation was 0.80 (±0.09). On the testing cohort, the best prediction was given by the combined model (balanced accuracy [BAcc] 0.67 , p < .001).
Conclusions
We described a feature selection methodology for delta-radiomics that is able to select reproducible features which are informative due to their change during treatment. A selected delta radiomics feature may improve clinical-based prediction models.
Introduction
Two-third of patients with head and neck squamous cell carcinoma (HNSCC) are diagnosed at a locally advanced stage (III and IV) and the associated 5-year overall survival usually does not exceed 50% despite multimodal management [Citation1]. Radiomics, which corresponds to the high throughput extraction of quantitative imaging features from medical images, could provide useful quantitative information to develop models for cancer diagnosis and prognosis, to guide clinical decisions in HNSCC [Citation2,Citation3]. Radiomics based modeling represents the combined advantages of being highly patient-specific and noninvasive, while allowing for an assessment of the image heterogeneity over the entire tumor. Features extracted from computed tomography (CT) images have been shown to be correlated with pathologic information, overall survival, gene expression, and cancer staging in numerous cancer sites, including HNSCC [Citation4–8].
In HNSCC patients, cone-beam CT (CBCT) images are acquired weekly during radiotherapy (RT) for treatment positioning verification. As such, CBCT images could be used for longitudinal treatment response assessment using radiomics. Whereas the prognostic value of radiomics extracted from diagnostic and planning CT (pCT) images has been investigated already in several studies [Citation9,Citation10], the predictive value of radiomics extracted from CBCT images could be more challenging because of their lower signal-to-noise ratio. The possibility of using CBCT based radiomics has already been explored in lung cancer [Citation11–13] and a recent study has shown the potential added prognostic value of delta-radiomic features extracted from CT images [Citation14], indicating that monitoring the course of treatment in a longitudinal radiomics approach could potentially be useful for treatment adaptation. Methodology for reproducible delta radiomic features selection has been recently described [Citation15].
To date, however, no study has investigated the possibility of using delta-radiomics features calculated from CBCT images to determine prognosis and treatment response in HNSCC.
In this study, we investigated a methodology for feature selection that takes into account not only single time-point robustness, but also potential longitudinal information of radiomic features derived from CBCT imaging. A secondary objective was to determine whether therapy-induced changes in radiomics features, called delta-radiomics features, can predict progression after RT and improve models when used in conjunction with clinical factors.
Material and methods
Patients
Patients with stage III–IV HNSCC following the 8th TNM classification treated with curative intent with definitive RT guided by weekly CBCTs, with or without chemotherapy (depending on age, performance status as well as comorbidities) between January 2014 and May 2017 were considered in this retrospective study. Among them, those with at least four CBCTs during treatment, including CBCT at week 1 were included. Patients who benefited from surgery of the primary tumor or those treated with palliative intent were excluded, as were patients with nasopharyngeal carcinoma, thyroid and salivary glands tumors or a different histology (melanoma and lymphoma). Patients with a cancer of unknown primary origin were also excluded. Patients who benefited from a neck dissection without surgical treatment on their primary tumor were considered.
All patients underwent a clinical assessment with nasofibroscopy and a PET-CT 3 months (±10 d) after RT completion. For the purpose of this study, treatment response was reported according to the PERCIST criteria [Citation16].
A total of 93 patients were recruited and split using the stratified sampling approach in MS Excel into training (n = 60, 64.5%) and testing (n = 33, 35.5%) sets, ensuring similar clinical, treatment and histopathological characteristics in both sets (). Clinical, treatment, and histopathological characteristics are presented in .
Table 1. Patients and treatments characteristics.
Treatment characteristics
All patients were treated in a standard 5-point immobilization thermoplastic shell. The standard dose prescribed to the primary tumor and involved nodes were 70 Gy. Prophylactic dose to uninvolved nodes was 56 Gy in 28 fractions. Volumetric modulated arc therapy (VMAT) was standard and patients were all treated on a TrueBeam STx® Radiotherapy System (Varian Medical Systems, Palo Alto, CA, USA).
Concomitant chemotherapy consisted of cisplatin delivered every three weeks (100 mg/m2). In patients older than 70 years, or in case of contra-indications to cisplatin, carboplatin (AUC 5) or cetuximab at a loading dose of 400 mg/m2 one week prior to starting RT, then weekly at a dose of 250 mg/m2, were substituted.
Outcome
In the training set, at the first therapeutic evaluation 3 months after RT completion, 60, 20, and 8% of patients presented with a complete response, partial response, and stable disease on the primary tumor. Twelve percent showed progressive disease. In the testing set, complete and partial responses were observed in 72.7 and 18.2% of patients whereas 9.1% had progression.
Planning CT and CBCT image acquisition and image analysis
pCTs were acquired in supine position with aquaplast mask for immobilization on a Siemens Sensation Open scanner using a peak-voltage of 120 kVp, a 512 × 512 matrix, a slice thickness of 1.5 mm resulting in a voxel dimension of 0.7 × 0.7 × 1.5 mm3. Two sequences of images were acquired, with and without iodinated contrast agents.
All CBCT images were acquired on a TrueBeam Novalis STx® Radiotherapy System (Varian Medical Systems, Palo Alto, CA, USA) with a tube voltage of 100 kV, and the exposure kept at values of 150 mAs per frame. Images were reconstructed using filtered back projection with an in-plane size of 0.51 × 0.51 mm2 and a slice thickness of 2 mm. Each CBCT consisted of 93 slices.
Tumor delineation
The gross tumor volume of the primary tumor (GTVT) was manually delineated on the pCT scan by a single experienced radiation oncologist (U.S.) using the Pinnacle® version 9.10 software (Philips Medical Systems, Amsterdam, Netherlands) and used for treatment planning. For each patient, GTVs from the pCT were registered to the CBCT image using deformable registration with the Dynamic Planning Module of Pinnacle version 9.10. The Pinnacle system used an implementation of the demons algorithm for deformable registration. All resulting contours were visually checked and manually adjusted when the algorithm failed to perform an acceptable registration (Figure S1).
Features extraction
All the seven CBCT corresponding to each week of treatment were available for 57 patients, whereas only six were available for 16 patients, 5 for 12, 4 for 2, and 3 for the last six patients, making a total of 581 CBCT images ().
All features were implemented according to the current version of image biomarkers standardization initiative (IBSI) guidelines [Citation17]. Details on features extraction are provided in Supplemental Material.
Statistical analysis and modeling
The following analysis was carried out in the training set only
Single time point feature selection
In order to evaluate the power of each feature to predict therapeutic response, receiver operating characteristic (ROC) curves were used. To prevent overfitting, a preselection step based on the AUC was added. Thus, only significant features (p < .05) with an AUC above 0.65 at every week in the training set were selected, this reflecting both single-time point robustness and stability. To avoid redundancy between the selected radiomic features, inter-correlation was assessed through the Spearman rank correlation coefficient (ρ). Among redundant features (ρ > 0.7), only the highest predictive feature was kept based on the AUC value.
Longitudinal features selection
This step consisted in selecting amongst the radiomic features with sufficient robustness (AUC > 0.65) at every week, those providing relevant longitudinal information in the training set. We determined the 95% confidence interval (95% CI) of the smallest detectable change (C) defined as C = 1.96 × SD, where SD is the standard deviation of differences between features values calculated on CBCT1 (before the first fraction) and CBCT2 (at week 2) [Citation15]. Features were considered as relevant when they had a detectable change (out of boundaries values) during treatment for at least 5% of patients. This percentage was arbitrarily chosen as conservative in order to avoid eliminating too many features at this step.
For each feature and for each patient, absolute differences compared to baseline were calculated: CBCTn-CBCT1, n being the number of the week (n = 1–7). This resulted in a total of 88 delta radiomic features for each week (relative differences were also analyzed, however, findings were the same and hence data is not shown).
Finally, only radiomic features which showed an AUC > 0.65 both at single time points and longitudinally (at least for 1 week) were further considered in the model building step.
Models building and evaluation
A model combining the best radiomic features was built in the training cohort. The ROC curve was used to determine cutoff values of significant parameters according to the Youden index (YI). The parameters were ranked according to their discrimination capacity based on the YI, the AUC and the associated p value. Once the cutoff applied, the balanced accuracy (BAcc) and corresponding sensitivity (Se) and specificity (Sp) were also evaluated. Models were then considered by simply classifying patients with response (complete or partial response or stability) in one group, versus the patients with progressive disease in the other group. Combination of several parameters was carried out through logistical regression.
We finally compared the prognostic value of each model: clinical-based model (using clinical variables only), radiomics model, and model combining both, using ROC curves and statistical significance with a p value < .05. The following clinical variables were included: age, gender, performance status, smoking status, stage, anatomic site, body mass index (BMI), hemoglobin value, concomitant chemotherapy, RT dose, and interruption. As humanopapilloma virus-mediated HNSCC are already identified in the 8th TNM classification, p16 positivity was not entered in the multivariable analysis.
An internal five-fold cross-validation procedure was also performed to evaluate the predictive efficiency of the best model.
The three best models (clinical-based model, radiomics model, and model combining both) were then applied to the testing set for evaluating their predictive power, reporting BAcc, Se, and Sp.
To better apprehend the added value of a longitudinal feature selection on the CBCTs, a single point model based on the pCT was built. For this model, only the first step of the aforementioned methodology was performed (single time point feature selection).
All statistical analyses were performed using MedCalc Statistical Software version 18.5 (MedCalc Software, Ostend, Belgium; https://www.medcalc.org; 2018).
Radiomics quality score
We auto-evaluated the quality of our study using the Radiomics Quality score.
Results
Single time point feature selection
Regarding the GTVT, among the 88 radiomics features extracted, seven had a significant AUC > 0.65 at every week and were therefore considered for further analysis: Least axis length, Major axis length, BusynessNGTDM (neighborhood gray tone difference atrix), CoarsenessNGTDM, volume, Maximum 3 D diameter, and Gray-level non-uniformity (GLNU). The significant values of AUC at each week are shown in .
Table 2. The seven significant features radiomics extracted from the primary gross tumor volume (GTV T) for the training cohort, with their respective area under curves at each week.
Longitudinal features selection
Among these seven remaining radiomic features extracted from the GTVT, all but one (Busyness) exhibited a change larger than the predefined CI 95% at least for one week and in at least 5% of patients and were therefore further considered in the model building step. Modifying the threshold (e.g., 20%) led to eliminate all features, which would prevent further radiomic modeling.
Model building
After multivariate analysis and exclusion of the parameters correlated with each other, only one feature remained: CoarsenessNGTDM, which reached the highest AUC (0.77, p = .006) at the fourth week (). The changes of the Coarseness parameter over time are illustrated in and .
Figure 1. Mean relative variation of the ‘Coarseness’ parameter at each week compared to the baseline value. X-axis: CBCTx: relative difference between week × and baseline; Y-axis: relative variation of the ‘Coarseness’ parameter (%).
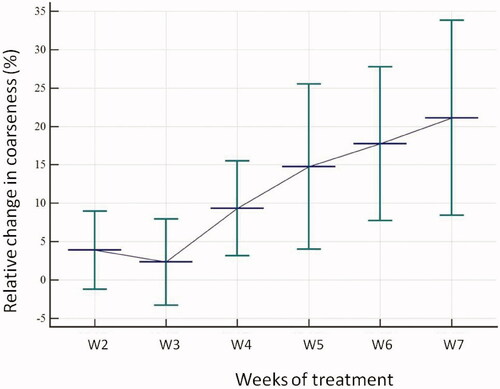
Figure 2. Absolute relative change for the coarseness parameter at each week compared to baseline depending on response to treatment.
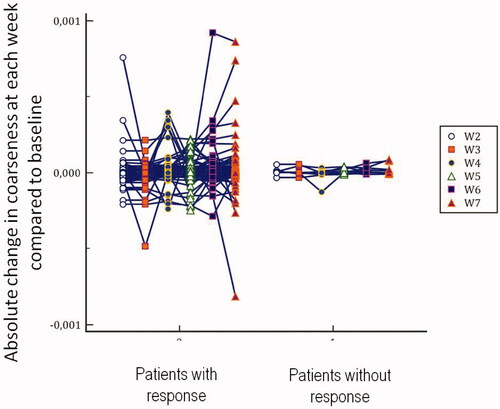
This timepoint was therefore selected and the CBCT4 was used to build the radiomics model. illustrates the changes over time of Coarseness vdiff extracted from the GTVT. From a clinical point of view, choosing the fourth week would still allow a therapeutic adjustment after 3 weeks of radiation. Regarding clinical variables, only hemoglobin value predicted non response with an AUC of 0.78 (p = .006) and a BAcc of 0.79 (Se 71.4% and Sp 86.8%). When these two variables were logistically combined in the model, called the ‘radiomics and clinical model’, an AUC of 0.99 (p < .001, CI 95% 0.97−1.00) was obtained, thus showing a better predictive power than each parameter separately (BAcc 0.82, Se 100, Sp 63.8).
The mean AUC of this model on the 5-fold cross-validation was 0.80 (±0.09).
Evaluation of trained models
In the testing set, the radiomics model based on the sole coarseness feature reached a higher BAcc than the clinical model based on hemoglobin value (BAcc 0.62, p = .003 vs. 0.58, p = .016). The combined model allowed to further slightly improve the accuracy in identifying poor responders (BAcc 0.67, p = .0001). The mean predicted probability was 6.2% (IC 95% 4.0−8.3) for the non responders and 32.1% (IC 95% 10.9−53.2) for the responders. Se and Sp values of each model, in the training and testing cohorts, are provided in .
Table 3. . Summary of the models’ performance in the training and testing cohorts.
Model based on the planning CT
In the training set and when focusing on the features extracted from the pCT, 14 radiomic features were significantly correlated with the local control (AUC > 0.65). After elimination based on the Spearman’s inter-correlation (i.e., with ρ > 0.7), only two features remained: the mean histogram and the zone size non uniformity (ZSNU). When logistically combined in the training set, the model resulted in an AUC of 0.78 (p = .0002), with a BAcc of 0.71 (Se = 50% and Sp = 91.2%). When applied to the testing set, this model resulted in a BAcc of 0.60 (Se = 20% and Sp = 100%). The ZSNU feature was significantly correlated with the Coarseness feature (ρ = 0.84, p < .0001) whereas the Mean Histogram was not (ρ = 0.15, p = .08). Despite this correlation, the radiomic and especially combined models achieved a higher BAcc than this pCT based model.
Radiomics quality score
Our study scored 14 points out of 36 (Supplementary Table S1).
Discussion
To the best of our knowledge, this is the first study investigating the power of the so-called ‘delta radiomics’ using CBCT image for response to RT in patients with head and neck cancer specifically. We proposed a workflow to select delta radiomic features, following suggestions by Timmeren et al. [Citation15]. At week 4 of treatment, several features showed a change for at least 5% of patients, indicating that useful radiomics information is available early during treatment. Note that this threshold of 5% was arbitrarily chosen for the purpose of this study. We tested modifying this (e.g., to 10%), however, this resulted in eliminating all features, which prevented further modeling. Alternative thresholds will be tested in future validation studies.
Coarseness is a measure of the average difference between the center voxel and its neighborhood and is an indication of the spatial rate of change. A higher value indicates a lower spatial change rate and a locally more uniform texture. On the opposite, a lower value reflects a more heterogeneous tumor. In this study, patients with a high value of Coarseness at week 4 were the best responders. These changes may be attributable to the concomitant systemic treatment. Indeed, the second cycle of chemotherapy is administered on the first day of the fourth week. The changes in homogeneity may thus reflect intratumoral modifications due to the action of systemic treatment, especially reoxygenation.
Some authors already used delta-radiomics for treatment response assessment, showing that the relative differences in texture parameters extracted from CT scans performed after treatment may be better predictors of response to chemotherapy than decrease in tumor size [Citation18,Citation19]. However, only a few studies have assessed the prognostic value of radiomics specifically during the course of treatment. Fave et al. extracted features from pretreatment and weekly per-treatment CT images in 107 patients with stage III NSCLC and showed that radiomic features derived from CT varied significantly during RT, but provided only limited prognostic value [Citation14]. This longitudinal use of radiomics was also recently studied by Leger et al. [Citation20] in a cohort of 78 HNSCC patients treated with primary chemoradiotherapy. Features were extracted from pCT and from CT performed at the second week. Loco-regional risk recurrence stratification was improved with the use of the second week CT (p = .002) compared to pCT only (p = .063) suggesting that incorporation of imaging during treatment may be a promising way to improve radiomics models.
Recent data showed that a subset of radiomics features and the prognostic value of the radiomic signature are interchangeable between pCT and CBCT, highlighting the possibility of using radiomics on CBCT imaging [Citation11], but the possible correlation of metrics extracted from CBCT images specifically with outcome has not been extensively investigated. One study analyzed the tumor regression on CBCT images in regards to locoregional control and overall survival in lung cancer, and showed that CBCT imaging was able to detect early changes, correlated with prognosis and toxicity [Citation21–23]. Only Van Timmeren et al. recently investigated the use of longitudinal CBCT-extracted radiomic features to improve prognostic information in a cohort of 141 patients with stage I–IV NSCLC using the same methodology as the one we relied on in this study. No model for locoregional recurrence could be developed. However, performance of the baseline radiomics-based and clinical model was poor, probably affected by a large heterogeneity of the population [Citation24]. These studies show that CBCT is a feasible image modality to detect early changes during treatment.
Furthermore, our model built with the CBCT-based radiomic features achieved a higher BAcc than the model using only the baseline radiomic features (BAcc of 0.67 vs. 0.60, respectively).
There are several challenges in using CBCT imaging for radiomic analysis. Most radiomic features are sensitive to acquisition settings and reconstruction parameters [Citation25] and the influence of slice thickness especially on the textural parameters values deserves further investigation [Citation26]. Moreover, stability/repeatability results of features in low dose CT images may not entirely be directly transferable to the specific context of CBCT images, although features identified as unreliable in test–retest low dose CT are unlikely to be reliable in a similar CBCT context. Two studies investigated specifically the reproducibility of radiomic features in CTBC and identified the features we retained in our work as reproducible [Citation12,Citation13].
Moreover, increased noise and Se to artifacts compared to conventional CT images because of a lower dose and less performant reconstruction algorithm may negatively affect the accuracy of CBCT-derived radiomic models [Citation11]. Indeed, artifacts, such as increased radiation scatter in the patient and wide-area detector leading to greater noise and poorer contrast is common in CBCT images, even if various methods have been proposed to correct them. These artifacts might indeed be an issue for tumor outlining, especially in patients with dental metal prosthesis or implants. At our institution, all patients are asked to remove their dental prosthesis before pCT and before each RT session. No patient has to be excluded because of extreme artifacts in our study. However, we acknowledge that tumor outlining in some patients may have been challenging due to dental implants.
This study has several limitations, and should be considered as a preliminary study only. First, it is retrospective with a relatively small cohort. The seven CBCT corresponding to each week of treatment were available in 64 patients only. Second, our cohort was heterogeneous and this may have contributed to the significant role of the clinical variable in our combined model. In this way, the performance of the radiomic model may have been underestimated.
Additionally, the manual delineation could be seen as a limit, subjected to interobserver variability. Of note, Van Timmeren et al. reported that both the manual and automatic segmentation methods led to a correlation between tumor regression on CBCT during radiation treatment and worse outcome [Citation10]. The heterogeneity in pixel sizes and slice thickness could also be seen as another small potential limitation of our work.
We plan to externally validate our findings in future studies, which will rely on multicenter collaboration. It will also likely require harmonization of features, which will benefit from our recent developments in that regard [Citation27].
Conclusion
This is the first study describing a feature selection methodology for longitudinal CBCT radiomics for HNSCC patients to select reproducible delta radiomics features that are informative due to their change during treatment. The CBCT-based radiomic signature identified at the fourth week of treatment showed that prognostic information on treatment response can be derived from CBCT images. These first results may support the development of treatment adaptation strategies in the future. Further prospective studies on larger and more homogenous cohorts are needed to confirm these results.
Supplemental Material
Download MS Word (247.4 KB)Disclosure statement
No potential conflicts of interest were disclosed.
References
- Lacas B, Bourhis J, Overgaard J, et al. Role of radiotherapy fractionation in head and neck cancers (MARCH): an updated meta-analysis. Lancet Oncol. 2017;18(9):1221–1237.
- Lambin P, Rios-Velazquez E, Leijenaar R, et al. Radiomics: extracting more information from medical images using advanced feature analysis. Eur J Cancer. 2012;48(4):441–446.
- Kumar V, Gu Y, Basu S, et al. Radiomics: the process and the challenges. Magn Reson Imaging. 2012;30(9):1234–1248.
- Aerts HJ, Velazquez ER, Leijenaar RT, et al. Decoding tumour phenotype by noninvasive imaging using a quantitative radiomics approach. Nat Commun. 2014;5:4006.
- Leijenaar RT, Carvalho S, Hoebers FJ, et al. External validation of a prognostic CT-based radiomic signature in oropharyngeal squamous cell carcinoma. Acta Oncol. 2015;54(9):1423–1429.
- Parmar C, Leijenaar RT, Grossmann P, et al. Radiomic feature clusters and prognostic signatures specific for lung and head & neck cancer. Sci Rep. 2015;5(1):11044.
- Zhang H, Graham CM, Elci O, et al. Locally advanced squamous cell carcinoma of the head and neck: CT texture and histogram analysis allow independent prediction of overall survival in patients treated with induction chemotherapy. Radiology. 2013;269(3):801–809.
- Head M. Neck quantitative imaging working G. Investigation of radiomic signatures for local recurrence using primary tumor texture analysis in oropharyngeal head and neck cancer patients. Sci Rep. 2018;8:1524.
- Kuno H, Qureshi MM, Chapman MN, et al. CT texture analysis potentially predicts local failure in head and neck squamous cell carcinoma treated with chemoradiotherapy. AJNR Am J Neuroradiol. 2017;38(12):2334–2340.
- van Timmeren JE, van Elmpt W, de Ruysscher D, et al. Tumor regression during radiotherapy for non-small cell lung cancer patients using cone-beam computed tomography images. Strahlenther Onkol. 2020;196(2):159–171.
- van Timmeren JE, Leijenaar RTH, van Elmpt W, et al. Survival prediction of non-small cell lung cancer patients using radiomics analyses of cone-beam CT images. Radiother Oncol. 2017;123(3):363–369.
- Fave X, Mackin D, Yang J, et al. Can radiomics features be reproducibly measured from CBCT images for patients with non-small cell lung cancer? Med Phys. 2015;42(12):6784–6797.
- Shi L, Rong Y, Daly M, et al. Cone-beam computed tomography-based Delta-radiomics for early response assessment in radiotherapy for locally advanced lung cancer. Phys Med Biol. 2020;65(1):015009.
- Fave X, Zhang L, Yang J, et al. Delta-radiomics features for the prediction of patient outcomes in non-small cell lung cancer. Sci Rep. 2017;7(1):588.
- van Timmeren JE, Leijenaar RTH, van Elmpt W, et al. Feature selection methodology for longitudinal cone-beam CT radiomics. Acta Oncol. 2017;56(11):1537–1543.
- Wahl RL, Jacene H, Kasamon Y, et al. From RECIST to PERCIST: evolving considerations for PET response criteria in solid tumors. J Nucl Med. 2009;50(1):122S–150S.
- Zwanenburg A, Vallières M, Abdalah MA, et al. The image biomarker standardization initiative: standardized quantitative radiomics for high-throughput image-based phenotyping. Radiology. 2020;295(2):328–338.
- Rao SX, Lambregts DM, Schnerr RS, et al. CT texture analysis in colorectal liver metastases: a better way than size and volume measurements to assess response to chemotherapy? United European Gastroenterol J. 2016;4(2):257–263.
- Goh V, Ganeshan B, Nathan P, et al. Assessment of response to tyrosine kinase inhibitors in metastatic renal cell cancer: CT texture as a predictive biomarker. Radiology. 2011;261(1):165–171.
- Leger S, Zwanenburg A, Pilz K, et al. CT imaging during treatment improves radiomic models for patients with locally advanced head and neck cancer. Radiother Oncol. 2019;130:10–17.
- Brink C, Bernchou U, Bertelsen A, et al. Locoregional control of non-small cell lung cancer in relation to automated early assessment of tumor regression on cone beam computed tomography. Int J Radiat Oncol Biol Phys. 2014;89(4):916–923.
- Bertelsen A, Schytte T, Bentzen SM, et al. Radiation dose response of normal lung assessed by cone beam CT - a potential tool for biologically adaptive radiation therapy. Radiother Oncol. 2011;100(3):351–355.
- Bernchou U, Hansen O, Schytte T, et al. Prediction of lung density changes after radiotherapy by cone beam computed tomography response markers and pre-treatment factors for non-small cell lung cancer patients. Radiother Oncol. 2015;117(1):17–22.
- van Timmeren JE, van Elmpt W, Leijenaar RTH, et al. Longitudinal radiomics of cone-beam CT images from non-small cell lung cancer patients: evaluation of the added prognostic value for overall survival and locoregional recurrence. Radiother Oncol. 2019;136:78–85.
- Balagurunathan Y, Gu Y, Wang H, et al. Reproducibility and prognosis of quantitative features extracted from CT images. Transl Oncol. 2014;7(1):72–87.
- Zhao B, Tan Y, Tsai WY, et al. Reproducibility of radiomics for deciphering tumor phenotype with imaging. Sci Rep. 2016;6:23428.
- Da-Ano R, Masson I, Lucia F, et al. Performance comparison of modified ComBat for harmonization of radiomic features for multicenter studies. Sci Rep. 2020;10(1):10248.