
 ?Mathematical formulae have been encoded as MathML and are displayed in this HTML version using MathJax in order to improve their display. Uncheck the box to turn MathJax off. This feature requires Javascript. Click on a formula to zoom.
Abstract
Background
Clinical data suggest that the relative biological effectiveness (RBE) in proton therapy (PT) varies with linear energy transfer (LET). However, LET calculations are neither standardized nor available in clinical routine. Here, the status of LET calculations among European PT institutions and their comparability are assessed.
Materials and methods
Eight European PT institutions used suitable treatment planning systems with their center-specific beam model to create treatment plans in a water phantom covering different field arrangements and fulfilling commonly agreed dose objectives. They employed their locally established LET simulation environments and procedures to determine the corresponding LET distributions. Dose distributions D1.1 and DRBE assuming constant and variable RBE, respectively, and LET were compared among the institutions. Inter-center variability was assessed based on dose- and LET-volume-histogram parameters.
Results
Treatment plans from six institutions fulfilled all clinical goals and were eligible for common analysis. D1.1 distributions in the target volume were comparable among PT institutions. However, corresponding LET values varied substantially between institutions for all field arrangements, primarily due to differences in LET averaging technique and considered secondary particle spectra. Consequently, DRBE using non-harmonized LET calculations increased inter-center dose variations substantially compared to D1.1 and significantly in mean dose to the target volume of perpendicular and opposing field arrangements (p < 0.05). Harmonizing LET reporting (dose-averaging, all protons, LET to water or to unit density tissue) reduced the inter-center variability in LET to the order of 10–15% within and outside the target volume for all beam arrangements. Consequentially, inter-institutional variability in DRBE decreased to that observed for D1.1.
Conclusion
Harmonizing the reported LET among PT centers is feasible and allows for consistent multi-centric analysis and reporting of tumor control and toxicity in view of a variable RBE. It may serve as basis for harmonized variable RBE dose prescription in PT.
Background
In proton radiotherapy, a generic relative biological effectiveness (RBE) of 1.1 is applied to account for the higher biological effectiveness of protons over photons [Citation1]. However, particularly for normal tissue, a growing body of clinical evidence shows that RBE in proton therapy (PT) varies with linear energy transfer (LET) [Citation2–7]. This challenges current clinical practice and poses the need to quantify the RBE-driving LET in proton treatment plans. However, LET calculations are not yet implemented in clinical treatment planning systems (TPS) [Citation8], which hampers their routine clinical use in the treatment planning process [Citation9].
LET is defined as the expectation value of the energy loss per unit length by a charged particle in material [Citation1,Citation10] and used as a macroscopic measure for radiation quality. LET values are typically derived by analytical computation or Monte Carlo (MC) simulations [Citation11]. While LET values of monoenergetic particles can be determined with high precision, LET calculations based on a computed tomogram (CT) of, e.g., a patient, and for a mixed radiation field of a real clinical machine imply an averaging over the entire energy spectrum of the particles traversing the CT voxel. However, averaging approach and LET reporting are ambiguous and depend on numerous parameters, such as: (A) the weighting in LET averaging (track-averaging vs. dose-averaging), (B) the choice of considered secondary particles, (C) the calculation method (e.g., scoring technique) and (D) the physics model and parameters (e.g., electron production threshold and range cuts, step limits) set in the specific LET simulation environment. The influence of these parameters on averaged LET, hereafter denoted as LET, has been investigated in mono-centric research works [Citation11–16], where their effects can be isolated and investigated systematically. However, despite of their evident impact on LET, so far, no standard has been established for calculating and reporting LET in experiments, in clinical practice or for evaluating patient follow-up data [Citation17,Citation18]. Therefore, it must be evaluated whether the calculation and reporting of LET at different PT centers are coherent for the same treatment planning situation and whether LET distributions can currently be exchanged between centers in addition to dose.
This multi-centric study, including eight European PT institutions capable of center-specific LET simulations, presents a current status of applied frameworks for LET calculation at European PT institutions. It analyses the variability in institutional LET determination and its impact on variable RBE-weighted dose. A consensus how to harmonize LET reporting is proposed.
Material and methods
All institutions active in work package 9 of the European project Infrastructure in Proton International Research (INSPIRE) and technically capable to perform the simulations were eligible to participate and jointly agreed to take part in this multi-centric study (). Each of the eight institutions independently generated clinical-like treatment plans in a water phantom using a suitable TPS with their center-specific beam model. For a given target volume, treatment plans for three pre-defined beam setups had to comply with strict dose-objectives. Using their center-specific simulation environment available for LET calculations, all institutions provided LET and dose data, which were centrally stored and analyzed.
Table 1. Specification of simulation environments employed for dose and linear energy transfer (LET) calculation (#: nonharmonized,§: harmonized) and proton therapy system used at each of the eight proton therapy institutions.
Treatment planning
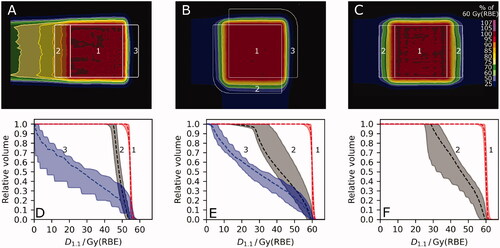
Treatment planning was conducted on a CT scan (1 × 1 × 1 mm³) of a homogeneous water phantom (40 × 50 × 38 cm³). A coherent set of TPS-specific look-up tables was used to ensure a consistent Hounsfield Unit to material assignment (based on mass density, material composition) and stopping-power ratio prediction among the different TPS and simulation environments used at the participating institutions () [Citation32,Citation33]. Every PT institution generated three non-robust pencil beam scanning (PBS) treatment plans that homogeneously dose-cover a cubic target volume (5 × 5 × 5 cm³) in the water phantom applying single-field uniform dose. The beam arrangements were (A) a single-field spread-out Bragg peak (SOBP), (B) two perpendicular fields and (C) two opposing fields, respectively (). The isocentre was at target volume center in 12.5 cm depth for the single-field SOBP and both perpendicular fields and 20 cm for opposing fields. Hence, no range shifter was applied. Prescribed mean dose to the target volume was 60 Gy(RBE) in 30 fractions for each beam arrangement, assuming a constant RBE of 1.1. Biologically equivalent doses using a constant RBE of 1.1 are denoted as D1.1. Treatment plans were optimized to cover 94% of the target volume with 100 ± 1% of the prescription dose (D1.1,94% = 100 ± 1%), as well as D1.1,1% < 102% and D1.1,99% > 98%. Distal dose fall-off, defined as the distance between distal 80% and 20% isodose lines, and distance of lateral 50% isodose to the target volume were optimized to be within 5–7 mm and less than 10 mm, respectively. No critical structures had to be spared in treatment planning. Institution-specific grid sizes for scoring of dose and LET were ≤ 2 × 2 × 2 mm³.
Figure 1. Dose distributions from one institution for a (A) single-field spread out Bragg-Peak, (B) perpendicular and (C) opposing field arrangement, displayed relative to the prescription dose of 60 Gy(RBE). (D), (E), (F) Dose-volume histograms (DVH) of the six institutions for each field arrangement (A), (B), (C), respectively, showing the median (dashed) and the interval from minimum to maximum DVH parameters (shaded area). A constant relative biological effectiveness (RBE) of 1.1 was applied to calculate the biologically equivalent dose (D1.1). Regions of interest: (1) target volume, (2) proximal dose build-up region, (3) steep distal dose fall-off region.
Simulation of linear energy transfer
Eight different simulation environments for dose and LET were used and every center used its site-specific, if available, clinical beam model for dose optimization and calculation (). Each institution used its respective LET simulation environment with its site-specific characteristic MC implementation parameters if applicable (). LET simulation environment specific parameters available for all institutions are found in Supplement Table A1. Details on the algorithms for LET calculations can be found elsewhere (cf. references in and Citation2).
Table 2. Specification of linear energy transfer (LET) calculations as implemented at the eight proton therapy institutions.
In this multi-centric study, LET calculations were divided in two methodological parts. To assess inter-center variability in LET calculation, in a first step, every center independently employed the LET averaging approach and considered the secondary particles according to their local practice. In the second part of the study, it was jointly concluded to harmonize LET reporting among the institutions. It was jointly decided on applying dose-averaging, considering all protons and scoring the LET to water or to unit density tissue, hereafter also referred to as harmonized LET. Two institutions changed their respective LET simulation environments between the two study parts (). Namely, one institution changed the applied environment-specific MC implementations from method II to VII and another institution from III to VIII ().
Plan evaluation
Treatment plan evaluation was performed centrally at one institution. Treatment plans were analyzed as reported, without any rescaling. LET was only evaluated in voxels with a minimum total absorbed dose of 1.82 Gy. Regions of interest were created for the dose build-up proximal to the target and steep dose fall-off distal to the target volume in all CT slices of the target volume and measured 15 mm in beam direction for all field arrangements ().
In addition to the defined clinical goals, the dose heterogeneity index (HI)
(1)
(1)
and the dose conformity index (CI)
(2)
(2)
were used as measures of treatment plan acceptability and comparability with VD98% and Vtarget being the volume encompassed by the 98% isodose line and the target, respectively and DX% being the dose in X% of the volume in the region of interest. The most homogeneous dose distribution (with an HI in the target volume closest to zero) was used as reference dose distribution for three dimensional global gamma analyses [Citation37] considering the high-dose region (>50 Gy(RBE)). For the gamma pass rate γ3,3, 3% of the prescribed dose and 3 mm were set as dose and distance to agreement criteria, respectively.
Inter-institutional differences in dose- and LET-volume histogram parameters were assessed by using the relative standard deviation σn, defined as one standard deviation divided by the arithmetic mean across the institutions, also known as coefficient of variation. It was observed that D1.1,99% in the distal region is not well defined as it is sensitive to the dose cutoff set and it was therefore excluded from the analysis. The in-vitro data-based model from Wedenberg and others [Citation38] was applied for voxel-wise variable RBE estimation and α/β was set to 2 Gy for the entire water phantom. Hereafter, biologically equivalent doses using a variable RBE are denoted by DRBE. A Levene test with a significance level of 0.05 was used to compare the variations of center-specific dose-volume parameters for different RBE-weighted doses.
Results
Seven out of eight institutions performed treatment planning for all cases. Six institutions provided their dose and LET results in an inter-operable clinical standard format (DICOM) allowing for an unambiguous common analysis of these six datasets. Results from two centers were, thus, excluded from the quantitative analysis (Methods IX and X, ).
For all three beam arrangements, institutions achieved adequate target coverage (D1.1,94% ≥ 95.6%, D1.1,95% ≥ 95.1%, D1.1,99% ≥ 92.0%) and dose hotspots were within clinical tolerance (D1.1,1% ≤ 105.4%) (). Hence, despite minor deviations in DVH parameters compared to the defined study goals, these six treatment plans were deemed acceptable.
D1.1 distributions from the different institutions were comparable within the target volume () with maximum relative inter-center variations and absolute differences in dose-volume histogram (DVH) parameters (D1.1,99%, mean D1.1, D1.1,1%) of 2.7% and 3.6 Gy, respectively (Supplement Table A2). In the high-dose region (> 50 Gy(RBE)), γ3,3 pass rates were above 91.8%, except for one single field SOBP dose distribution with a γ3,3 pass rate of 81.9%. In the target volume, all institutional D1.1 distributions were homogeneous (HI ≤ 0.13) and conformal with deviations from CI = 1 generally smaller than 0.16, except for two planning cases of one institution presenting maximum CI deviations of 0.22 and 0.32. In the proximal dose build-up and the steep distal dose fall-off regions, inter-institutional variations in DVH parameters were up to 33.5% and 18.8%, respectively, as they were not explicitly included in plan optimization (, Supplement Figure A1).
Compared to D1.1, inter-institutional variation increased for DRBE using non-harmonized LET calculations. A significant increase in mean dose variation in the target volume by 5.6 percentage points (pp) and 6.5pp was observed for the perpendicular and opposing field arrangement, respectively. Additionally, variations in non-harmonized DRBE were substantially higher (0.6pp to 10.4pp) than with D1.1 for all volume-histogram parameters except for proximal D99 of the perpendicular field arrangement (Supplement Table A2).
Center-specific LET reporting differed in the applied LET averaging technique and the considered secondary particle spectrum (). While one institution considered track-averaged LET, all others performed dose averaging LET calculations. The different types of secondary particle spectra considered by the centers could be categorized into four groups: (a) only primary protons, (b) all protons, i.e., primary protons and later proton generations, (c) primary protons and all ions with atomic charge Z = 1 (protons, deuterons, tritons) and (d) primary protons and all ions with Z ≤ 2 (protons, deuterons, tritons, alphas). Differences in averaging technique and secondary particle spectra resulted in inter-institutional LET variability (σn) in volume-histogram parameters by 13.9–57.1% (Supplement Table A2). Absolute LET differences increased from proximal dose build-up and target to distal dose fall-off region for single-field SOBP (and perpendicular fields) with inter-institutional differences in arithmetic mean of 1.0, 1.6, 2.8 keV/µm (and 1.5, 1.7, 4.2 keV/µm), respectively. Absolute differences in mean LET for opposing fields were 1.8 keV/µm and 4.8 keV/µm in the target and the proximal dose-build up region, respectively.
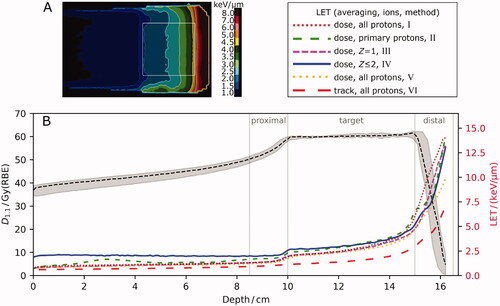
Figure 2. (A) Example of a linear energy transfer distribution (LET, dose-averaged, all protons), corresponding to the dose distribution in . Line profiles of the six institutions along beam central axis are depicted in (B) for biologically equivalent dose with relative biological effectiveness of 1.1 (D1.1, gray, upper) and non-harmonized LET distributions (color-coded, lower). Median D1.1 (dashed, black) with minimum and maximum values (shaded area) and detailed depiction of LET line profiles for all six institutional non-harmonized LET calculations show inter-institutional variability. Roman numerals correspond to characteristic implementation parameters for LET calculation according to . Z: atomic charge.
Applying the harmonized LETd to derive DRBE reduced inter-center variations in DRBE substantially. Compared to using non-harmonized LET, the variation decreased in the proximal, target and distal volume by up to 6.1pp, 5.5pp and 4.6pp, respectively (). In the target volume, the inter-institutional variability in harmonized mean (near-min, near-max) DRBE fell below 1.7% (2.9%, 3.3%). γ3,3 indices were above 89.2%, except for one single field SOBP dose distribution with a γ3,3 pass rate of 85.9%. Harmonized LETd reporting reduced the inter-institutional LETd variability (σn) by at least 9.0pp and up to 52.8pp resulting generally in a variability below 10% (, Supplement Figure A2). Exceptions were near-max LETd in the target volume for all beam arrangements with a remaining maximum difference of up to 14.0% and near-min LETd in the proximal region for opposing fields of 30.3% and 1.64 keV/µm (Supplement Table A2).
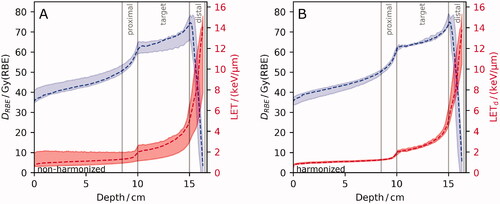
Figure 3. Line profiles from the six institutions along beam-central axis of the single-field spread-out Bragg peak for linear energy transfer (LET, red, lower) and for variable relative biological effectiveness (RBE)-weighted dose (DRBE, blue, upper) considering (A) non-harmonized LET and (B) harmonized LETd. DRBE was calculated with the Wedenberg RBE model (α/β = 2 Gy). Median (dashed) DRBE and LET are shown together with their minimum and maximum values (shaded area) showing inter-institutional variability. For definition of harmonized LET, please see section on Simulation of LET.
Using the harmonized LET definition, no inter-center DRBE variation was significantly different from the corresponding variation in D1.1 for any of the investigated DVH-parameters, regions or field arrangements. Inter-institutional variability in DRBE volume parameters exceeded that in D1.1 by less than 2.0pp in all evaluated regions and field arrangements, except for the near-min in the proximal region of opposing fields which differed by 4.3pp. Thus, the remaining inter-center DRBE variability was driven by the variability in absorbed dose.
Discussion
This multi-centric study presents a current status of LET calculations at European PT institutions. It harmonizes LET reporting among these institutions to enable consistent analysis and reporting of tumor control and side effects after PT in view of a variable biological effect. Harmonizing the reporting of LET reduced the LET and DRBE variability among the centers considerably. The observed inter-center variability in DRBE using harmonized LET was comparable to that of the underlying absorbed dose. In other words, DRBE and D1.1 can be obtained with equivalent precision.
Independent mono-centric studies showed a spatial correlation of radiation-induced injury with elevated LET in brain tumor, breast tumor and chest-wall patients after PT [Citation2–4,Citation6,Citation7,Citation20]. However, and in contrast to absorbed dose and therefore D1.1, these follow-up studies reported inconsistently on LET: they differ particularly in averaging method and secondary particle spectra. Additionally, a recent review observed highly inconsistent LET reporting in 354 studies quantifying RBE [Citation17]. Such diversity in LET reporting is in line with the findings in the first part of this study in which the participating institutions initially chose to report LET independently. The current inconsistent LET reporting complicates the inter-center transferability and comparison of clinically derived LET-driven variable RBE models and poses the need for a standardized reporting of LET in the clinics.
The inter-institutional variability in DRBE was primarily reduced by harmonization of LET averaging technique and secondary particle spectrum. The remaining increase of about 1.0pp in inter-center variability from using a constant RBE of 1.1 to harmonized DRBE calculations appears remarkably low, given that different beam models, planning systems, LET simulation environments, scoring techniques and individually optimized treatment plans were used among the institutions. In the target volume, the variability of harmonized mean DRBE between institutions remained below 1.6% and γ3,3 pass rates generally exceeded 90% for high DRBE regions (>50 Gy(RBE)). These findings compare with the recently postulated requirement before using LETd for RBE weighted dose calculations [Citation8]. It suggests that LETd calculation accuracy should impact the average DRBE in the target volume by less than 1.0% against mono-centric validation measurements. The observed high inter-institutional agreement in harmonized DRBE suggest the conceptual feasibility of multi-centric studies to derive clinical tumor RBE data with increased total patient numbers.
This study confirms that many PT institutions apply their own set of simulation tools, parameters and LET definitions complicating inter-institutional LET comparisons [Citation16]. The potential impact of MC implementation parameters on dose- and track-averaged LET calculations was investigated in monocentric studies earlier [Citation11–15]. This study found that the observed influence of institution-specific simulation software, simulation settings, and beam model on LET variability was relatively small if the same treatment planning situation was planned by multiple PT institutions. Standardization of simulation protocols by specifying step length, range cut and scoring technique in MC simulations, as recently suggested [Citation16], may further reduce differences in harmonized LETd and thus DRBE calculations. On the other hand, consistent reporting of LET by harmonizing averaging technique and secondary particle spectrum – both are typically easily available in LET simulations – resulted already in substantially increased inter-center LET comparability. Therefore, an adaptation of the suggested harmonized LETd calculations and reporting by other PT institutions appears feasible and could be the starting point for designing quality control that will be needed for clinical LET calculations and reporting in PT. It may also foster consistent reporting for experiments and modeling of RBE.
This study proposes to report the unrestricted dose-averaged LET for all protons to water or unit density as a measure for radiation quality in PT and to allow for inter-center comparisons of LET. This definition supports unambiguous LET reporting and coincides with the averaging technique, secondary particles and scoring medium most commonly specified in radiation biology experiments in PT [Citation17]. LETd is thought to reflect the LET-RBE relationship better than track-averaging [Citation11,Citation39,Citation40] and is used as input parameter in several in-vitro data-based variable proton RBE models [Citation41]. However, there is an active debate on which particles to include in LETd scoring in PT [Citation14,Citation15,Citation39] and the biological relevance of heavier secondaries on proton RBE remains to be quantified more accurately [Citation17]. Importantly, the LETd-RBE relationship depends on ion type [Citation42]. Therefore, we suggest to report LETd for protons only (all generations) to avoid mixing of different ion types and since protons also contribute most to the total dose (thus biological damage) in PT [Citation14]. Including heavier secondary particles (e.g., helium) in LETd simulations also slows down MC simulation convergence. Reporting LETd to water or to unit density tissue, which were sufficiently similar in our study (Supplement Figure A1), accounts for the fact that the main biological target, the cell nucleus, is independent of whether it is a bone or soft tissue cell [Citation42]. It is also consistent with reporting dose to water in radiotherapy [Citation43]. LETd to unit density tissue minimizes local material dependence by multiplying the LETd to material with the density of water and dividing it by the local density, in accordance with the report of the American Association of Physicists in Medicine on proton RBE [Citation1] and other studies [Citation42,Citation44,Citation45]. Further endorsement by a broader community (European Particle Therapy Network (EPTN), Particle Therapy Co-Operative Group, International Commission on Radiation Units and Measurements) would support the proposed harmonized reporting.
A recent systematic review concluded that the current RBE data basis is insufficient to identify the ‘correct’ LET for PT [Citation17]. Additionally, model parameters for several phenomenological RBE models were fitted to in-vitro data with various inconsistent LET definitions. This further complicates the direct application of many available in vitro-based RBE models for patient cases. To overcome this limitation and to allow for an application in patient treatment, it is recommended to update the current parameters of empirical models based on a consistent analysis of patient instead of pre-clinical response data – as recently requested by the EPTN [Citation18]. In the current situation, harmonized LET supports inter-center comparability when used as input parameter for existing phenomenological RBE models and when analyzing the radiation response to dose and LET after PT without changing center-specific procedures in MC frameworks.
This study primarily aimed at harmonizing reporting rather than validating institutional LETd calculations. Nevertheless, MC engines from RayStation and GEANT4 (as implemented in TOPAS and GATE) were previously benchmarked against independent MC simulations of LETd as well as measurements of their microdosimetrical equivalent mean lineal energy [Citation8,Citation46]. Here, RayStation- and GEANT4-based simulations provided consistent results with one another and other utilized simulation environments in terms of harmonized LETd. However, the present inter-center LET comparison does not replace the validation of a site-specific implementation of LETd calculations [Citation8,Citation11].
Six out of eight centers were able to convert their LET simulation data to DICOM format for both non-TPS MC engines and non-clinical research versions of commercially available TPS. Firstly, this enables consistent archiving of both dose and LETd data for upcoming patient outcome analysis on clinical RBE [Citation18]. Secondly, making LET distributions accessible in a clinical setting further informs clinicians on treatment plan safety in view of a variable RBE [Citation1]. Thirdly, sharing LET in a consistent data format (i.e., DICOM) allows for inter-center comparisons.
This study was limited to an investigation in a homogeneous medium where no critical organs had to be spared to precisely compare the physical quantities that determine to a large extent the radiation- induced DNA damage, i.e., dose and LET. Therefore, it may not fully reflect the treatment planning situation in patients. However, proton range and field arrangement primarily determine the spatial LET distribution [Citation44]. The arithmetic mean in LET in the target volume was 2.8 keV/µm for the studied perpendicular and opposing field arrangements and thereby comparable to those occurring in brain and prostate tumor patients with typically similar field arrangements, respectively [Citation19,Citation20,Citation47–52]. Upcoming multi-centric in-silico patient treatment planning studies may complement this water phantom study by comparing LET calculations in patients and assessing the present status of biological modeling in PT before considering some of the existing variable RBE models [Citation41] in clinical patient treatment.
In this multi-centric study, a harmonization of LET reporting in PT was proposed to overcome the existing inter-center differences in reporting LET with respect to averaging methods and secondary particle spectra. Other center-specific factors such as beam characteristics and calculation settings had a minor impact. Harmonized LET reporting reduces inter-center variability in LET and DRBE to a clinically acceptable level and can be easily adapted by other PT institutions. This allows for consistent analysis and reporting of tumor control and side effects after PT in view of a variable RBE. In this way, harmonizing LET reporting contributes to a more rapid and reliable implementation of variable RBE in proton therapy and may help to exploit the full potential of proton beam therapy.
Supplemental Material
Download MS Word (775 KB)Disclosure statement
JÖ is employed as a Researcher at RaySearch Laboratories. The other authors report no conflict of interest.
Additional information
Funding
References
- Paganetti H, Blakely E, Carabe-Fernandez A, et al. Report of the AAPM TG-256 on the relative biological effectiveness of proton beams in radiation therapy. Med Phys. 2019;46(3):e53–e78.
- Peeler CR, Mirkovic D, Titt U, et al. Clinical evidence of variable proton biological effectiveness in pediatric patients treated for ependymoma. Radiother Oncol. 2016;121(3):395–401.
- Underwood TSA, Grassberger C, Bass R, et al. Asymptomatic late-phase radiographic changes among chest-wall patients are associated with a proton RBE exceeding 1.1. Int J Radiat Oncol Biol Phys. 2018;101(4):809–819.
- Eulitz J, Troost EGC, Raschke F, et al. Predicting late magnetic resonance image changes in glioma patients after proton therapy. Acta Oncol. 2019;58(10):1536–1539.
- Eulitz J, Lutz B, Wohlfahrt P, et al. A Monte Carlo based radiation response modelling framework to assess variability of clinical RBE in proton therapy. Phys Med Biol. 2019;64(22):225020.
- Bahn E, Bauer J, Harrabi S, et al. Late contrast enhancing brain lesions in proton-treated patients with low-grade glioma: clinical evidence for increased periventricular sensitivity and variable RBE. Int J Radiat Oncol Biol Phys. 2020;107(3):571–578.
- Wang C-C, McNamara AL, Shin J, et al. End-of-range radiobiological effect on rib fractures in patients receiving proton therapy for breast cancer. Int J Radiat Oncol Biol Phys. 2020;107(3):449–454.
- Wagenaar D, Tran LT, Meijers A, et al. Validation of linear energy transfer computed in a Monte Carlo dose engine of a commercial treatment planning system. Phys Med Biol. 2020;65(2):025006.
- Lühr A, von Neubeck C, Pawelke J, et al. “Radiobiology of Proton Therapy”: results of an international expert workshop. Radiother Oncol. 2018;128(1):56–67.
- Seltzer SM, Bartlett DT, Burns DT, et al. The international commission on radiation units and measurements. J ICRU. 2011;11(1):NP.1–NP.
- Granville DA, Sawakuchi GO. Comparison of linear energy transfer scoring techniques in Monte Carlo simulations of proton beams. Phys Med Biol. 2015;60(14):N283–N291.
- Cortés-Giraldo MA, Carabe A. A critical study of different Monte Carlo scoring methods of dose average linear-energy-transfer maps calculated in voxelized geometries irradiated with clinical proton beams. Phys Med Biol. 2015;60(7):2645–2669.
- Guan F, Peeler C, Bronk L, et al. Analysis of the track- and dose-averaged LET and LET spectra in proton therapy using the geant4 Monte Carlo code . Med Phys. 2015;42(11):6234–6247.
- Mairani A, Dokic I, Magro G, et al. A phenomenological relative biological effectiveness approach for proton therapy based on an improved description of the mixed radiation field. Phys Med Biol. 2017;62(4):1378–1395.
- Grzanka L, Ardenfors O, Bassler N. Monte Carlo simulations of spatial LET distributions in clinical proton beams. Radiat Prot Dosimetry. 2018;180(1–4):296–299.
- Koh WYC, Tan HQ, Ang KW, et al. Standardizing Monte Carlo simulation parameters for a reproducible dose-averaged linear energy transfer. Br J Radiol. 2020;93(1112):20200122.
- Kalholm F, Grzanka L, Traneus E, et al. A systematic review on the usage of averaged LET in radiation biology for particle therapy. Radiother Oncol. 2021;161:211–221.
- Sørensen BS, Pawelke J, Bauer J, et al. Does the uncertainty in relative biological effectiveness affect patient treatment in proton therapy? Radiother Oncol. 2021;163:177–184.
- Hahn C, Eulitz J, Peters N, et al. Impact of range uncertainty on clinical distributions of linear energy transfer and biological effectiveness in proton therapy. Med Phys. 2020;47(12):6151–6162.
- Ödén J, Toma‐Dasu I, Witt Nyström P, et al. Spatial correlation of linear energy transfer and relative biological effectiveness with suspected treatment-related toxicities following proton therapy for intracranial tumors . Med Phys. 2020;47(2):342–351.
- Mein S, Choi K, Kopp B, et al. Fast robust dose calculation on GPU for high-precision 1H, 4He, 12C and 16O ion therapy: the FRoG platform. Sci Rep. 2018;8(1):1–12.
- Choi K, Mein SB, Kopp B, et al. FRoG—a new calculation engine for clinical investigations with proton and carbon ion beams at CNAO. Cancers. 2018;10(11):314–395.
- Perl J, Shin J, Schümann J, et al. TOPAS: an innovative proton Monte Carlo platform for research and clinical applications. Med Phys. 2012;39(11):6818–6837.
- Faddegon B, Ramos-Méndez J, Schuemann J, et al. The TOPAS tool for particle simulation, a Monte Carlo simulation tool for physics, biology and clinical research. Phys Med. 2020;72:114–121.
- Allison J, Amako K, Apostolakis J, et al. Recent developments in GEANT4. Nucl Instruments Methods Phys Res Sect A Accel Spectrometers Detect Assoc Equip. 2016;835:186–225.
- Sarrut D, Bardiès M, Boussion N, et al. A review of the use and potential of the GATE Monte Carlo simulation code for radiation therapy and dosimetry applications. Med Phys. 2014;41(6):064301.
- Grevillot L, Boersma DJ, Fuchs H, et al. Technical note: GATE-RTion: a GATE/Geant4 release for clinical applications in scanned ion beam therapy. Med Phys. 2020;47(8):3675–3681.
- Aitkenhead AH, Sitch P, Richardson JC, et al. Automated Monte-Carlo re-calculation of proton therapy plans using Geant4/Gate: implementation and comparison to plan-specific quality assurance measurements. BJR. 2020;93(1114):20200228.
- Russo G, Attili A, Battistoni G, et al. A novel algorithm for the calculation of physical and biological irradiation quantities in scanned ion beam therapy: the beamlet superposition approach. Phys Med Biol. 2016;61(1):183–214.
- Bourhaleb F, Attili A, Russo G. Monte Carlo simulations for beam delivery line design in radiation therapy with heavy ion beams. In: Mode CJ, editor. Applications of Monte Carlo methods in biology, medicine and other fields of science. Rijeka: InTech; 2011.
- Krämer M, Jäkel O, Haberer T, et al. Treatment planning for heavy-ion radiotherapy: physical beam model and dose optimization. Phys Med Biol. 2000;45(11):3299–3317.
- Wohlfahrt P, Möhler C, Enghardt W, et al. Refinement of the Hounsfield look-up table by retrospective application of patient-specific direct proton stopping-power prediction from dual-energy CT. Med Phys. 2020;0:1–11.
- Permatasari FF, Eulitz J, Richter C, et al. Material assignment for proton range prediction in Monte Carlo patient simulations using stopping-power datasets. Phys Med Biol. 2020;65(18):185004.
- Kopp B, Fuglsang Jensen M, Mein S, et al. FRoG: an independent dose and LETd prediction tool for proton therapy at ProBeam® facilities. Med Phys. 2020;47(10):5274–5286.
- Romano F, Cirrone GAP, Cuttone G, et al. A Monte Carlo study for the calculation of the average linear energy transfer (LET) distributions for a clinical proton beam line and a radiobiological carbon ion beam line. Phys Med Biol. 2014;59(12):2863–2882.
- Heinrich W, Wiegel B, Kraft G. β, Zeff, dE/dx, range and restricted energy loss energy loss of heavy ions in the region 1 ≤ E ≤ 1000 MeV/u. GSI Prepr. 1991;30:1–24.
- Wendling M, Zijp LJ, McDermott LN, et al. A fast algorithm for gamma evaluation in 3D. Med Phys. 2007;34(5):1647–1654.
- Wedenberg M, Lind BK, Hårdemark B. A model for the relative biological effectiveness of protons: the tissue specific parameter α/β of photons is a predictor for the sensitivity to LET changes. Acta Oncol. 2013;52(3):580–588.
- Grün R, Friedrich T, Traneus E, et al. Is the dose-averaged LET a reliable predictor for the relative biological effectiveness? Med Phys. 2019;46(2):1064–1074.
- Resch AF, Heyes PD, Fuchs H, et al. Dose- rather than fluence-averaged LET should be used as a single-parameter descriptor of proton beam quality for radiochromic film dosimetry. Med Phys. 2020;47(5):2289–2299.
- Rørvik E, Fjaera LF, Dahle TJ, et al. Exploration and application of phenomenological RBE models for proton therapy. Phys Med Biol. 2018;63(18):185013.
- Grassberger C, Paganetti H. Elevated LET components in clinical proton beams. Phys Med Biol. 2011;56(20):6677–6691.
- Paganetti H. Dose to water versus dose to medium in proton beam therapy. Phys Med Biol. 2009;54(14):4399–4421.
- Paganetti H. Relative biological effectiveness (RBE) values for proton beam therapy. Variations as a function of biological endpoint, dose, and linear energy transfer. Phys Med Biol. 2014;59(22):R419–R472.
- Giantsoudi D, Grassberger C, Craft D, et al. Linear energy transfer-guided optimization in intensity modulated proton therapy: feasibility study and clinical potential. Int J Radiat Oncol Biol Phys. 2013;87(1):216–222.
- Tran LT, Chartier L, Bolst D, et al. Characterization of proton pencil beam scanning and passive beam using a high spatial resolution solid-state microdosimeter. Med Phys. 2017;44(11):6085–6095.
- Carabe A, España S, Grassberger C, et al. Clinical consequences of relative biological effectiveness variations in proton radiotherapy of the prostate, brain and liver. Phys Med Biol. 2013;58(7):2103–2117.
- Wedenberg M, Toma-Dasu I. Disregarding RBE variation in treatment plan comparison may lead to bias in favor of proton plans. Med Phys. 2014;41(9):091706.
- Ödén J, Eriksson K, Toma-Dasu I. Inclusion of a variable RBE into proton and photon plan comparison for various fractionation schedules in prostate radiation therapy. Med Phys. 2017;44(3):810–822.
- Ödén J, Eriksson K, Toma-Dasu I. Incorporation of relative biological effectiveness uncertainties into proton plan robustness evaluation. Acta Oncol. 2017;56(6):769–778.
- Fjaera LF, Li Z, Ytre-Hauge KS, et al. Linear energy transfer distributions in the brainstem depending on tumour location in intensity-modulated proton therapy of paediatric cancer. Acta Oncol. 2017;56(6):763–768.
- Resch AF, Landry G, Kamp F, et al. Quantification of the uncertainties of a biological model and their impact on variable RBE proton treatment plan optimization. Phys Med. 2017;36:91–102.