
 ?Mathematical formulae have been encoded as MathML and are displayed in this HTML version using MathJax in order to improve their display. Uncheck the box to turn MathJax off. This feature requires Javascript. Click on a formula to zoom.
Abstract
Purpose
A cluster model incorporating heterogeneous dose distribution within the parotid gland was developed and validated retrospectively for radiotherapy (RT) induced xerostomia prediction with machine learning (ML) techniques.
Methods
Sixty clusters were obtained at 1 Gy step size with threshold doses ranging from 1 to 60 Gy, for each of the enrolled 155 patients with HNC from three institutions. Feature clusters were selected with the neighborhood component analysis (NCA) and subsequently fed into four supervised ML models for xerostomia prediction comparison: support vector machines (SVM), k-nearest neighbor (kNN), naïve Bayes (NB), and random forest (RF). The predictive performance of each model was evaluated using cross validation resampling with the area-under-the-curves (AUC) of the receiver-operating-characteristic (ROC). The xerostomia predicting capacity using testing data was assessed with accuracy, sensitivity, and specificity for these models and three cluster connectivity choices. Mean dose based logistic regression served as the benchmark for evaluation.
Results
Feature clusters identified by NCA fell in three threshold dose ranges: 5–15Gy, 25–35Gy, and 45–50Gy. Mean dose predictive power was 15% lower than that of the cluster model using the logistic regression classifier. Model validation demonstrated that kNN model outperformed slightly other three models but no substantial difference was observed. Applying the fine-tuned models to testing data yielded that the mean accuracy from SVM, kNN and NB models were between 0.68 and 0.7 while that of RF was ∼0.6. SVM model yielded the best sensitivity (0.76) and kNN model delivered consistent sensitivity and specificity. This is consistent with cross validation. Clusters calculated with three connectivity choices exhibited minimally different predictions.
Conclusion
Compared to mean dose, the proposed cluster model has shown its improvement as the xerostomia predictor. When combining with ML techniques, it could provide a clinically useful tool for xerostomia prediction and facilitate decision making during radiotherapy planning for patients with HNC.
Despite the fact that intensity modulated radiation therapy (IMRT), including volumetric modulated arc therapy (VMAT), has been showing efficacy in cancer treatment, radiation induced toxicity remains a challenge. One of the noticeable side effects in head-and-neck-cancer (HNC) treatment is xerostomia resulting from parotid and/or submandibular gland irradiation, adversely impacting the survivors’ quality of life. In order to minimize this treatment related side effect, radiation oncologists need an effective tool to make informed clinical decisions when designing treatment plans. The current dose-volume constraint on the parotid gland (PG) for IMRT/VMAT inverse planning is its mean dose (MD), recommended by the Quantitative Analyses of Normal Tissue Effects in the Clinic (QUANTEC) [Citation1]. While useful in reducing the risk of xerostomia, this dosimetric predictor has apparent drawbacks. Firstly, clinical data reports that even when the MD constraint (to one parotid gland <20 Gy or both parotid glands <26 Gy) with V30 < 50% was met, there were still a substantial amount of patients that reported xerostomia after completing treatment [Citation2,Citation3]. This indicates there is room for improved dosimetric guidelines. Secondly, MD is an aggregated predictor without taking into account the spatial dose distribution within the gland. Different spatial dose distributions could yield the same MD while the clinical outcomes could be different. Other dose volume histogram (DVH) based models such as the Lyman–Kutcher–Burman (LKB) model are more complex than the MD metric, but still lack the spatial dose information. These models either are based on the dose volume information [Citation4–6] or generate dose bins with incremental doses and employ the principal component analysis (PCA) to determine the principal components which are used as predictors within a logistic regression model [Citation7,Citation8].
Cervical spinal cord irradiation in rat models has demonstrated the impact of inhomogeneous distribution on its injury [Citation9–11], which cannot be reflected by either MD or DVH metrics. Other pre-clinical investigations on RT-induced xerostomia using rat models also indicated the possible impact of spatial dose within PG on its function [Citation12,Citation13]. Although unproven in humans yet, these findings emphasize the importance of the spatial information of the dose inside the critical structures. We hypothesize that the spatial dose distribution within PG is important in understanding the local dose effect of xerostomia. Indeed, Johns Hopkins group [Citation14] employed the voxel dose that formulated the actual dose in voxels as individual dosimetric predictors which are fed into the supervised machine learning models. Men et al. introduced a three-dimensional (3D) residual convolutional neural network with inputs of planning computed tomography (CT), 3D dose distribution and parotid contour for xerostomia prediction [Citation15]. A recent article has a comprehensive review on this topic [Citation16].
In this work, we adopted the cluster model that was previously introduced as a new predictor of xerostomia [Citation17–19]. The rationale is the following: (1) it incorporates the spatial information of the parotid dose that is more correlated to xerostomia than the MD metric; (2) it is based on the percolation theory that is the simplest model displaying a phase transition – the occurrence of xerostomia from RT. A single cluster size might be insufficient in predicting xerostomia, thus a group of variables are likely necessary. We employed machine learning (ML) methods and compared their performances so as to find an optimal model for xerostomia prediction to develop a statistically robust predictive model.
Material and methods
Patients data and clinical endpoints
In total, 155 HNC patients receiving radiotherapy with VMAT technique were retrospectively enrolled in this study. Of them, 65 are from H. Lee Moffitt Cancer Center (MCC), 63 from The Mount Sinai Hospital (MSH), and 27 from The Cancer Imaging Archive (TCIA) [Citation20], respectively. Patient data from MCC and MSH were allocated for feature selection and ML training and validation while those from TCIA were reserved for model testing solely. Tumor sites included larynx, hypo-, oro- and nasopharynx, oral cavity/tongue, nasal cavity and salivary glands. The prescriptions were 70 Gy to the planning target volume (PTV) at 2 Gy per fraction and total 35 treatments, or 66 Gy to PTV at 2 Gy/2.2 Gy per fraction and total 33/30 treatments. Either two arcs or three arcs were adopted for VMAT planning. The left and right glands were segmented on the axial slices of CT sets for each treatment plan and were analyzed independently as separate glands.
Xerostomia was scored for each patient following the Common Terminology Criteria for Adverse Events (CECAE) version 3 and was recorded based on the questionnaire of the level of their dry mouth post RT to 1 year following radiotherapy. There was no formal quality assurance of these scores except that the experienced HNC specialists followed the standard protocols and recorded the post-RT outcomes during their follow up visits. All selected patients have either no dry mouth (grade 0) or mild and severe levels (grade 1, 2, and 3). As a first and preliminary analysis, we adopted the binary classification strategy: patients with score of grade 0 or no xerostomia in one group and those with scores of grade >0 or with xerostomia in another group. As such, the first group consists of all 65 patients from MCC, 3 from MSH, and 18 from TCIA and the second one includes 60 from MSH and 9 from TCIA. The fact that all patients from MCC belong to the first category while majority (95%) of MSH patients developed xerostomia is due to the way how our clinical data were acquired. This might generate controversy but we would like to mention that what is more relevant to this study is the correlation of xerostomia with spatial dose distribution.
Cluster model and overview of the algorithm
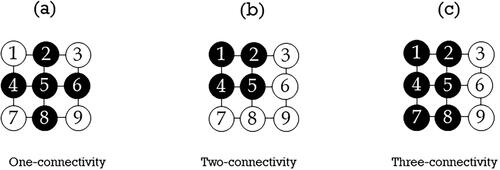
Cluster model was first introduced to quantify complication probability in treatment situations where a variety of hot-spot distributions exist [Citation19]. We employed the same concept and gained certain clinical insight with simulation studies [Citation17] and parameterizing the cluster size distributions with maximum likelihood fits to the LKB model with clinical cases [Citation18,Citation21], respectively. Dose cluster is an aggregation of voxels whose dose values are greater than the pre-set dose threshold. A cluster is normally characterized with connectivity which captures the spatial distribution information of the deposited dose inside the organ at risk. In two dimensions (2D), one-connectivity requires that each voxel in a cluster shares one side (not vertex) with at least one neighboring voxel (north, south, east, or west) as shown in ; two-connectivity entails that the voxel of interest must sit on the corner of a two-by-two voxel block (); for three-connectivity, the voxel of interest must sit on the corner of a two by three or three by two voxel block (). The definition of connectivity in 2 D can be easily extended to 3 D. Cluster size is calculated as the maximum size of the largest cluster (MSLC) with a given dose threshold and a connectivity requirement. To standardize the MSLC from different patients, we normalized it by the parotid volume of each patient.
Figure 1. Cluster formation and the connectivity of clusters in two dimensions. (a) One-connectivity; (b) Two-connectivity; and (c) Three-connectivity. The solid black circles form a cluster.
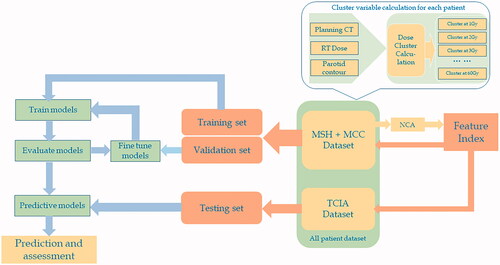
depicts the flow chart of the proposed predictive model. For each patient, planning computed tomography (CT), RT dose, and RT structure (PG contour) were exported from treatment planning system for PG cluster calculation. Threshold doses from 1 Gy to 60 Gy at 1 Gy step were applied to obtain 60 cluster sizes for each PG, forming a 310 × 60 matrix where each column represents a predictor variable, and each row corresponds to a PG. Similar strategy was adopted in our recent presentation [Citation22]. Neighborhood component analysis (NCA) was applied to the combined MCC and MSH dataset to select feature clusters/indices which were then used to filter the combined dataset to form ML training and validation sets. The same feature indices were performed on TCIA dataset to generate the testing set. Training and validation sets were employed to train and fine tune ML models to determine the predictive models with optimal parameters which were lastly applied on the testing set for xerostomia prediction. NCA and ML methods are described in greater detail in the following sections.
Figure 2. Flow chart of the machine learning predictive models based on the dose clusters that incorporate the spatial dose distribution within the parotid gland. NCA: neighborhood component analysis; MCC: Moffitt Cancer Center; MSH: Mount Sinai Hospital.
Feature variable selection
The purpose of feature variable selection is twofold: (1) it helps in understanding the correlation between clusters and toxicity, revealing the structure of the percolated cluster; (2) selecting only a subset of predictor variables from the high-dimensional data to facilitate the prediction process. We employed NCA [Citation23,Citation24] to select feature variables from the variable matrix. NCA, different from PCA which forfeits ease of interpretation, is a non-parametric method to select features by computing the weight vector associated with the features such that irrelevant feature weights are shrunk to zero under leave one out (LOO) classification scheme. Mathematically, the weights of features, are updated based on the stochastic gradient descent with the objective function:
where
is the probability of data point
selects another data point
as its nearest neighbor and inherit its class label; yij = 1 if and only if yi = yj (yi and yj represent the class labels) and yij = 0 otherwise;
is the regularization parameter to avoid overfitting which is tuned using k-fold cross validation. The overall goal is to maximize f(w) with the regularization term
Mean dose as xerostomia predictor compared to cluster model
The effectiveness of mean dose as the xerostomia predictor was evaluated in contrast to the cluster model predictors, serving as a benchmark. Logistic regression fits to the mean dose and feature clusters selected by the NCA were performed based on the entire patient dataset. The performance of the two choices was assessed with the area under the curves (AUC) of the receiver operating characteristic (ROC).
Machine learning methods and validations
Four supervised machine learning models: support vector machines (SVM), k-nearest neighbor (kNN), naïve Bayes (NB), and random forest (RF) were adopted to classify the categorical data of xerostomia. These ML models were trained with the training/validation dataset. The performance of each model was assessed with 10-fold cross validation using the classification loss as the metric and fined tuned for optimal performance with the validation data. Furthermore, the classification ability for each model was quantitatively evaluated using ROC curves and the corresponding AUCs. Both quantities were also calculated with 95% confidence intervals. Measures such as accuracy, specificity, and sensitivity were used to quantify the predictive power of the ML models on the testing data. To make a statistically significant comparison of the prediction performance across models, thirty random seeds were generated to split the training/validation dataset for feature selection and subsequent ML model training and prediction on the testing dataset for each model. Note that we have checked the lists that were recommended as guidelines for ML publication in medical physics field [Citation25].
Results
The typical feature selection results with NCA are shown in . shows the Loss function (mean squared error) as a function of the regularization parameter where the minimal Loss function value determines
while depicts the feature weights as a function of the threshold dose (feature index). The parameter
was tuned with ten-fold cross validation. The empirical tolerance was set to be 0.2 which decides the number of selected feature variables. The important feature variables are around 10, 30, and 48 Gy. The most pronounced feature variables are around 10 Gy as shown in . The frequency of each feature variable (cluster bin) resulting from the thirty random processes is presented in the histograms shown in , demonstrating similar pattern to the feature weight distribution.
Figure 3. Neighborhood component analysis (NCA) for the feature selection from 60 cluster size bins with all patient data for subsequent machine leaning methods. (a) Loss function (mean squared error) as a function of the regularization parameter (b) feature weights as a function of the dose threshold (feature index); (c) normalized frequency of each bin being selected by NCA with thirty random processes. Only the case of one-connectivity is shown and the other two connectivity choices have similar patterns.
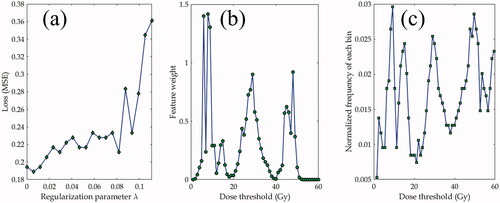
The feature variables selected with the NCA analysis agreed with what the Spearman correlation yielded where its correlation coefficient distribution between cluster sizes and toxicity revealed two peaks at 10 Gy (primary) and around 48 Gy (secondary), respectively. This result suggests that clusters at threshold doses of around 10 and 48 Gy play more important roles in the correlation with toxicity.
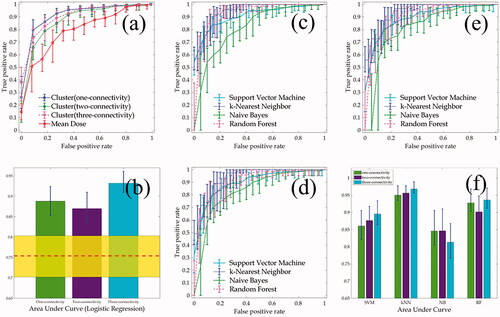
(ROC) and (b) (AUC) show the predictive performance using mean dose (the benchmark) compared to that with the proposed cluster predictor, both based on the logistic regression. The ROC curves and AUCs demonstrate the predictive ability with the mean dose predictor is inferior (∼15%) to that of the cluster based predictor, regardless of the connectivity choices. The ROC curves and AUCs for four ML models are shown in . The error bars on each plot represent the 95% pointwise confidence intervals for each model. Plots (c)–(e) depict the ROC curves for one-, two-, and three-connectivity choices, respectively, and plot (f) shows the AUCs for four models where the bar graphs for three connectivity choices. Among four ML models, they yield statistically comparable predictive power except that the kNN model (blue dotted line in ROC curves) shows slightly better performance. This observation is consistent with that from AUCs, as illustrated in plot (f). On average, one-connectivity is slightly better than the other two choices except in the case of naïve Bayes model, but again no substantial performance difference among them was observed.
Figure 4. (a) and (b) represent the comparison between the mean dose and cluster model based on the logistic regression where (a) shows the comparison of receiver of characteristics (ROC) curves and (b) the areas under curves (AUC) where the red dashed line and yellow band for 95% confidence interval for the mean dose predictor. (c–f) show the comparison between four supervised machine learning models where (c–d) are the ROCs corresponding to one-, two-, and three-connectivity choices, respectively and (f) represents the AUCs for them. Error bars represent 95% confidence interval on each plot. SVM: support vector machines; kNN: k-nearest neighbor; NB: naïve Bayes; RF: random forest; LR: logistic regression.
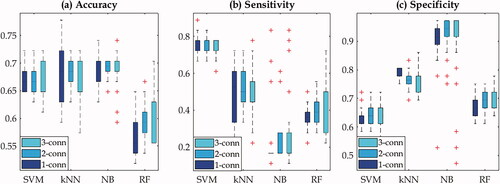
The performance of four ML models was also assessed on the testing data using measures such as accuracy, sensitivity, and specificity. The results based on the thirty random tests are depicted in the box plots as illustrated in . Plot (a) shows that three models including SVM, kNN, and NB yielded similar accuracy with medians at 0.67, 0.68, and 0.69 respectively while the RF model had median of accuracy less than 0.6. In plot (b) SVM displays the highest sensitivity while the NB model has the lowest. However, NB model has the highest sensitivity of over 0.9 among four ML models as shown in plot (c) but it is also the only model that has the large outliers in all three measures. From these result, SVM model has slightly better predictive performance in terms of accuracy and sensitivity compared to RF model but is comparable to kNN and NB models. There are no substantial differences among three connectivity choices for all four ML models. This is consistent with what ROC curves and AUCs have demonstrated.
Figure 5. Box plots for the machine learning performance based on the testing data using the measures of accuracy (a), sensitivity (b), and specificity (c) for four models. SVM: support vector machines; kNN: k-nearest neighbor; NB: naïve Bayes; RF: random forest. 1-conn: one-connectivity; 2-conn: two-connectivity; 3-conn: three-connectivity.
Discussion
Predicting xerostomia is complex and clearly cannot be guided solely by individual mean dose constraints. A study with a cohort of 153 patients with HNC showed that the LKB model based on mean dose failed to predict xerostomia at some time points [Citation3]. Development of more flexible models that could capture complexity of dose response is needed. In this study, we formed percolation based clusters as new predictors by incorporating spatial information of dose within the parotid with the quantity of connectivity. The comparison between the mean dose and the cluster model based on logistic regression is illustrated in .
Of four ML models, there is no substantial performance difference as demonstrated by the ROC/AUC in as well as the boxplots in . SVM model appears to outperform others in terms of accuracy and sensitivity compared to other three models. Overall, the predicting accuracy was in the range of 0.6–0.7 based on 30 random data partitions as illustrated in . These results, however, were obtained with a relatively small testing dataset − 18 patients that never developed xerostomia and 9 patients that developed xerostomia. Despite this drawback, the outcomes indicate that the parotid dose cluster models together with machine learning methods could serve as a potentially useful tool in xerostomia prediction.
Dose cluster model plays an essential role in this study. According to percolation theory, theoretically there exists a dose, coined as percolation dose, with which the phase transition, xerostomia in our study, would occur [Citation26]. As demonstrated in our previous Monte Carlo study [Citation17], the MSLC could act as a metric measure to quantify percolation. However, the existence of a unique percolation dose was not confirmed, indicating that there is a probability of RT-induced complication occurring given a threshold dose. This reasoning makes us to calculate sixty cluster bins with incremental threshold doses rather than focusing on any specific dose cluster. Indeed, the NCA analysis revealed that the cluster sizes near threshold dose of 10 Gy were predominantly important, together with those around 28 and 48 Gy as shown in the middle plot of . These feature clusters indicate that the inhomogeneous radiation sensitivities within in the gland, besides the different radio-sensitivities among different salivary glands [Citation27,Citation28], which entails a closer look at the correlation of the sub-regions and radiation dose. This work is ongoing and will be reported in another publication. Another advantage of the selected feature variables, cluster sizes, lie in the fact that ML models use much reduced and yet pertinent data set so the computational cost can be substantially reduced.
Examining ROC/AUC in shows that kNN model outperformed other models. This was likely caused by the fact that input cluster sizes to the ML models were chosen with the NCA analysis which is essentially an embedded method specifically developed to be used with kNN classifier [Citation23,Citation24]. However, the SVM model seems to yield slightly better outcome in terms accuracy and sensitivity with the testing data. This observation might be due to the fact that SVM assumes there exists a hyper-plane to separate the data points while kNN attempts to approximate the underlying data distribution in a non-parametric fashion. Although we ran thirty random tests, each of them, in nature, still represents one snapshot in data. To objectively assess ML performance, more general validation method such as nested cross validation might provide a more consistent answer [Citation29]. However, the training data quality may be more important in the entire process as elaborated next.
Many factors affect the prediction accuracy with ML models. First, data quality such as how reliable of the patient reported xerostomia level matters. As described in the section Patient Data, there was no formal quality assurance of these scores except that the experienced HNC specialists followed the standard protocols and recorded the post-RT outcomes during their follow up visits. This grading procedure could cast doubt on the accuracy of the xerostomia, which would impact on the model training and consequently the prediction. Secondly, and perhaps the most significant, is the xerostomia reported by the patients was caused by damaged parotid gland (accounts for 60–70% salivary production in total) exclusively or collectively with other salivary glands such as submandibular and/or the oral cavity which contains minor salivary glands [Citation1,Citation30–32]. While there are investigations on resolving this question, there is no definitive conclusion yet. Our model focuses on the parotid gland only, thus there is a possibility that our data might not be all correlated with the complication. Thirdly, dose clusters were calculated based on the treatment plans which were completed before RT while the xerostomia was reported post RT. There could be anatomical variations such as parotid shrinkage during treatment, which could also change the functional predictions. Plan adaptation is possible and the dose clusters, in theory, can be updated to reflect the adapted plan. New ROCs could be constructed to evaluate any change in the prediction of xerostomia. Alternatively, the delivered dose of radiation can be reconstructed for every fraction delivered. The reconstructed doses can be deformed and summed. New ROCs can be generated and compared to the nominal plan curves.
We attempted to develop a potential tool for xerostomia prediction to improve RT quality. The rationale is that the complication is correlated with spatial dose distribution within PG. Although the results have shown reasonable predication accuracy, we admit that model training and validation is based on a limited dataset. It is particularly true that for ML methods, while suitable models are important, sufficient data for training and validation is equally important [Citation33]. For the results presented in , for example, generating 30 random sets was simply a way to bootstrap and the purpose of doing that was to estimate the uncertainty caused by the training and validation, but the p-values are not reliable in this case. To have valid assessment, external testing with more test dataset is needed. As stated in the QUANTEC paper [Citation1], ‘An overarching goal is the validation of an accurate predictive salivary function model. This will probably require combining multiple institutional or cooperative group data sets.’ Therefore, besides the choice of appropriate models, more high-quality patient data is indispensable in implementing an effective tool for xerostomia prediction.
Conclusions
We reported our findings on the xerostomia prediction using the cluster model incorporating heterogeneous dose distribution within PG together with machine learning methods. Compared to the mean dose predictor, the dose cluster-based model together with ML improves the xerostomia prediction performance and could be an important decision-making tool for the clinicians during treatment planning for HNC.
Acknowledgement
The authors thank Drs. Daniel Dickstein (MSH) and Kujtim Latifi (MCC) for their assistance in providing the list of patients and transferring treatment plan data to facilitate analysis.
Disclosure statement
No potential conflict of interest was reported by the author(s).
References
- Deasy JO, Moiseenko V, Marks L, et al. Radiotherapy dose-volume effects on salivary gland function. Int J Radiat Oncol Biol Phys. 2010;76(3):S58–S63.
- Buettner F, Miah AB, Gulliford SL, et al. Novel approaches to improve the therapeutic index of head and neck radiotherapy: an analysis of data from the PARSPORT randomised phase III trial. Radiotherapy Oncol. 2012;103(1):82–87.
- Gabryś HS, Buettner F, Sterzing F, et al. Parotid gland mean dose as a xerostomia predictor in low-dose domains. Acta Oncol. 2017;56(9):1197–1203.
- Blanco AI, Chao KS, El Naqa I, et al. Dose-volume modeling of salivary function in patients with head-and-neck cancer receiving radiotherapy. Int J Radiat Oncol Biol Phys. 2005;62(4):1055–1069.
- Beetz I, Schilstra C, van der Schaaf A, et al. NTCP models for patient-rated xerostomia and sticky saliva after treatment with intensity modulated radiotherapy for head and neck cancer: the role of dosimetric and clinical factors. Radiotherapy Oncol. 2012;105(1):101–106.
- Lee TF, Liou MH, Huang YJ, et al. LASSO NTCP predictors for the incidence of xerostomia in patients with head and neck squamous cell carcinoma and nasopharyngeal carcinoma. Sci Rep. 2014;4:6217.
- Dawson LA, Biersack M, Lockwood G, et al. Use of principal component analysis to evaluate the partial organ tolerance of normal tissues to radiation. Int J Radiat Oncol Biol Phys. 2005;62(3):829–837.
- Kaae JK, Johnsen L, Hansen CR, et al. Relationship between patient and physician-rated xerostomia and dose distribution to the oral cavity and salivary glands for head and neck cancer patients after radiotherapy. Acta Oncol. 2019;58(10):1366–1372.
- Powers BE, Thames HD, Gillette SM, et al. Volume effects in the irradiated canine spinal cord: do they exist when the probability of injury is low? Radiotherapy Oncol. 1998;46(3):297–306.
- Bijl HP, van Luijk P, Coppes RP, et al. Dose-volume effects in the rat cervical spinal cord after proton irradiation. Int J Radiat Oncol Biol Phys. 2002;52(1):205–211.
- Bijl HP, van Luijk P, Coppes RP, et al. Unexpected changes of rat cervical spinal cord tolerance caused by inhomogeneous dose distributions. Int J Radiat Oncol Biol Phys. 2003;57(1):274–281.
- Konings AW, Cotteleer F, Faber H, et al. Volume effects and region-dependent radiosensitivity of the parotid gland. Int J Radiat Oncol Biol Phys. 2005;62(4):1090–1095.
- van Luijk P, Pringle S, Deasy JO, et al. Sparing the region of the salivary gland containing stem cells preserves saliva production after radiotherapy for head and neck cancer. Sci Transl Med. 2015;7(305):305ra147.
- Jiang W, Lakshminarayanan P, Hui X, et al. Machine learning methods uncover radiomorphologic dose patterns in salivary glands that predict xerostomia in patients with head and neck cancer. Adv Radiat Oncol. 2019;4(2):401–412.
- Men K, Geng H, Zhong H, et al. A deep learning model for predicting xerostomia due to radiation therapy for head and neck squamous cell carcinoma in the RTOG 0522 clinical trial. Int J Radiat Oncol Biol Phys. 2019;105(2):440–447.
- Ebert MA, Gulliford S, Acosta O, et al. Spatial descriptions of radiotherapy dose: normal tissue complication models and statistical associations. Phys Med Biol. 2021;66(12). DOI:https://doi.org/10.1088/1361-6560/ac0681
- Chao M, Wei J, Narayanasamy G, et al. Three-dimensional cluster formation and structure in heterogeneous dose distribution of intensity modulated radiation therapy. Radiotherapy Oncol. 2018;127(2):197–205.
- Chao M, Wei J, Lo YC, et al. Dose cluster model parameterization of the parotid gland in irradiation of head and neck cancer. Phys Eng Sci Med. 2020;43(1):143–153.
- Thames HD, Zhang M, Tucker SL, et al. Cluster models of dose-volume effects. Int J Radiat Oncol Biol Phys. 2004;59(5):1491–1504.
- Clark K, Vendt B, Smith K, et al. The cancer imaging archive (TCIA): maintaining and operating a public information repository. J Digit Imaging. 2013;26(6):1045–1057.
- Chao M, Wei J, Lo YC, et al. Percolation based cluster models fully incorporating spatial dose distribution in assessment of parotid gland radiation induced complication in head and neck cancer treatment. Int J Radiat Oncol Biol Phys. 2019;105(1):S169–S170.
- Chao M, El Naqa I, Lo YC, et al. Principal component analysis of dose clustering patterns for parotid toxicity modeling in head and neck radiation therapy. Med Phys. 2021;48(6):e212.
- Goldberger J, Hinton G, Roweis S, et al. Neighborhood components analysis. Paper presented at: Advances in Neural Information Processing Systems, Vancouver, Canada; 2004.
- Yang W, Wang K, Zuo W. Neighborhood component feature selection for high-dimensional data. JCP. 2012;7(1):161–168.
- El Naqa I, Boone JM, Benedict SH, et al. AI in medical physics: guidelines for publication. Med Phys. 2021;48(9):4711–4714.
- Stauffer D, Arahony A. Introduction to percolation theory. London: Taylor & Francis; 1991.
- Vissink A, van Luijk P, Langendijk JA, et al. Current ideas to reduce or salvage radiation damage to salivary glands. Oral Dis. 2015;21(1):e1–10.
- Grundmann O, Mitchell GC, Limesand KH. Sensitivity of salivary glands to radiation: from animal models to therapies. J Dent Res. 2009;88(10):894–903.
- Luo Y, McShan D, Ray D, et al. Development of a fully cross-validated Bayesian network approach for local control prediction in lung cancer. IEEE Trans Radiat Plasma Med Sci. 2019;3(2):232–241.
- Eisbruch A, Kim HM, Terrell JE, et al. Xerostomia and its predictors following parotid-sparing irradiation of head-and-neck cancer. Int J Radiat Oncol Biol Phys. 2001;50(3):695–704.
- Saarilahti K, Kouri M, Collan J, et al. Sparing of the submandibular glands by intensity modulated radiotherapy in the treatment of head and neck cancer. Radiotherapy Oncol. 2006;78(3):270–275.
- Jellema AP, Doornaert P, Slotman BJ, et al. Does radiation dose to the salivary glands and oral cavity predict patient-rated xerostomia and sticky saliva in head and neck cancer patients treated with curative radiotherapy? Radiotherapy Oncol. 2005;77(2):164–171.
- Cui S, Tseng H-H, Pakela J, et al. Introduction to machine and deep learning for medical physicists. Med Phys. 2020;47(5):e127–e147.