
Abstract
Background
The aim of this study was to investigate the effect of patient positioning based on either bone or soft-tissue matching for PT in oesophageal cancer and its impact on plan adaptation.
Materials and methods
Two retrospective patient cohorts treated with radiotherapy were included in the study. Cohort A consisted of 26 consecutive patients with a planning 4DCT scan (CT1) and a surveillance 4DCT scan (CT2) at fraction ten. Cohort B consisted of 17 patients selected based on large anatomical changes identified during treatment resulting in a rescan (CT2). Mean dose to the iCTV (sum of the CTVs in all respiratory phases) was 50.4 Gy (RBE) in 28 fractions or 41.4 Gy (RBE) in 23 fractions. A nominal pencil beam scanning plan was created using two posterior beams and robust optimization (5 mm setup, 3.5% range). For each patient, two rigid registrations were made between average (avg) CT1 and CT2: a match on the vertebral column (bone match) and a match on the iCTV (soft-tissue match). Robustness towards setup (5 mm) and range (3.5%) errors was evaluated at CT2. Robustness towards respiration was evaluated by recalculation of the plan on all phases of the CT2 scan. Dose coverage <96% would trigger adaptation. The statistical significance (p-value <0.05) between dose coverage for the two registration methods was assessed using the Wilcoxon signed rank test.
Results
All plans fulfilled V95%iCTV>99% for the nominal plan and V95%iCTV>97% for all respiratory phases and robustness scenarios at CT1. In two (8%) and three (18%) patients, V95%iCTV<96% on CT2 for Cohort A and B, respectively when bone match was used. For soft-tissue match, V95%iCTV >96% for all patients. V95%iCTV was significantly higher (p-value = 0.0001) for soft-tissue match than bone match.
Conclusion
Anatomical changes during the treatment course led to target dose deterioration and a need for plan adaptation when using a bone match.
Background
Radiotherapy (RT) for curative oesophageal cancer patients remains a challenging task due to the proximity of the oesophagus to vital organs, e.g., the heart and lungs. Intra-fractional motion of tumour and these vital organs in addition to inter-fractional anatomical changes of the diaphragm position prompt large safety margins resulting in radiation induced toxicity [Citation1–10]. Even though advanced photon delivery techniques such as intensity modulated radiation therapy (IMRT) or volumetric modulated arc therapy (VMAT) have improved the radiation dose distribution, doses to organs at risk (OARs) could be further reduced with the use of proton therapy (PT). This ability makes PT favourable compared to RT [Citation11–14].
Oesophageal tumours are often large and have complex shapes, and the position of the tumour may vary due to tumour shrinkage, organ motion, anatomical changes in the diaphragm region, or due to varying gastric filling [Citation15,Citation16]. The resulting density changes may result in more severe effects for PT as the penetration of protons is strongly affected by the tissue density through which they pass. Changes in the position of the diaphragm or high-density structures as the bones can therefore cause under-dosage of the target and hereby, destroy the potential benefit of PT.
Soft-tissue match allows for smaller margins [Citation17], but is seldomly used for protons due to concern about the dose deterioration if the vertebra is not in the planned position. This calls for investigation of the dosimetric effect of a soft-tissue match based on the tumour position, to reveal which match strategy ensure the highest dosimetric robustness.
Fortunately, density changes, breathing motion, and setup errors may be partly accounted for by use of robust optimization during treatment planning. The dose depletion due to anatomical changes in the diaphragm can be minimized with proper beam angle selection [Citation18]. The target deformation and inter-fractional shifts in the position of the diaphragm can be addressed with frequent patient imaging and can be handled by subsequent adaptive treatment planning [Citation19]. The day-to-day variations can be visualized through daily cone-beam CT scans (CBCT) used for patient positioning. Based on these scans, the patient position can be corrected based on different setup strategies. The most commonly used image registration strategy is a bone match using the vertebral column for registration. However, significant displacement of the oesophagus have been identified in patients who were setup according to the bony anatomy [Citation16,Citation20–22].
The purpose of the current study was to investigate the dosimetric effect of bone match versus soft-tissue match for PT in oesophageal cancer and the impact on the need for plan adaptation in preparation for the multi-centre randomized phase-III PROTECT-trial involving 38 European institutions.
Materials and methods
Patient selection
This retrospective study included two consecutive patient cohorts (A and B) with mid-thoracic, distal, or gastro-oesophageal junction (GEJ) cancer treated with RT.
Cohort A consisted of 26 consecutive patients who had a planning 4DCT scan (CT1) and a surveillance 4DCT scan (CT2) during the treatment course. Pre-operative RT was administered to 22 patients while definitive RT were administered to four patients. The patients were treated between 2014 and 2015. Treatment data from cohort A have been used previously to investigate the robustness towards respiration and anatomical changes during the treatment using standard bone match [Citation18,Citation23]. The intent to use the data in the present study, is to compare the dosimetric effect of bone match and soft-tissue match in PT.
Cohort B consisted of 183 patients treated between 2019 and 2021. The patients were setup using soft tissue matching on daily CBCT scans. Patients showing large anatomical changes during treatment had a rescan 4DCT (CT2) [Citation24]. In cohort B, 18 patients had a CT2 scan and were included in this study. Pre-operative RT was administered to eight patients whereas definitive RT were administered to ten patients. One patient from this group was excluded from the study due to technical reasons.
For all patients, tumour characteristics for cohort A and B in terms of CTV volume (cm3) and respiratory motion amplitude in cranial-caudal (cc) direction is presented as median [min, max] (see Supplementary Table 1). Details of CTV volume, location with respect to diaphragm position and respiratory motion amplitude in the three cardinal directions is given in Supplementary Table 2.
Image acquisition and registration
All patients had both a planning 4DCT (CT1) and a surveillance or rescan 4DCT (CT2) scan containing ten phases. For the first 26 patients, the CT2s were acquired at fraction ten while for the second group of 17 patients, the CT2s were acquired at median fraction number [min max] 10 [Citation5–15]. The patients were positioned with both arms above the head in individualized immobilization devices.
Target and OAR contours were delineated on the mid-ventilation (mv) phase of the CT1 and CT2 images by an experienced radiation oncologist. Target and OAR structures were propagated from the mv-phase to all phases of the 4DCT scan using a deformable image registration (DIR) algorithm (Eclipse v 16.1, Varian Medical Systems). Correct deformation was confirmed by visual inspection. The respiratory motion was included by super-positioning the clinical target volume (CTV) in all phases of the 4DCT to form an internal CTV (iCTV) [Citation25,Citation26]. For this study, an average image containing all ten phases of the 4DCT scan was retrospectively created for PT treatment planning (Eclipse v16.1, Varian Medical Systems). All targets and OARs were transferred rigidly to the average image.
For each patient, two automatic rigid registrations were made between avg CT1 and CT2 to mimic setup strategies: a match on the vertebral column using intensity range of 200 to 1700HU (CT2bone) and a match on the iCTV (CT2soft-tissue). All registrations were visually inspected. The matches were performed with vertical, longitudinal, lateral shifts and couch rotation.
The respiratory motion of the CTV centre-of-mass was determined for each 4DCT based on the centre-of-mass position for each of the propagated CTV structures. Additionally, the change in centre-of-mass position of the iCTV between avg CT1 and CT2 for both bone match and soft tissue match was determined.
Treatment planning and robustness evaluation
For all patients, retrospective proton plans were generated on the avg image covering the iCTV with a homogeneous dose distribution (95%–107%) using the Eclipse proton convolution superposition algorithm (version 16.1). All PT plans were optimized with a single field uniform dose (SFUD) algorithm using pencil beam scanning technique. A nominal plan was created using two oblique posterior beams (range 140–220°). Robust optimization of iCTV was performed using setup errors (5 mm in the three cardinal directions) combined with range errors (3.5%). A total of 14 scenarios were evaluated. Additionally, coverage of iCTV + margin (5 mm lateral, 6 mm anterior-posterior, 8 mm cranio-caudal) was required [Citation18]. The total dose was (definitive intent) 50.4 Gy (RBE = 1.1)/28 fractions or (pre-operative intent) 41.4 Gy (RBE = 1.1)/23 fractions. Robustness of the nominal treatment plan was evaluated on the average image used for treatment planning against the same parameters as the robust optimization. For the nominal plans, the iCTV volume receiving 95% of prescribed dose, V95%iCTV>99% was required. For the robustness evaluation towards setup and range uncertainty, it was required that V95%iCTV>97%. Similarly, for robustness towards respiration it was required that V95%CTV>97%. For the spinal cord, D0.05 cm3 <45 Gy for all scenarios.
The treatment plans were recalculated on all phases of the delineated CT2 scan with each of the two setup strategies to evaluate the combined effect of respiration and inter-fractional anatomical changes. Robustness of the treatment plan on the CT2 avg image was evaluated against range error (±3.5%) and setup of only 2 mm in the three cardinal directions as no inter-fractional contribution should be accounted for. Dose coverage of the worst-case scenario should fulfil V95%iCTV>96% and CT2 nominal plan V95%iCTV>98%. Robustness towards the respiratory motion was evaluated using the CTV. The treatment plan was calculated on all respiratory phases of the CT2. The recalculation on each phase should fulfil that V95%CTV>96%. All planning and evaluation criteria for the target and OAR dose stem from the PROTECT-trial RTQA guidelines (Supplementary Table 3). According to the guidelines, failure to fulfil these constraints, due to e.g., anatomical deviations from the planning simulation, will trigger plan adaptation. The goal of plan adaptation is to allow for modification of a treatment plan and hereby restore the intended dose distribution.
Diaphragm baseline shifts between avg CT1 and CT2 were measured on the left-sided diaphragm considering that the oesophageal hiatus lies immediately anterior and slightly to the left of the abdomen.
Statistics
The statistical significance of differences in CTV and iCTV dose coverage (V95%) was assessed using the Wilcoxon signed rank test. The statistical significance between centre of mass shift versus (vs) adaptation, respiration vs adaptation, diaphragm displacement vs adaptation was assessed using Spearman’s rank correlation coefficient. A p-value <0.05 was considered statistically significant.
CTV volume and respiratory motion amplitude was compared between cohort A and B using the Welch’s t-test. A p-value <0.05 was considered statistically significant.
Results
Evaluation of all robustness scenarios (setup and range) of the PT plans from patients in cohort A and B was performed at avg CT1, CT2bone, and CT2soft-tissue and is illustrated in . For all patients, V95%iCTV>97% at CT1. In cohort A, two (8%) and zero (0%) patients showed under-dosage of iCTV when bone and soft tissue registrations were used, respectively. In cohort B, selected based on large anatomical changes identified when treated with RT, three (18%) and zero (0%) patients showed under-dosage for PT when bone and soft tissue registrations were used, respectively. Overall, 12% of the patients had target under-dosage at CT2 after bone match. The value of V95%iCTV for the worst-case robustness scenario was 91% for CT2bone and 96% for CT2soft-tissue. The dose coverage (V95%iCTV) was significantly higher (p-value = 0.00014) for soft tissue match than bone match. The largest geographic misses in CT2bone were seen in patient 18, 20, and 27 in which thirteen out of fourteen robustness scenarios led to inadequate target coverage. In patient 35 and 42, seven and one out of fourteen scenarios led to inadequate target coverage, respectively. In patient 18 showing the lowest dose coverage of the target, a cranial shift of the diaphragm resulted in under-dosage of the part of the iCTV located at the level of the diaphragm. The under-dosage was caused by increased tissue density in the beam path, see . For the nominal plan, V95%iCTV=94.8% at CT2bone, while V95%iCTV=98.9% at CT2soft-tissue. The acceptance criteria was 98% for the nominal plan.
Figure 1. Robustness evaluation of V95%iCTV for CT1 and CT2 (with bone or soft tissue registration), respectively. Box plot: median (red vertical line), first and third interquartile ranges (box), and minimum/maximum (whiskers). Green and orange stars represent those patients where iCTV were above or below the diaphragm, respectively. Purple and red stars show those patients who have centre of mass shift between CT2bone and CT2soft-tissue >5 mm in cranio-caudal and anterior-posterior direction, respectively.
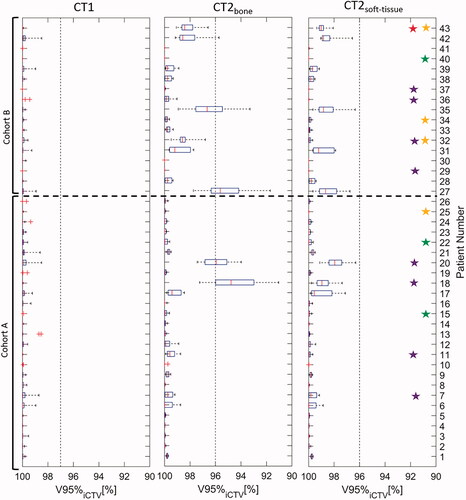
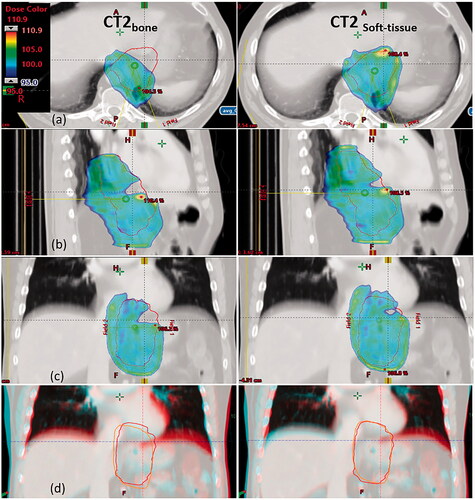
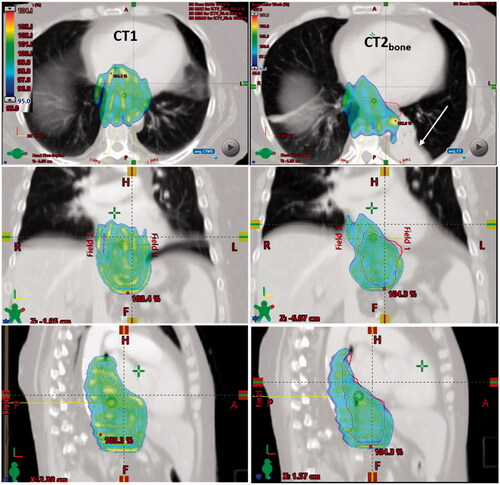
Figure 2. CT images, delineations and dose distributions for patient 18. Doses above 95% of prescribed dose are shown with dose colour wash for the PT plan. Orange and red contours represent the iCTV delineated on CT1 and CT2, respectively. Left column: bone match. Right column: soft tissue match. (a) transverse, (b) sagittal and (c) coronal view. Row (d) shows an overlay of CT1 and CT2 in coronal view. Turquoise is CT1, red is CT2.
The median [min, max] iCTV centre-of-mass shift (COMS) between the bone and the soft tissue match was 2 mm [−3, 2.4], 0 mm [−7.1, 8.5], and 0 mm [−5.5, 3.5] in lateral, cranio-caudal, and anterior-posterior direction, respectively. Centre-of-mass shifts of more than 5 mm were observed in eight (19%) patients along the cranio-caudal direction, and in one (2%) patient along the anterior-posterior direction. In , patients with a shift between the bone and soft tissue match larger than 5 mm in one of the cardinal directions have been marked with purple stars. No correlation was seen between COMS >5 mm and need for adaptation (p-value = 0.79).
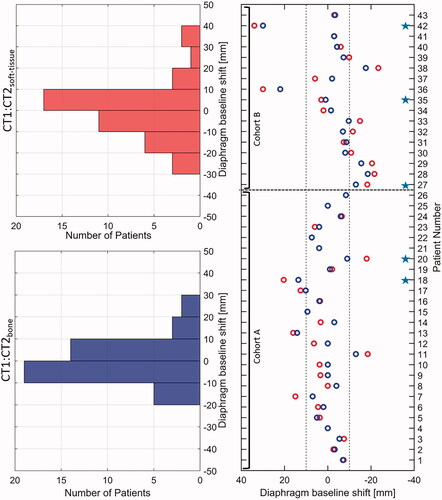
For each patient from cohorts A and B, the cranio-caudal displacement of the diaphragm was analysed between the avg CT1 and CT2 for bone and soft tissue match and is shown in . Overall, displacement of the diaphragm larger than 10 mm between CT1 and CT2bone was seen in 15 (35%) patients, and in four of these patients, target under-dosage was seen. For soft tissue match smaller displacements were seen, and the displacement was only larger than 10 mm in 10 (23%) patients and the target coverage was within the pre-set limits.
Figure 3. Displacement of diaphragm between CT1 and CT2bone match (red circles) and CT2soft-tissue match (blue circles). The dotted line represents the threshold of 10 mm. Positive shifts of the diaphragm represent a displacement in the cranial direction. The red histogram represents diaphragm baseline shifts between CT1 and CT2bone whereas the blue histogram represents diaphragm baseline shifts between CT1 and CT2soft-tissue along the cranio-caudal direction. Blue stars represent those patients for whom target under-dosage is seen for bone match setup.
Patients from two cohorts were included in this study. There was no significant difference in the respiratory target motion amplitude between the two cohorts whereas patients in cohort B had significantly smaller CTV volumes. Cohort A consisted of 26 consecutive patients with a CT2 scan. Cohort B consisted of 17 patients with large anatomical changes occurring during radiotherapy treatment which had prompted a CT2 scan. The purpose of entering two cohorts in this study was not to compare these cohorts but was based on data availability.
Target dose deterioration depended on the location of the target with respect to the diaphragm. For example, patient 36 had a large cranial shift of the diaphragm of 30 mm when bone match was performed and 22 mm for soft tissue match. This large diaphragm shift did not cause any dose deterioration due to the location of the target being predominantly below the diaphragm (Supplementary Figure 1). Similarly in patient 42, a large cranial diaphragm shift left the target dose nearly unaffected due to the target position being mostly cranial to the diaphragm. However, in this patient deformations of the target led to scattered under-dosage and dose deterioration below the acceptance limit was observed for CT2bone, as the target was very extended in the cranio-caudal direction (see Supplementary Figure 2). No iCTV dose depletion was observed for targets fully above or below the diaphragm.
The target under-dosage of patient 20 at CT2bone resulted from a lateral shift between the target and the vertebral column at CT2, which was resolved when performing a soft tissue match (see Supplementary Figure 3). In patient 27, target elongation resulted from a caudal shift of the diaphragm. This caused dose depletion as the target moved into the region where there was no dose (see Supplementary Figure 4). These effects were resolved by performing soft tissue matching.
Finally, major anatomical changes in the normal tissue may lead to target under-dosage. In patient 35, an atelectasis occurred at CT2 causing target deformation and density changes in the beam path and hence, dose depletion in the iCTV for CT2bone (see ).
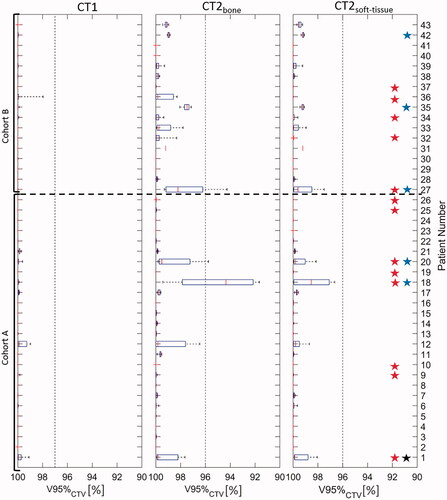
Recalculation of the nominal plan at all respiratory phases of the CT2 is illustrated in . Three patients showed under-dosage of the CTV at CT2bone. For soft tissue match, no patients showed under-dosage. Patients showing under-dosage at CT2 due to respiratory motion, also showed under-dosage at CT2 after robustness evaluation. At CT2, the median respiratory motion was 0 mm [0,2], 2 mm [1,9], and 1 mm [0,6] in lateral, cranio-caudal, and anterior-posterior direction. In thirteen patients, the CTV centre of the mass shift due to respiration was more than 5 mm along the cranio-caudal direction. No correlation between large respiratory motion and target under-dosage at CT2 was seen (p-value = 0.22).
Figure 4. Evaluation of V95%CTV coverage at all ten respiratory phases of CT1 and CT2 for cohorts A and B after bone match and soft tissue match, respectively. Box plot: median (red vertical line), first and third interquartile ranges (box), and minimum/maximum (whiskers). Red and black stars show those patients who have a respiratory shift larger than 5 mm in cranio-caudal direction or 5 mm anterior-posterior direction, respectively. Blue stars represent those patients for whom target under-dosage is seen for bone match setup.
No patients showed target under-dosage after soft tissue registration although this registration in some patients led to changes in the position of vertebrae and ribs and thus, density changes in the beam path.
Dose to the spinal cord was <45 Gy (RBE = 1.1) for all plans and scenarios at CT2. The median [min, max] value of mean lung dose (MLD) at CT1 was 2.4 Gy [0.2, 8.1]. At CT2, the median MLD was 2.5 Gy [0.2, 8.3] for CT2bone and 2.5 Gy [0.2, 8.3] for CT2soft-tissue. The median [min max] value of mean heart dose (MHD) at CT1 was 8.7 Gy [0, 17.6]. At CT2, the median MHD was 8.8 Gy [0.1, 16.5] for CT2bone and 9.1 Gy [0.1, 16.7] for CT2soft-tissue. No significant difference was found in MLD (p-value = 0.54) or MHD (p-value = 0.097) between CT2bone and CT2soft-tissue.
Discussion
This study shows the effect of patient positioning based on bone versus soft tissue setup for PT in oesophageal cancer patients and the impact on the plan adaptation rate. Overall, the iCTV dose coverage was significantly higher for soft tissue match compared to bone match. Inter-fractional changes led to target dose deterioration and required plan-adaptation according to the PROTECT-trial RTQA guidelines in 12% of the patients when using registration on the bony anatomy. No dose depletion above the pre-set limit was observed and hence, no adaptation was required for the soft tissue registration. This is in accordance with former studies investigating photon-based RT, were margin reduction was possible when using soft tissue registration compared to bony registration [Citation17].
Target dose depletion can occur due to several reasons including inter-fractional change in the cranio-caudal position of the diaphragm, geometrical shift or deformation of the oesophageal target, location of the target with respect to the diaphragm, respiratory motion, or anatomical changes of the surrounding OARs. For the target, we found that the largest inter-fractional displacement relative to the bones occurred in the cranio-caudal direction followed by the anterior-posterior direction. Similar results have been reported in previous studies [Citation17,Citation27]. In eight patients, the shift between the bone and the soft tissue match at CT2 was larger than 5 mm in the cranio-caudal direction with a maximum value of 8.5 mm. However, the combination of coverage of iCTV + margin (margin = 8 mm in cranio-caudal direction) and robust optimization of the iCTV secured full target coverage at CT2bone in six of the cases. In the remaining two patients, under-dosage was seen due to an inter-fractional shift of the diaphragm leading to under-dose at the level of the diaphragm (, patient 18), or a lateral shift and deformation of the target (Supplementary Figure 3, patient 20). When the soft tissue match was performed, the dose coverage for the nominal plan and all robustness scenarios at CT2 were met. However, under-dosage of iCTV is seen at the level of the diaphragm and clinicians may judge that the coverage is not acceptable.
Target dose deterioration due to diaphragmatic variation has previously been reported [Citation7,Citation28]. In fifteen patients, inter-fractional shifts of the diaphragm larger than 10 mm was seen. Only cranial shift of the diaphragm may lead to target under-dosage at the level of the diaphragm due to an increase of tissue density in the beam path. In six patients, the inter-fractional diaphragmatic cranial shift was larger than 10 mm. Robust SFUD plans with two posterior fields were made for this study, as this beam configuration previously has been shown to yield high robustness towards inter-fractional changes including diaphragmatic shifts [Citation23,Citation29]. Thus, only two patients had dose depletion below the acceptance level (patient 18 and 42). On the other hand, caudal shift of the diaphragm resulted in target elongation in one patient (patient 27) which resulted in under-dosage of the caudal part of the target (Supplementary Figure 4). It is noteworthy to mention that the change in the diaphragm position was not due to a change in the respiratory motion, but a real systematic inter-fractional deviation in the position of the diaphragm.
Inter-fractional anatomical changes like atelectasis or pleural effusion may lead to target under-dosage. In a study on thirty-four lung cancer patients, it was observed that 70% of the patients with atelectasis needed adaptive radiotherapy due to geometric shifts and/or dosimetric changes of the tumour caused by changes in the atelectasis [Citation30]. This becomes even more critical in proton therapy where a change in tissue density in the beam path may cause dose depletion (see ) [Citation31].
Figure 5. CT images, delineations and dose distributions for patient 35. Doses above 95% of prescribed dose are shown with dose colour wash for the PT plan. Orange and red contours represent the iCTV delineated on CT1 and CT2bone, respectively. An atelectasis appeared at CT2 at fraction five resulting in target under-dosage of bone match.
Fiducial markers have been investigated as a surrogate for the tumour position to be used for the setup verification [Citation17,Citation32–34]. However, tissue deformation makes the marker-based registration unfeasible in some patients [Citation17,Citation27]. Other setup strategies have formerly been analysed for oesophageal cancer. Carina-based registration resulted in inadequate target coverage compared with a bony anatomy-based registration for targets not confined to the mid-thoracic region nearby the carina [Citation35]. For lung and liver, tumour movement relative to the spinal cord has been observed and soft tissue matching improved the setup accuracy [Citation36,Citation37]. Similarly, for prostate cancer patients, higher target coverage and lower dose to the rectum was found for soft-tissue matching compared to bone match [Citation38,Citation39].
Dose deterioration due to respiration is highly dependent on the field directions. Recent studies investigating the dose deterioration for varying field directions have shown that posterior beams were optimal due to avoidance of entrance through the diaphragm [Citation23,Citation29]. For this study, respiration alone was not the problem for oesophageal target coverage due to application of two posterior beams. However, respiratory amplitude combined with large density changes between target and surrounding tissue increased the impact of respiration, in agreement with former findings [Citation40]. In a recent study, a comparison of two different beam arrangements was made. Two Right–Left (R-L) oblique posterior beams was compared to two Superior–Inferior (S-I) oblique posterior beams in terms of plan quality and robustness for distal oesophageal cancer [Citation41]. A significant dose reduction to the heart and lungs was observed for the S-I beam configuration. We tested the S-I beam configuration for those five patients who required plan adaptation after bone match. We found that the target position was very critical to obtain this benefit and in only one patient, a benefit in mean heart dose was found for the S-I beam configuration compared to R-L oblique posterior beams used in the present study (see Supplementary Figures 5 and 6). For the robustness towards anatomical changes, we found no benefit of using S-I oblique beams (see Supplementary Figure 7) compared to the beam configuration used in the present study.
For the OAR doses, no significant difference was observed between bone and soft tissue match.
This study has shown the advantage of patient positioning based on soft tissue setup for PT in oesophageal cancer patients. The present study had some limitations. Firstly, there was only one CT2 scan available. However, for each patient the scan was acquired either after ten fractions, e.g., approximately halfway through the treatment course, or after anatomical changes has led to re-scanning of the patient when treated by RT. Thus, the CT2 is expected to be representative for the larger deviations occurring during the treatment course. Secondly, only few patients actually needed adaptation due to the very robust treatment plans. Generally seen, soft tissue registration resulted in significantly higher target coverage than bony anatomy registration. A strength of this study was that the analysed cohort A patients were consecutive patients and cohort B patients were selected based on large anatomical changes during the RT course. For RT, these changes were counteracted by plan adaptation [Citation7]. Thus, PT with posterior-only beams is more robust than RT for oesophageal cancer patients. Of the seventeen patients needing adaptation for RT, only three needed adaptations for PT with bone match and no patients needed adaptation for PT with soft tissue match.
Conclusion
Setup using soft tissue match resulted in significantly better target coverage than bone match in proton therapy of oesophageal cancer patients. Proton therapy applying posterior beams is robust towards anatomical changes and no patients required plan adaptation according to the PROTECT-trial RTQA guidelines when performing soft tissue match, compared to 12% of the patients when bone match was performed.
Supplemental Material
Download MS Word (5.9 MB)Disclosure statement
No potential conflict of interest was reported by the author(s).
Data availability statement
Due to the nature of this research, participants of this study did not agree for their data to be shared publicly, so supporting data is not available.
Additional information
Funding
References
- Boekhoff MR, Defize IL, Borggreve AS, et al. CTV-to-PTV margin assessment for esophageal cancer radiotherapy based on an accumulated dose analysis. Radiother Oncol. 2021;161:16–22.
- Accordino MK, Neugut AI, Hershman DL. Cardiac effects of anticancer therapy in the elderly. J Clin Oncol. 2014;32(24):2654–2661.
- Beukema JC, van Luijk P, Widder J, et al. Is cardiac toxicity a relevant issue in the radiation treatment of esophageal cancer? Radiother Oncol. 2015;114(1):85–90.
- Lee HK, Vaporciyan AA, Cox JD, et al. Postoperative pulmonary complications after preoperative chemoradiation for esophageal carcinoma: correlation with pulmonary dose–volume histogram parameters. Int J Radiat Oncol Biol Phys. 2003;57(5):1317–1322.
- Li JC, Liu D, Chen MQ, et al. Different radiation treatment in esophageal carcinoma: a clinical comparative study. J Buon. 2012;17(3):512–516.
- Wang J, Wei C, Tucker SL, et al. Predictors of postoperative complications after trimodality therapy for esophageal cancer. Int J Radiat Oncol Biol Phys. 2013;86(5):885–891.
- Nyeng TB, Nordsmark M, Hoffmann L. Dosimetric evaluation of anatomical changes during treatment to identify criteria for adaptive radiotherapy in oesophageal cancer patients. Acta Oncol. 2015;54(9):1467–1473.
- Shirai K, Tamaki Y, Kitamoto Y, et al. Dose–volume histogram parameters and clinical factors associated with pleural effusion after chemoradiotherapy in esophageal cancer patients. Int J Radiat Oncol Biol Phys. 2011;80(4):1002–1007.
- Unkelbach J, Alber M, Bangert M, et al. Robust radiotherapy planning. Phys Med Biol. 2018;63(22):22TR02.
- Zhang X, Rong Y, Morrill S, et al. Robust optimization in lung treatment plans accounting for geometric uncertainty. J Appl Clin Med Phys. 2018;19(3):19–26.
- Chen Y-J, Liu A, Han C, et al. Helical tomotherapy for radiotherapy in esophageal cancer: a preferred plan with better conformal target coverage and more homogeneous dose distribution. Med. Oncol. 2007;32:166–171.
- Makishima H, Ishikawa H, Terunuma T, et al. Comparison of adverse effects of proton and X-ray chemoradiotherapy for esophageal cancer using an adaptive dose–volume histogram analysis. J Radiat Res. 2015;56(3):568–576.
- Hirano Y, Onozawa M, Hojo H, et al. Dosimetric comparison between proton beam therapy and photon radiation therapy for locally advanced esophageal squamous cell carcinoma. Radiat Oncol. 2018;13(1):23.
- Jethwa KR, Haddock MG, Tryggestad EJ, et al. The emerging role of proton therapy for esophagus cancer. J Gastrointest Oncol. 2020;11(1):144–156.
- Bouchard M, McAleer MF, Starkschall G. Impact of gastric filling on radiation dose delivered to gastroesophageal junction tumors. Int J Radiat Oncol Biol Phys. 2010;77(1):292–300.
- Yamashita H, Haga A, Hayakawa Y, et al. Patient setup error and day-to-day esophageal motion error analyzed by cone-beam computed tomography in radiation therapy. Acta Oncol. 2010; 49(4):485–490.
- Hoffmann L, Poulsen PR, Ravkilde T, et al. Setup strategies and uncertainties in esophageal radiotherapy based on detailed intra-and interfractional tumor motion mapping. Radiother Oncol. 2019;136:161–168.
- Møller DS, Alber M, Nordsmark M, et al. Validation of a robust strategy for proton spot scanning for oesophageal cancer in the presence of anatomical changes. Radiother Oncol. 2019;131:174–178.
- Yan D, Vicini F, Wong J, et al. Adaptive radiation therapy. Phys Med Biol. 1997;42(1):123–132.
- Fukada J, Hanada T, Kawaguchi O, et al. Detection of esophageal fiducial marker displacement during radiation therapy with a 2-dimensional on-board imager: analysis of internal margin for esophageal cancer. Int J Radiat Oncol Biol Phys. 2013;85(4):991–998.
- Hawkins MA, Aitken A, Hansen VN, et al. Set-up errors in radiotherapy for oesophageal cancers–is electronic portal imaging or conebeam more accurate? Radiother Oncol. 2011;98(2):249–254.
- Wang J-Z, Li J-B, Wang W, et al. Changes in tumour volume and motion during radiotherapy for thoracic oesophageal cancer. Radiother Oncol. 2015;114(2):201–205.
- Møller DS, Poulsen PR, Hagner A, et al. Strategies for motion robust proton therapy with pencil beam scanning of esophageal cancer. Int J Radiat Oncol Biol Phys. 2021;111(2):539–548.
- Van Nunen A, van der Sangen MJC, Van Boxtel M, et al. Cone-beam CT-based position verification for oesophageal cancer: evaluation of registration methods and anatomical changes during radiotherapy. Tech Innov Patient Support Radiat Oncol. 2017;3-4:30–36.
- Møller DS, Nielsen TB, Brink C, et al. Heterogeneous FDG-guided dose-escalation for locally advanced NSCLC (the NARLAL2 trial): design and early dosimetric results of a randomized, multi-centre phase-III study. Radiother Oncol. 2017;124(2):311–317.
- Wolthaus JWH, Sonke J-J, van Herk M, et al. Comparison of different strategies to use four-dimensional computed tomography in treatment planning for lung cancer patients. Int J Radiat Oncol Biol Phys. 2008;70(4):1229–1238.
- Jin P, van der Horst A, de Jong R, et al. Marker-based quantification of interfractional tumor position variation and the use of markers for setup verification in radiation therapy for esophageal cancer. Radiother Oncol. 2015;117(3):412–418.
- Visser S, den Otter LA, Ribeiro CO, et al. Diaphragm-based position verification to improve daily target dose coverage in proton and photon radiation therapy treatment of distal esophageal cancer. Int J Radiat Oncol Biol Phys. 2022;112(2):463–474.
- Yu J, Zhang X, Liao L, et al. Motion-robust intensity-modulated proton therapy for distal esophageal cancer. Med Phys. 2016;43(3):1111–1118.
- Møller DS, Khalil AA, Knap MM, et al. Adaptive radiotherapy of lung cancer patients with pleural effusion or atelectasis. Radiother Oncol. 2014;110(3):517–522.
- Hoffmann L, Alber M, Jensen MF, et al. Adaptation is mandatory for intensity modulated proton therapy of advanced lung cancer to ensure target coverage. Radiother Oncol. 2017;122(3):400–405.
- Schmidt ML, Hoffmann L, Knap MM, et al. Cardiac and respiration induced motion of mediastinal lymph node targets in lung cancer patients throughout the radiotherapy treatment course. Radiother Oncol. 2016;121(1):52–58.
- Schmidt ML, Hoffmann L, Møller DS, et al. Systematic intrafraction shifts of mediastinal lymph node targets between setup imaging and radiation treatment delivery in lung cancer patients. Radiother Oncol. 2018;126(2):318–324.
- Apolle R, Brückner S, Frosch S, et al. Utility of fiducial markers for target positioning in proton radiotherapy of oesophageal carcinoma. Radiother Oncol. 2019;133:28–34.
- Machiels M, Jin P, van Gurp CH, et al. Comparison of carina-based versus bony anatomy-based registration for setup verification in esophageal cancer radiotherapy. Radiat Oncol. 2018;13(1):48.
- Hoffmann L, Holt MI, Knap MM, et al. Anatomical landmarks accurately determine interfractional lymph node shifts during radiotherapy of lung cancer patients. Radiother Oncol. 2015;116(1):64–69.
- Bertholet J, Worm E, Høyer M, et al. Cone beam CT-based set-up strategies with and without rotational correction for stereotactic body radiation therapy in the liver. Acta Oncol. 2017;56(6):860–866.
- Nakahara R, Ishii K, Wakai N, et al. Dosimetric comparison between bone and target matching considering interfractional prostate motion in volumetric modulated arc therapy. IJMPCERO. 2018;07(01):47–60.
- Palombarini M, Mengoli S, Fantazzini P, et al. Analysis of inter-fraction setup errors and organ motion by daily kilovoltage cone beam computed tomography in intensity modulated radiotherapy of prostate cancer. Radiat Oncol. 2012;7(1):56.
- Graeff C. Motion mitigation in scanned ion beam therapy through 4D-optimization. Phys Med. 2014;30(5):570–577.
- Feng H, Sio TT, Rule WG, et al. Beam angle comparison for distal esophageal carcinoma patients treated with intensity-modulated proton therapy. J Appl Clin Med Phys. 2020;21(11):141–152.