
 ?Mathematical formulae have been encoded as MathML and are displayed in this HTML version using MathJax in order to improve their display. Uncheck the box to turn MathJax off. This feature requires Javascript. Click on a formula to zoom.
Abstract
Background
Respiratory-induced lung tumor motion may affect the delivered dose in stereotactic body radiation therapy (SBRT). Previous studies are often based on phantom studies for one specific treatment technique. In this study, the dosimetric effect of tumor motion was quantified in real patient geometries for different modulated treatments and tumor motion amplitudes for lung-SBRT.
Material and Methods
A simulation method using deformable image registrations and 4-dimensional computed tomographies (4DCT) was developed to assess the dosimetric effects of tumor motion. The method was evaluated with ionization chamber and Gafchromic film measurements in a thorax phantom and used to simulate the effect for 15 patients with lung tumors moving 7.3–27.4 mm. Four treatment plans with different complexities were created for each patient and the motion-induced dosimetric effect to the gross tumor volume (GTV) was simulated. The difference between the planned dose to the static tumor and the simulated delivered dose to the moving tumor was quantified for the near minimum (D98%), near maximum (D2%) and mean dose (Dmean) to the GTV as well as the largest observed local difference within the GTV (Maxdiff).
Results
No correlation was found between the dose differences and the tumor motion amplitude or plan complexity. However, the largest deviations were observed for tumors moving >15.0 mm. The simulated delivered dose was within 2.5% from the planned dose for D98% (tumors moving <15 mm) and within 3.3% (tumors moving >15 mm). The corresponding values were 1.7% vs. 6.4% (D2%); 1.7% vs. 2.4% (Dmean) and 8.9% vs. 35.2% (Maxdiff). Using less complex treatment techniques minimized Maxdiff for tumors moving >15.0 mm.
Conclusion
The dosimetric effects of respiratory-induced motion during lung SBRT are patient and plan specific. The magnitude of the dosimetric effect cannot be assessed solely based upon tumor motion amplitude or plan complexity.
Introduction
Stereotactic body radiation therapy (SBRT) is an effective treatment method for early stage non-small cell lung cancer (NSCLC) with demonstrated local control rates of 90%, which are comparable to surgery [Citation1–6]. With estimated overall survival rates of 90% and 60% at follow-up times of 1 and 3 years respectively [Citation7,Citation8] and observed increase in local tumor control without increasing the toxicity levels compared to 3-dimensional conformal radiation therapy (3DCRT) [Citation7], SBRT is the recommended treatment for early-stage inoperable NSCLC [Citation9]. SBRT is usually delivered in few fractions [Citation1–8] with high doses per fraction (7–20 Gy). Such fraction doses are more detrimental to the surrounding healthy tissue than conventional fractionation schemes of 2 Gy and may limit the possibilities of choosing SBRT for tumors located close to organs at risk (OAR) [Citation10]. Avoiding high doses to adjacent OARs can be done effectively using modulated treatment techniques such as volumetric modulated arc therapy (VMAT). These techniques have the potential to deliver dose distributions with higher dose conformity to the target volume than conventional treatment plans. The disadvantage is that the dynamic nature of the dose delivery for modulated treatment techniques can interplay with patient motions, e.g., tumor motions during the treatment delivery, causing undesirable effects on the delivered dose to both target and OARs [Citation11–17]. This concern is especially important for treatments in the thorax region where lung tumors sometimes can move several cm as the patient breaths [Citation18,Citation19]. If these effects are not accounted for, the accuracy, precision, and robustness of the treatment could be demoted.
Previous studies have shown that the impact of tumor motion during the delivery of VMAT tends to average out in most cases if the treatment is given with at least three fractions that are delivered with two or more arcs [Citation11,Citation13,Citation15,Citation17,Citation20–22]. However, even if the total dose to the tumor may average out in some circumstances, the delivered dose per fraction within the tumor can deviate from what was planned. Differences of up to 25% have been reported in phantom studies [Citation23–25]. The radiobiological effect of such fractional dose deviations is today not yet clear. It is therefore important to be able to predict the motion effects for modulated treatment techniques when they are used for treatments of moving targets. This knowledge would facilitate the selection of the most optimal and robust treatment for each individual patient and can assist in the decision whether a breathing adaptation technique should be used to restrict the tumor motion during the treatment delivery or if the tumor can be treated with the patient in free breathing. Most of the previous results on this topic are based on only phantom studies. In the current study, the results have been investigated on real patient geometries and the accuracy of the simulation model has been evaluated with measurements. Furthermore, previous studies were most often focused on one specific treatment technique or beam energy, i.e., VMAT, IMRT, or CA, making the differences between the techniques difficult to compare.
In this study, a method to simulate the dosimetric effects of respiratory motions during SBRT of tumors in the lung has been developed and evaluated. The simulation results were evaluated by comparisons with two different types of measurements in a phantom geometry. The simulation method was used on patient data to quantify the effects of tumor motion on the delivered dose to lung tumors that move during the treatment delivery for modulated SBRT with different treatment techniques and energies.
Material and methods
This report was written as a quality improvement study using the SQUIRE checklist [Citation26].
I. Simulation method
The dosimetric impact of respiratory-induced tumor motion was simulated using 4-dimensional computed tomography (4DCT) image series of a patient or a phantom in combination with deformable image registration (DIR) and dose tracking in Raystation 9B-R research version 8.99.100.3 (RaySearch Laboratories, Stockholm, Sweden). The dose tracking capability in Raystation allows the calculated dose for each voxel in a deformed image to be tracked back to the corresponding voxel in the original un-deformed image. In this way, the spatial dose distribution within structures that have changed their volume or position in-between two image series can be summarized and visualized. All deformations were performed using the hybrid intensity and structure-based DIR registration option in Raystation. This DIR approach uses the anatomically constrained deformation algorithm (ANACONDA) which combines image similarity terms with grid regularization terms, to keep the deformed image grid smooth, and anatomical penalty terms, in order to maintain the integrity of anatomical structures [Citation27,Citation28]. The weights of the individual terms have been optimized by Raysearch Laboratories to perform well on large data sets, but can be changed by the user. In this work, the original weights have been used for all the deformations.
For each simulation, a time-correlation was established between every beam-sub-segment of a treatment plan and the respiratory phase of the acquired 4DCT for the specific case. Ten equidistant time phases were used to create the 4DCT-sequences. The delivery time for each sub-segment of a treatment field was extracted from the field properties stored in the digital imaging and communications in medicine (DICOM) file. This information was used to calculate which sub-segments that were delivered during each specific 4DCT-phase for a given starting point, i.e., beam-on time relative to the breathing phase.
The dose contribution from each sub-segment was calculated in the corresponding 4DCT phase image according to the established time-correlation. To assess the delivered dose to the moving tumor, a DIR was performed between the original treatment planning CT and each specific 4DCT phase image. The DIR was used in combination with an in-house developed script in Raystation to track the dose for every voxel within the 4DCT image series back to the corresponding voxel in the original treatment planning CT where the total dose was summed and visualized.
II. Evaluation of the simulation method
The simulation method was evaluated with ionization chamber and Gafchromic film measurements in a dynamic thorax phantom. The phantom (CIRS model 008 A) consists of an interchangeable lung equivalent rod with the possibility of using different lung tumor inserts, e.g., one for ionization chamber measurements and one for film measurements. The lung equivalent rod was set in motion with predefined motion amplitudes of 10 or 30 mm in the inferior-superior (IS) direction and a trigonometric motion pattern of the type where A is the amplitude and t is the time after starting the motion. The cycle time (i.e., breath rate) of the motion was 5.0 s. The ionization chamber (Pinpoint 3 D, 0.016 cm3, PTW GmbH, Freiburg, Germany) was placed with its sensitive volume at the geometrical center of the tumor when moving 10 and 30 mm, and the film sheets (Gafchromic EBT-XD, Ashland Advanced Materials Inc., Bridgewater, NJ, USA) were placed in two perpendicular planes (the sagittal plane and the transversal plane) intersecting the geometrical center of the tumor when moving 30 mm. The film measurements were done separately, i.e., measuring one plane at a time. The diameter of the artificial tumor was 3 cm for the ionization chamber measurements and 2.54 cm (1 inch) for the film measurements.
For evaluation purposes, eight different modulated treatment plans were created using different delivery techniques (VMAT, conformal arc (CA)) and energies (6X, 6FFF). Six of the plans were created using the optimization algorithm in Eclipse (Varian Medical Systems Inc., Palo Alto, CA, USA) using either a VMAT technique or a conformal arc technique. The photon energy for these plans was either 6 MV or 6FFF. Two of the plans were created using the optimization algorithm in Raystation (RaySearch Laboratories, Stockholm, Sweden) and a VMAT technique with the photon energy of 6 MV. The characteristics of the treatment plans are tabulated in Supplementary Table A in the supplementary materials.
The plans, consisting of five half arcs (0−180°), were created for a TrueBeam accelerator with a 120 leaves high definition multi leaf collimator (Varian Medical Systems Inc., Palo Alto, CA, USA) and optimized following local clinical guidelines for SBRT of lung tumors. The prescription dose of 15 Gy per fraction was optimized to encompass at least 98% of the planning target volume (PTV) while giving as large volume as possible of the internal target volume (ITV) 140% of the prescribed dose and restricting the maximal dose to <160% of the prescribed dose. The PTV was created using a 5 mm symmetrical margin around the ITV which in turn was set equal to the gross tumor volume (GTV) including motions, as seen in the maximum intensity projection (MIP) of the reconstructed 4DCT phases. Four plans were optimized for a tumor motion of 10 mm in the IS direction and four plans were optimized for a tumor motion of 30 mm. The plans were optimized for the CIRS phantom with a spherical homogeneous tumor with a diameter of 30 mm and then recalculated with pre-set monitor units (MU) on the artificial tumor inserts used for the ionization chamber and film measurements. The complexity of the plans was scored using the edge area metric (EAM) [Citation29,Citation30].
The ionization chamber measurements were performed repeatedly on three different occasions for each plan, both for a static tumor, located in the same position as in the treatment planning CT and verified using cone beam computed tomography (CBCT), and for a tumor in motion. The relative difference between the measurement performed in the static tumor and the measurement performed in the moving tumor was calculated, and the mean difference from the three different measurement occasions was compared to the corresponding calculated difference using the simulation method described in Section I. The film measurements were performed accordingly, but they were only performed once.
For all measurements with the tumor in motion, the beam for each specific treatment arc was manually turned on when the tumor was located in the most caudal position of its trajectory in order to synchronize the beam delivery with the simulated dose delivery.
The films were scanned and analyzed using the red color channel approximately 36 h after exposure using an Epson 12000 XL flatbed scanner in combination with the FilmQA Pro software (Ashland Advanced Materials Inc., Bridgewater, NJ, USA). An averaging filter within the FilmQA Pro software was applied to decrease the noise. The results were evaluated in central profiles along the anterior-posterior (AP) and left-right (LR) directions for the films placed in the transversal plane and in the IS direction for the films placed in the sagittal plane. The film profiles for the static tumors were normalized at the central axis. The film profiles for the tumors in motion were normalized at the central axis in such a way that the difference relative to the static tumors was the same as the measured difference with the ionization chamber, i.e., if the measured ionization chamber dose at the central axis was 2.6% higher for the tumor in motion than the measured dose for the static tumor, the film profiles for the corresponding case were normalized to 1 for the static measurement and 1.026 for the moving tumor. The profiles were truncated at least 3 mm from the nearest film edge to avoid uncertainties caused by any potential damage to the film sheet edges.
III. Simulations on patient data
15 patients were selected from a cohort of 126 patients with lung tumors that had previously been analyzed to assess typical tumor motion during SBRT [Citation19]. The GTV volumes ranged from 0.7−64.7 cm3 and the tumor motion ranged between 7.3−27.4 mm (Supplementary Table B, supplementary section). The selection was done to include a variety of tumor motion amplitudes and GTV volumes. The same type of plans that were created for evaluation of the simulation method were created for the patients, i.e., four treatment plans per patient. Each treatment plan was optimized according to the clinical guidelines described in Section II. The plan complexity was calculated according to EAM [Citation29,Citation30]. The EAM ranged between 0.30–0.54 for the CA plans, 0.50–0.76 for the VMAT plans created in Raystation and 0.70–0.89 for the VMAT plans created in Eclipse. The detailed plan-, patient- and tumor motion characteristics are summarized in Supplementary Table B in the supplementary materials. For each patient, the simulation method described in Section I was used to simulate the motion effects on the delivered dose for the four different treatment plans. The cycle time for the tumor motion was set according to the patient’s actual cycle time (2.7−4.6 s), except for seven of the patients where the cycle time was set to 4.0 s because the actual cycle time was not available (Supplementary Table B, supplementary materials). For each plan, the dose difference in the GTV between calculations for a static tumor and calculations simulating breathing motions was compared. The difference in the near minimum dose (D98%), the near maximum dose (D2%), the mean dose (Dmean) as well as the largest observed local difference within the GTV (Maxdiff) were studied. The use of the radiotherapy database for this retrospective research was approved by the regional ethical review board in Gothenburg (No.110-15).
Results
I. Evaluation of the simulation method
The ionization chamber measurements were reproducible with a maximal variation of 0.8 percentage points (p.p.) between the different measurements. The difference between the measured values differed ≤0.7 p.p. from the calculated values based on the simulation method for all the measurements (). For the film measurements, the shape of the measured profiles with Gafchromic film coincided with the corresponding shape of the calculated profiles ().
Figure 1. The relative dose profiles in the anterior-posterior, left-right and inferior-superior directions of the tumor insert for tumors that were irradiated without any tumor motion (blue) and with a tumor motion of 30 mm in the inferior-superior direction (green). The dots and crosses indicate the measured profiles and the lines indicate the calculated profiles. The blue profiles for static tumors were normalized to 1 at the central axis and green profiles for the tumors in motion were normalized according to the corresponding ionization chamber measurements at the central axis.
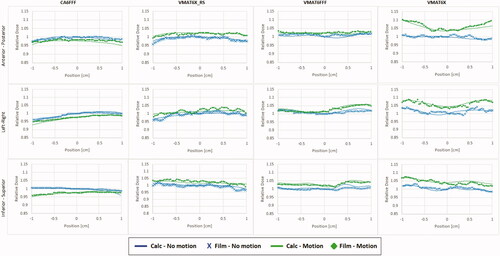
Table 1. The measured and calculated difference of the isocenter dose between the moving and the static tumor.
II. Simulations on patient data
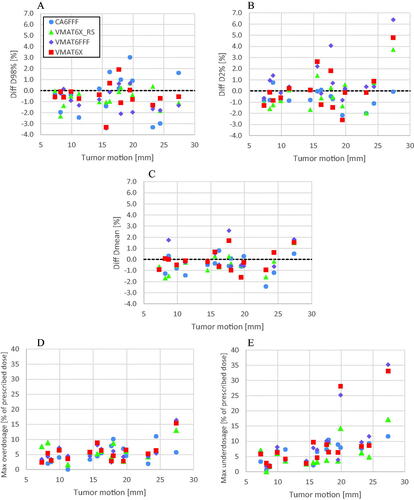
There was no correlation between tumor motion amplitude and the magnitude of the observed dose differences between planned dose, i.e., for a static tumor, and the simulated dose delivery during tumor motion for any of the treatment techniques (). The R2-values were ≤0.086 for D98%, ≤0.313 for D2%, ≤0.325 for Dmean, ≤0.578 for the maximum underdosage and ≤0.326 for the maximum overdosage. However, the largest deviations for the D98%, D2%, Dmean and Maxdiff were in all cases found for tumors moving >15.0 mm. For tumors moving < 15 mm, the dose differences were ≤2.5%, ≤1.7%, ≤1.7% and ≤8.9% for D98%, D2%, Dmean, and Maxdiff respectively.
Figure 2. The relative difference between the simulated delivered dose and the planned dose as a function of tumor motion for (A) D98%, (B) D2% and (C) Dmean for the GTV for all the performed simulations. Negative values indicate that delivering the dose while the tumor is in motion resulted in lower doses to the GTV than if the dose was delivered while the tumor was not moving. The difference in Maxdiff is presented in % of the prescribed dose and separately for the maximum overdosage (D) and maximum underdosage (E).
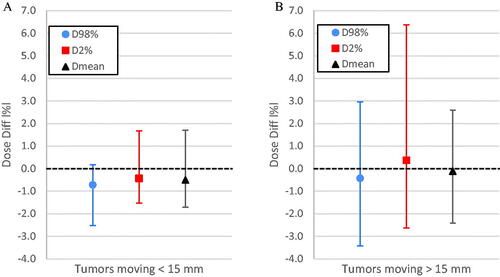
The overall spread of the dose difference for D98%, D2% and Dmean was smaller for tumors moving <15 mm than for tumors moving >15 mm ().
Figure 3. The overall spread of the difference in D98%, D2% and Dmean for tumors moving <15 mm (A) and >15 mm (B) including all different treatment techniques. The points indicate the mean difference, and the error bars indicate the maximum and minimum difference that was observed for each parameter.
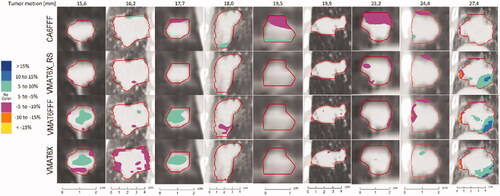
The dose difference within the GTV is visualized in selected coronal slices that whenever possible included regions of dose deviations exceeding 5% for patients with tumor motion amplitudes >15 mm ().
Figure 4. Coronal views showing the dose difference between simulated delivery for tumors in motion and static tumors for all the tumors with motion amplitudes >15 mm. Negative values indicate that delivering the dose while the tumor was moving resulted in lower doses to the region than if the dose was delivered while the tumor was static. The dose differences are presented as % of the prescribed dose. Regions with no color indicate that the dose difference was within ±5%.
Discussion
The simulation method that was developed in this study was shown to agree with ionization chamber and Gafchromic film measurements for similar treatment techniques and tumor motion amplitudes as the scenarios that were evaluated on patient data. The uncertainty of the simulations on the patient data should thus be of the same magnitude as in the evaluated phantom cases with the exemption that the results have only been evaluated along two perpendicular planes intersecting the geometrical center of the tumor and not in the entire 3 D volume. The simulation process is however the same throughout the entire tumor volume and the accuracy should therefore not be dependent on the location within the tumor.
Earlier studies conclude that the dosimetric effects average out if the treatment is given in several fractions and multiple arcs. However, since stereotactic body radiation therapy (SBRT) is often given in 3–4 fractions, the averaging effect might be compromised. Moreover, due to situations like the COVID-19 pandemic, strategies like single-fraction SBRT have been endorsed by organizations such as the European Society for Radiotherapy and Oncology-American Society for Radiation Oncology (ESTRO-ASTRO) [Citation31,Citation32]. For such single-fraction treatments the averaging effect is not valid. Furthermore, even if the total dose to the GTV is in agreement with the planned dose due to the averaging effect over multiple fractions, there is no data to confirm how the potential under- or overdosage regions that occur within the GTV in specific fractions affect the total biological effect of the treatment. Studies like Gauer et al. [Citation25], Edvardsson et al. [Citation23] and Archibald et al. [Citation24] have shown that dose differences up to 25% may occur within the target volume when tumors move during irradiation. In our study the maximal observed difference was even higher, up to 35%. Many of the previous results on this topic [Citation12,Citation13,Citation15–17,Citation20,Citation21,Citation25,Citation33,Citation34] are based upon phantom measurements only or theoretical simulations that have not been affirmed with measurements. The experimental evaluation of the theoretical simulation model used in this study strengthens the obtained results compared to other studies where the simulation models have not been affirmed with measurements. Furthermore, the evaluation of the model has been done in a tissue equivalent lung tumor which was located within a thorax phantom that resembles the human body, instead of cubical or cylindrical phantoms that are commonly used for QA of modulated treatment plans.
The magnitude of the dosimetric effect of tumor motion did not correlate with the magnitude of the tumor motion amplitude or the complexity of the treatment technique, i.e., EAM score, for any of the evaluated parameters (D98%, D2%, Dmean, Maxdiff). On several occasions, the observed differences for the more complex treatment plans (i.e., VMAT-plans with higher EAM) were smaller than for a less complex plan (i.e., CA). On the other hand, if the tumors were evaluated as two different groups, one with smaller tumor motions (<15 mm) and one with larger tumor motions (>15 mm) as in , the maximum deviations in D98%, D2%, Dmean and Maxdiff all increased for tumors moving >15 mm compared to tumors moving <15 mm. This suggests that the respiratory-induced dosimetric effect in the GTV is individual for each specific case, but the risk of larger dosimetric effects increases for larger tumor motions. For the cases included in this study, differences in Maxdiff were <8.9% in all cases for tumor motions <15 mm. Patients with tumor motions >15 mm treated using the CA technique resulted in maximum dose differences ≤11.6%. If a more complex technique like VMAT was used, the observed dose differences were up to 35.2%. This suggests that the complexity of the treatment plan might have larger impact for larger tumor motions. For patients with large tumor motions it might therefore be advisable to evaluate the potential dosimetric effect beforehand, for example with an approach as the one used in this study. If an individual evaluation of the motion effects is not possible and if the tumor motion during treatment cannot be restricted, it might be preferable to use a treatment technique with low complexity, such as CA, to minimize the magnitude of the potential motion effect on the delivered dose. However, it is important to stress that regardless of treatment technique and tumor motion amplitude, all treatment deliveries were susceptible to respiratory-induced motion effects with associated risks of under- or overdosages within the treatment volume.
In this study, the respiratory-induced motion effects have only been studied for one starting point of the beam delivery in relation to the breathing cycle for each patient. Different starting points might affect the interplay between the tumor motion and the VMAT delivery and thereby the delivered dose to the tumor differently. In order to fully characterize the dosimetric effects, simulations with alternate cycle times and starting positions of the beam delivery are needed. Furthermore, there are uncertainties in the tumor trajectory that may influence the results in real patients. In this study we have only used the tumor trajectory as it was observed in the collected 4DCT for each patient and assumed that the tumor moves like that during the entire fraction. In reality this is not the case. Seppenwoolde et al. [Citation35] showed that the tumor trajectory can be highly irregular during multiple breaths and even exhibit hysteresis. Variable tumor trajectories during a fraction may affect the delivered dose. The results from this study are therefore limited and represent a selection of possible scenarios. However, by having selected tumors with different sizes and motion amplitudes, and using different treatment techniques, the observed dose differences in this study represent a reasonable overview of the possible motion-induced effects that may be encountered when treating lung tumors with SBRT.
Conclusions
A simulation model that could simulate respiratory-induced motion effects on the delivered dose within 0.7 p. p. from ionization chamber measurements in the center of a moving lung tumor was developed and evaluated. Theoretical simulations performed with this model showed that the dosimetric effects of respiratory motion during SBRT of lung tumors were patient and plan specific, but the incidence of dosimetric effects >10% of the prescribed dose occurred more frequently for tumor motion amplitudes >15 mm. For tumors moving >15 mm the maximum observed deviation was smaller with CA than with VMAT. However, the magnitude of the dosimetric effects could not be assessed solely based upon the tumor motion and/or the complexity of the treatment technique that was used for treatment delivery.
Supplemental Material
Download MS Word (37.2 KB)Disclosure statement
The authors report there are no competing interests to declare
Data availability statement
The data that support the findings of this study are available from the corresponding author upon reasonable request.
Additional information
Funding
References
- Guckenberger M, Andratschke N, Alheit H, et al. Definition of stereotactic body radiotherapy - principles and practice for the treatment of stage I non-small cell lung cancer. Strahlenther Onkol. 2014;190(1):26–33.
- Fakiris AJ, McGarry RC, Yiannoutsos CT, et al. Stereotactic body radiation therapy for early-stage non-small-cell lung carcinoma: four-year results of a prospective phase II study. Int J Radiat Oncol Biol. Phys. 2009;75(3):677–682.
- De Ruysscher D, Faivre-Finn C, Moeller D, et al. European organization for research and treatment of cancer (EORTC) recommendations for planning and delivery of high-dose, high precision radiotherapy for lung cancer. Radiother Oncol. 2017;124(1):1–10.
- Zheng X, Schipper M, Kidwell K, et al. Survival outcome after stereotactic body radiation therapy and surgery for stage I non-small cell lung cancer: a metaanalysis. Int J Radiat Oncol Biol Phys. 2014;90(3):603–611.
- Chang JY, Senan S, Paul MA, et al. Stereotactic ablative radiotherapy versus lobectomy for operable stage I non-small-cell lung cancer: a pooled analysis of two randomised trials. Lancet Oncol. 2015;16(6):630–637.
- Gomez DR, Blumenschein GR, Jr Lee JJ, et al. Local consolidative therapy versus maintenance therapy or observation for patients with oligometastatic non-small-cell lung cancer without progression after first-line systemic therapy: a multicentre, randomised, controlled, phase 2 study. Lancet Oncol. 2016;17(12):1672–1682.
- Nyman J, Hallqvist A, Lund JÅ, et al. SPACE – a randomized study of SBRT vs conventional fractionated radiotherapy in medically inoperable stage I NSCLC. Radiother Oncol. 2016;121(1):1–83.
- Baumann P, Nyman J, Hoyer M, et al. Outcome in a prospective phase II trial of medically inoperable stage I non–small-cell lung cancer patients treated with stereotactic body radiotherapy. J Clin Oncol. 2009;27(20):3290–3296.
- Vansteenkiste J, Ruysscher DD, Eberhardt WEE, et al. Early and locally advanced non-small-cell lung cancer (NSCLC): ESMO clinical practice guidelines for diagnosis, treatment and follow-up. Ann Oncol. 2013;24(suppl_6):vi89–vi98.
- Lindberg K, Grozman V, Karlsson K, et al. The HILUS-Trial—a prospective nordic multicenter phase 2 study of ultracentral lung tumors treated with stereotactic body radiotherapy. J Thorac Oncol. 2021;16(7):1200–1210.
- Court L, Wagar M, Berbeco R, et al. Evaluation of the interplay effect when using RapidArc to treat targets moving in the craniocaudal or right‐left direction. Med Phys. 2009;37(1):4–11.
- Li X, Yang Y, Li T, et al. Dosimetric effect of respiratory motion on volumetric‐modulated arc therapy‐based lung SBRT treatment delivered by TrueBeam machine with flattening filter‐free beam. J Appl Clin Med Phys. 2013;14(6):4370–4204.
- Ong C, Dahele M, Slotman BJ, et al. Dosimetric impact of the interplay effect during stereotactic lung radiation therapy delivery using flattening filter-free beams and volumetric modulated arc therapy. Int J Radiat Oncol Biol Phys. 2013;86(4):743–748.
- Ceberg S, Ceberg C, Falk M, et al. Evaluation of breathing interplay effects during VMAT by using 3D gel measurements. in Journal of Physics: Conference Series. 2013. IOP Publishing.
- Rao M, Wu J, Cao D, et al. Dosimetric impact of breathing motion in lung stereotactic body radiotherapy treatment using image-modulated radiotherapy and volumetric modulated arc therapy. Int J Radiat Oncol Biol Phys. 2012;83(2):e251–e256.
- Schmidt ML, Hoffmann L, Kandi M, et al. Dosimetric impact of respiratory motion, interfraction baseline shifts, and anatomical changes in radiotherapy of non-small cell lung cancer. Acta Oncol. 2013;52(7):1490–1496.
- Ong C, Verbakel WFAR, Cuijpers JP, et al. Dosimetric impact of interplay effect on RapidArc lung stereotactic treatment delivery. Int J Radiat Oncol Biol Phys. 2011;79(1):305–311.
- Keall PJ, Mageras GS, Balter JM, et al. The management of respiratory motion in radiation oncology report of AAPM task group 76 a. Med Phys. 2006;33(10):3874–3900.
- Sarudis S, Karlsson Hauer A, Nyman J, et al. Systematic evaluation of lung tumor motion using four-dimensional computed tomography. Acta Oncol. 2017;56(4):525–530.
- Duan J, Shen S, Fiveash JB, et al. Dosimetric and radiobiological impact of dose fractionation on respiratory motion induced IMRT delivery errors: a volumetric dose measurement study. Med Phys. 2006;33(5):1380–1387.
- Schaefer M, Münter MW, Thilmann C, et al. Influence of intra-fractional breathing movement in step-and-shoot IMRT. Phys Med Biol. 2004;49(12):N175–N179.
- Seco J, Sharp GC, Turcotte J, et al. Effects of organ motion on IMRT treatments with segments of few monitor units. Med Phys. 2007;34(3):923–934.
- Edvardsson A, Nordström F, Ceberg C, et al. Motion induced interplay effects for VMAT radiotherapy. Phys Med Biol. 2018;63(8):085012.
- Archibald‐Heeren BR, Byrne MV, Hu Y, et al. Robust optimization of VMAT for lung cancer: dosimetric implications of motion compensation techniques. J Appl Clin Med Phys. 2017;18(5):104–116.
- Gauer T, Sothmann T, Blanck O, et al. Under-reported dosimetry errors due to interplay effects during VMAT dose delivery in extreme hypofractionated stereotactic radiotherapy. Strahlenther Onkol. 2018;194(6):570–579.
- Ogrinc G, Davies L, Goodman D, et al. SQUIRE 2.0 (standards for quality improvement reporting excellence): revised publication guidelines from a detailed consensus process. BMJ Qual Saf. 2016;25(12):986–992.
- Weistrand O, Svensson S. The ANACONDA algorithm for deformable image registration in radiotherapy. Med Phys. 2015;42(1):40–53.
- Kadoya N, Nakajima Y, Saito M, et al. Multi-institutional validation study of commercially available deformable image registration software for thoracic images. Int J Radiat Oncol Biol Phys. 2016;96(2):422–431.
- Götstedt J, Karlsson Hauer A, Bäck A. Development and evaluation of aperture-based complexity metrics using film and EPID measurements of static MLC openings. Med Phys. 2015;42(7):3911–3921.
- Götstedt J, Bäck A. Edge area metric complexity scoring of volumetric modulated arc therapy plans. Phys Imaging Radiat Oncol. 2021;17:124–129.
- Guckenberger M, Belka C, Bezjak A, et al. Practice recommendations for lung cancer radiotherapy during the COVID-19 pandemic: an ESTRO-ASTRO consensus statement. Radiother Oncol. 2020;146:223–229.
- Ng SSW, Ning MS, Lee P, et al. Single-Fraction stereotactic body radiation therapy: a paradigm during the coronavirus disease 2019 (COVID-19) pandemic and beyond? Adv Radiat Oncol. 2020;5(4):761–773.
- Riley C, Yang Y, Li T. Dosimetric evaluation of the interplay effect in respiratory-gated RapidArc radiation therapy. Med Phys. 2014;41:11715.
- Ehrbar S, Lang S, Stieb S, et al. Three-dimensional versus four-dimensional dose calculation for volumetric modulated arc therapy of hypofractionated treatments. Z Med Phys. 2016;26(1):45–53.
- Seppenwoolde Y, Shirato H, Kitamura K, et al. Precise and real-time measurement of 3D tumor motion in lung due to breathing and heartbeat, measured during radiotherapy. Int J Radiat Oncol Biol Phys. 2002;53(4):822–834.