
Abstract
Background
To evaluate the change in parotid glands at mid-treatment during IMRT and the association between radiation dose to the parotid gland stem cell (PGSC) region and patient-reported xerostomia for patients with head and neck cancer (HNC).
Material and Methods
Patients who were treated from 2006–2012 at our institution with patient-reported xerostomia outcomes available at least 9 months following RT were included. PG and PGSC regions were delineated and the dose was estimated from the treatment plan dose distribution, using contours from pre- and mid-treatment CT scans. The association between radiation dose and volumetric changes was assessed using linear regression. Univariable logistic regression, logistic dose-response curves, and receiver operating characteristics (ROC) were used to examine the relationship between radiation dose and patient-reported xerostomia.
Results
Sixty-three patients were included, most treated with 70 Gy in 33 fractions; 34 patients had mid-treatment CT scans. Both contralateral and ipsilateral PGs had considerable volume reduction from baseline to mid-treatment (25% and 27%, respectively, both p < .001), significantly associated with mean PG dose (−0.44%/Gy, p = .008 and −0.54%/Gy, p < .001, respectively). There was a > 5 Gy difference in mean PG and PGSC dose for 8/34 patients at mid-treatment, with 6/8 (75%) reporting severe xerostomia. Xerostomia prediction based on whole PG or PGSC region dose showed similar performance (ROC AUC 0.754 and 0.749, respectively). The corresponding dose-response models also predicted similar risk of patient-reported xerostomia with mean dose to the contralateral PG (32.5%) or PGSC region (31.4%) at the 20 Gy QUANTEC-recommended sparing level.
Conclusions
The radiation dose to the PGSC region did not show stronger association with patient-reported xerostomia compared to that of whole PG, possibly due to considerable anatomical changes identified at mid-treatment. This shift in the size and position of the PG warrants adaptive planning strategies to evaluate the true benefit of parotid stem cell sparing.
Background
Each year an estimated 500,000 new cases of head and neck cancer (HNC) are reported worldwide [Citation1,Citation2]. Treatment and management of tumours for these patients includes surgery, chemotherapy, and radiation therapy (RT). Intensity-modulated radiation therapy (IMRT) is used for the definitive treatment of HNC with RT because IMRT is able to deliver high doses to the target regions and spare surrounding normal tissue. While definitive RT is effective, with 2-year local control rates of about 80-85% [Citation3], it is associated with considerable risk of treatment complications impacting the patients’ quality of life (QoL) [Citation4]. One of the most detrimental long-term side effects for patients is the development of xerostomia (dry mouth). Approximately 40% of patients treated with IMRT will experience some degree of xerostomia, potentially leading to oral infections, impeded swallowing, impaired taste and speech, and oral discomfort [Citation5].
Current clinical guidelines aimed at reducing RT-induced xerostomia target sparing of the parotid gland (PG) because the PG is responsible for at least 50% of stimulated saliva production [Citation6]. The Quantitative Analysis of Normal Tissue Effects in the Clinic, QUANTEC, recommends at least one PG receive a mean dose of less than 20 Gy to protect against xerostomia, or that both glands receive less than 25 Gy mean dose [Citation7].
Recently there has been growing interest in sparing the region of the PG containing the stem cell compartment, as an approach to better tailor the dose distribution aimed at sparing this smaller volume and thereby further reducing the risk of xerostomia. This was originally conceptualised using pre-clinical models by a group at the University Medical Centre Groningen in the Netherlands [Citation8]. This group identified the parotid gland stem cell (PGSC) region, located next to the dorsal edge of the mandible at the anterior border of Stensen’s duct, and determined that salivary function could be rescued if this area was sufficiently spared from radiation. Critically, such a strategy would depend on proper image-guidance and low geometric and anatomical variation in order to spare dose to such a small region. Of note, the results from a recent clinical trial of PGSC-sparing IMRT did not show reduction in xerostomia 12-months post-RT compared to conventional PG-sparing IMRT [Citation9].
At our institution, most patients undergoing definitive IMRT for head and neck cancer receive mid-treatment computed tomography (CT) scans as part of an adaptive treatment evaluation and adaptation workflow. In this study, we sought to determine the impact of volumetric changes to the PG seen at mid-treatment in terms of the association between radiation dose to the PGSC region and long-term patient-reported xerostomia in a retrospective cohort of patients with HNC.
Material and methods
Patient selection and data collection
In this retrospective Institutional Review Board approved study, we included all patients who received definitive IMRT for HNC at our institution between 2006 and 2012 and who had filled out the European Organisation for Research and Treatment of Cancer (EORTC) head-and-neck module (QLQ-H&N35) questionnaire offered to them as part of treatment follow-up. All patients were treated on either Truebeam or Clinac linear accelerator (Varian Medical Systems). In order to evaluate long-term xerostomia status, patients were included in this study if questionnaire results were available at minimum 9 months following treatment. Here we only evaluated the item from the questionnaire asking “Have you had a dry mouth?” with answers given on a Likert scale ranging from 1 to 4.
Stem cell region segmentation and data processing
The SC region of the PG, defined as being located next to the dorsal edge of the mandible near the Stensen’s duct at the anterior border, was delineated on pre-treatment and mid-treatment CT scans along with the whole parotid glands. Because the PGSC region represents a very small area about 5 mm in diameter, we also applied a planning-risk-volume (PRV) isotropic expansion of 5 mm around this contour, excluding bone and only allowing the contour to expand 2 mm beyond the whole PG. Following the contour segmentation, the 3D dose distribution from the patients’ treatment plan, which was generated on Eclipse v 15.6 treatment planning system (Varian Medical Systems), was assessed both on the pre-treatment CT and mid-treatment CT. Dose-volume histograms for whole PG, PGSC region, and PGSC PRV region were computed. The CT scans, structure sets, and dose data were anonymized and exported to MATLAB (Mathworks Inc., Natick, MA) for data analysis using the Computational Environment for Radiotherapy Research (CERR) format [Citation10]. The doses were converted into equivalent total doses in 2 Gy fractions (EQD2), with an alpha/beta value of 3 Gy, to facilitate comparable assessment between patients. For patients with available mid-treatment scans, the delivered dose at time of mid-treatment CT scan was estimated.
Data and statistical analyses
We calculated the PG volumes from the pre-treatment and mid-treatment CT contours to assess the change in gland volume and any association with parotid dose using linear regression. For the QoL outcomes, patients were categorised as having severe dry mouth if they responded 3 or 4 to the dry mouth question on their latest follow-up questionnaire, and no severe dry mouth if they responded 1 or 2. Following this binary classification, the association between the mean dose to the contralateral PG (gland contralateral to the gross disease and thus receiving the lowest dose) or SC PRV region of the contralateral PG, and the risk of severe xerostomia was examined using logistic regression and receiver operating characteristics (ROC) curves. We also generated logistic dose-response models for patient-reported severe xerostomia as a function of mean dose to either the contralateral PG or the SC PRV region of the contralateral PG, using the formalism suggested by Bentzen and Tucker [Citation11]. All statistical analyses were performed using STATA v.14 (StataCorp, College station, TX, USA).
Results
The final study cohort consisted of 63 patients, of which 34 (54%) had an available mid-treatment CT scan. The median age at treatment was 62 years, ranging from 14 to 81 years, with a median follow-up time of 29 months (range: 9–83 months). The results from the QoL questionnaires on dry mouth are summarised in , with 24 patients (38%) reporting severe xerostomia (dry mouth score 3 or 4). The majority of patients were treated with 70 Gy in 33 fractions, and the median number of fractions delivered at the time of mid-treatment CT scan was 14 (range: 12–28 fractions).
Table 1. Patient characteristics, QoL questionnaire results and parotid gland volumes.
A total of 121 PGs were contoured on pre-treatment CT scans, with corresponding SC and SC PRV regions; 66 PGs and SC regions were contoured on mid-treatment CT scans. Patients who had surgical resection of one PG due to tumour involvement only had contours for the remaining gland. Contours for two example patients, with both pre- and mid-treatment CT scans, can be found in the supplementary materials (Figures S1 and S2).
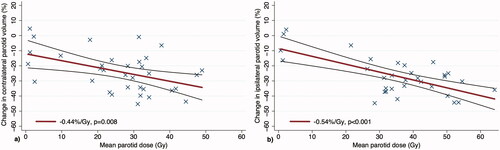
Analysis of PG changes during RT in the 34 patients with mid-treatment CTs showed a reduction in contralateral PG volume from an average 26.8 cm3 at baseline to 20.1 cm3 at mid-treatment (25% reduction, p < .001), and a reduction in ipsilateral PG volume from an average 27.7 cm3 at baseline to 20.2 cm3 at mid-treatment (27% reduction, p < .001). The change in PG volume was significantly associated with planned mean PG dose on linear regression analysis at −0.44%/Gy (p = .008) for the contralateral PGs and −0.54%/Gy (p < .001) for the ipsilateral PGs, while adjusting for baseline PG volume. shows the percent change in the contralateral and ipsilateral PG volume, respectively, as a function of mean dose to the corresponding PG.
Figure 1. Linear regression showing change in PG volume from baseline to mid-treatment as a function of the planned mean dose to the contralateral parotid gland (a) and ipsilateral parotid gland (b). The corresponding regression lines are shown with accompanying 95% confidence intervals.
The planned mean dose to the parotid glands is summarised in the supplementary materials (Table S1). We found that the average mean dose to the contralateral PG was significantly lower for patients who did not develop severe xerostomia (17.6 Gy) compared to patients with xerostomia (30.5 Gy), p < .001. Similarly, the mean dose to the contralateral PGSC PRV was lower for those who did not develop xerostomia (17.9 Gy vs. 32.1 Gy, p < .001). Conversely, the volume change of the contralateral PG at mid-treatment was not significantly associated with the risk of developing severe xerostomia (p = .28).
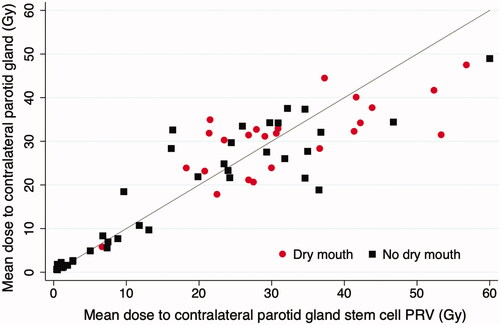
shows the distribution of mean doses to the contralateral PG or contralateral PGSC PRV for patients who reported severe xerostomia and those who did not. From this figure, it is evident that patients who received a mean dose of <20 Gy to the contralateral PG or to the contralateral PGSC PRV had a considerably lower risk of experiencing long-term xerostomia, supporting the QUANTEC recommendations.
Figure 2. Scatter plot comparing the mean dose to contralateral parotid vs. mean dose to contralateral parotid SC PRV, based on planned dose from pre-treatment CT. The red circles represent patients who reported severe dry mouth (QoL score 3 or 4), and the black squares represent patients who did not (QoL score 1 or 2).
Similarly, when the dry mouth QoL scores are depicted as a function of mean dose to the contralateral parotid or the contralateral PGSC PRV region, there is a general trend towards worse QoL scores with increasing mean dose to the PG or PGSC PRV (supplementary Figures S3a and S3b).
The anatomical and geometric changes during the course of IMRT resulted in an estimated increase in contralateral PG and contralateral SC PRV mean dose for mid- vs. pre-treatment contours of greater than 5 Gy for 8/34 patients (24%). Six of those eight patients (75%) reported having severe xerostomia. The largest change in estimated mean dose comparing pre- and mid-treatment contours was 8.9 Gy for the contralateral PG and 18.1 Gy for the contralateral parotid SC PRV.
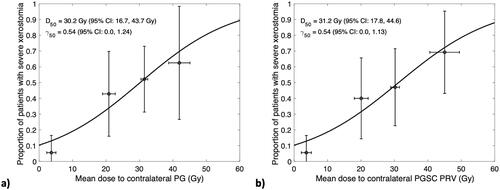
The logistic dose-response models assessing the risk of developing severe xerostomia as a function of mean dose to the contralateral PG or contralateral PGSC PRV region () showed a 50% risk of xerostomia (D50) from a mean dose to the contralateral PG of 30.2 Gy, and 31.2 Gy to the contralateral PGSC PRV. There was no difference in γ50 between the two models, indicating the same rate of increase in risk (0.54%) per 1% increase in mean dose. Of note, at the QUANTEC recommendation level of 20 Gy mean dose to the contralateral PG, this model estimates a 32.5% risk of xerostomia, and for a mean dose of 20 Gy to the contralateral PGSC PRV the model estimates this risk would be 31.4%.
Figure 3. Logistic dose-response models estimating the risk of severe xerostomia as a function of mean dose to contralateral PG (a) and mean dose to the contralateral PGSC PRV (b), based on planned dose from pre-treatment CT. Patients were binned into four groups by mean dose: <10 Gy, 10–25 Gy, 25–35 Gy, and >35 Gy. Uncertainty bars represent 95% confidence intervals of xerostomia risk (vertical) and mean dose (horizontal) for each bin.
The results of the logistic regression models for severe dry mouth show similar associations with mean dose to the contralateral PG and PGSC PRV, both based on dose estimated from the pre-treatment CT. This also holds for mean dose received by these contralateral regions at the time of mid-treatment CT, and for summed dose estimated as planned dose on pre-treatment scan for number of fractions until mid-treatment CT, followed by the dose estimated from mid-treatment CT for the remaining fractions, as shown in . All models showed a significant association between mean dose to the PG or PGSC PRV region and patient-reported xerostomia. Using the dose delivered at mid-treatment as an intermediate assessment showed a higher odds ratio per Gy compared to using the planned dose from pre-treatment contours and summed dose from both pre- and mid-treatment contours, but was limited by a smaller sample size (n = 34). The odds ratio per Gy of mean dose delivered by mid-treatment also showed a stronger association for the PGSC PRV compared to the whole PG (p = .012 vs. p = .050). A corresponding analysis using only the patients with both PG intact can be found in supplementary Table S2. The ROC curves illustrate the performance of classifying patient-reported xerostomia by mean dose to PG and PGSC PRV based on pre-treatment doses (supplementary Figure S4). It is again seen that the dose to whole PG and PGSC PRV show very similar performance in predicting xerostomia.
Table 2. Univariable logistic regression models of patient-reported severe xerostomia.
Discussion
This study found that the mean dose to the contralateral PG or the contralateral PGSC region was associated with patient-reported xerostomia, with very similar predictive performance. In our analysis, we found considerable PG volume changes at mid-treatment, of up to 40-50% for some patients. We further showed that this is associated with large variation in the estimated mean dose to these critical structures with 8/34 patients having a greater than 5 Gy increase in dose at mid-treatment, and 75% of those patients reporting severe xerostomia. We hypothesise that this could be a key factor as to why recent clinical trial results have failed to show reduced rates of xerostomia for PGSC-sparing IMRT compared to conventional treatment [Citation9]. Our hypothesis is further supported by another recent study showing that xerostomia prediction is strongly dependent on accounting for anatomical variation throughout the radiation treatment course [Citation12]. Taken together this indicates a need for adaptive therapy approaches with evaluations of PG and PGSC size and positioning throughout the course of IMRT, if PG stem cell sparing is to be successfully implemented.
Despite the variations in PG volume and estimated dose between pre- and mid-treatment in this study, our results still agreed with the dose constraints for PG sparing from the QUANTEC recommendations of mean dose of <20 Gy to the contralateral PG. The clinical data used to determine those recommendations were likely subject to similar anatomical and geometrical variations as in our study, and perhaps parotid-sparing recommendations could be even further improved with adaptive re-planning and better control of the delivered PG dose. Discussions on how to limit the risk of long-term xerostomia for HNC patients are centred around either dose de-escalation for patients with HPV-associated disease and thus better prognosis, or sparing of the PG or its stem cell region as in this analysis. Other than the QUANTEC recommendations, there is a set of guidelines published by Ortholan et al., who recommend that for complete recovery of saliva production after 24 months, the volume of contralateral PG receiving >40 Gy should be less than one-third of the total PG volume [Citation13]. A study by Moiseenko’s group comparing the two recommendations reported that QUANTEC recommendations effectively avoid xerostomia, and that they are slightly more effective than Ortholan’s recommendations [Citation14]. At the QUANTEC recommendations of 20 Gy mean dose, the logistic-dose response models developed in our study predicted comparable risk of developing xerostomia when evaluated based on contralateral PG (32.5% risk) or contralateral PGSC region (31.4% risk). The risk predicted from our models was almost twice as high the risk predicted in Moiseenko’s study at the 20 Gy dose level. There could be several reasons for this, but an important difference is the use of salivary flow rate measurements compared to patient-reported xerostomia as endpoints, where the two endpoints have been shown to not correlate well [Citation15]. This highlights the importance of including patient-reported outcomes in the clinical decision-making for HNC patients.
The logistic regression models for patient-reported xerostomia developed in our study showed a significant association with mean dose to contralateral PG or mean dose to contralateral PGSC, both using the planned dose from pre-treatment CT scans and the dose delivered by the time of mid-treatment CT scan. The association at mid-treatment was not as strong but was limited by a smaller sample size and did show slightly higher odds ratios per Gy compared to pre-treatment (cf. ). The use of mid-treatment CT scans to inform clinician decisions for adapting and optimising treatment planning to avoid potentially high-risk areas such as the stem cell region of the PG is encouraging, although new treatment modalities with daily CT imaging capabilities might be able to provide more granular information.
There are several limitations to our study. We did not have records of baseline xerostomia available for the majority of patients and it was therefore not accounted for in the modelling, which was shown in previous studies to be a prognostic factor for patient-reported xerostomia [Citation16,Citation17]. Moreover, the time of patient-reported xerostomia outcomes ranged widely across the cohort. This heterogeneity in questionnaire response times could skew the analysis since the patients were not all evaluated at similar time points. The sensitivity analysis using only those patients with questionnaire response times ranging from 9–36 months showed similar association between dose to the PG or PGSC PRV region and as such the time of evaluation did not appear to considerably affect our results (Table S3). This analysis is, however, limited by a smaller sample size and a larger cohort with more precise cut-off for follow-up time could further improve the association in the models.
This study is also based on a relatively small sample size, particularly for the sub-group of patients with mid-treatment CT scans. In spite of the limited number of patients, this study was significantly powered to find that the dose to both whole PG and PGSC region was similarly associated with patient-reported xerostomia. Furthermore, the results from our logistic regression analyses suggest a strong association between dose delivered to the PG and PGSC region by time of mid-treatment scan and xerostomia risk, warranting further research with a larger patient cohort to validate these findings.
Supplemental Material
Download MS Word (4.5 MB)Disclosure statement
No potential conflict of interest was reported by the author(s).
Data availability statement
The datasets generated during and/or analysed during the current study can be made available from the corresponding author on reasonable request.
References
- Fitzmaurice C, Allen C, Barber RM, Global Burden of Disease Cancer Collaboration, et al. Global, regional, and national cancer incidence, mortality, years of life lost, years lived with disability, and Disability-Adjusted life-years for 32 cancer groups, 1990 to 2015: a systematic analysis for the global burden of disease study. JAMA Oncol. 2017;3(4):524–548.
- Jemal A, Bray F, Center MM, et al. Global cancer statistics. CA Cancer J Clin. 2011; 61(2):69–90.
- Kabarriti R, Brodin NP, Lundgren G, et al. Early response assessment on mid-treatment computed tomography predicts for locoregional recurrence in oropharyngeal cancer patients treated with definitive radiation therapy. Int J Radiat Oncol Biol Phys. 2018;102(4):1036–1045.
- Brodin NP, Kabarriti R, Pankuch M, et al. A quantitative clinical Decision-Support strategy identifying which patients with oropharyngeal head and neck cancer may benefit the most from proton radiation therapy. Int J Radiat Oncol Biol Phys. 2019;104(3):540–552.
- Vissink A, Mitchell JB, Baum BJ, et al. Clinical management of salivary gland hypofunction and xerostomia in head-and-neck cancer patients: successes and barriers. Int J Radiat Oncol Biol Phys. 2010;78(4):983–991.
- Iorgulescu G. Saliva between normal and pathological. Important factors in determining systemic and oral health. J Med Life. 2009; 2(3):303–307.
- Deasy JO, Moiseenko V, Marks L, et al. Radiotherapy dose-volume effects on salivary gland function. Int J Radiat Oncol Biol Phys. 2010;76(3):S58–S63.
- van Luijk P, Pringle S, Deasy JO, et al. Sparing the region of the salivary gland containing stem cells preserves saliva production after radiotherapy for head and neck cancer. Sci Transl Med. 2015; 67(305):305.
- Steenbakkers R, van Rijn-Dekker MI, Stokman MA, et al. Parotid gland stem cell sparing radiation therapy for patients with head and neck cancer: a Double-Blind randomized controlled trial. Int J Radiat Oncol Biol Phys. 2022;112(2):306–316.
- Deasy JO, Blanco AI, Clark VH. CERR: a computational environment for radiotherapy research. Med Phys. 2003;30(5):979–985.
- Bentzen SM, Tucker SL. Quantifying the position and steepness of radiation dose-response curves. Int J Radiat Biol. 1997;71(5):531–542.
- Astaburuaga R, Gabryś HS, Sánchez-Nieto B, et al. Incorporation of dosimetric gradients and parotid gland migration into xerostomia prediction. Front Oncol. 2019;9:697.
- Ortholan C, Chamorey E, Benezery K, et al. Modeling of salivary production recovery after radiotherapy using mixed models: determination of optimal dose constraint for IMRT planning and construction of convenient tools to predict salivary function. Int J Radiat Oncol Biol Phys. 2009;73(1):178–186.
- Moiseenko V, Wu J, Hovan A, et al. Treatment planning constraints to avoid xerostomia in head-and-neck radiotherapy: an independent test of QUANTEC criteria using a prospectively collected dataset. Int J Radiat Oncol Biol Phys. 2012;82(3):1108–1114.
- Meirovitz A, Murdoch-Kinch CA, Schipper M, et al. Grading xerostomia by physicians or by patients after intensity-modulated radiotherapy of head-and-neck cancer. Int J Radiat Oncol Biol Phys. 2006;66(2):445–453.
- Beetz I, Steenbakkers RJ, Chouvalova O, et al. The QUANTEC criteria for parotid gland dose and their efficacy to prevent moderate to severe patient-rated xerostomia. Acta Oncol. 2014; May53(5):597–604.
- Beetz I, Schilstra C, van der Schaaf A, et al. NTCP models for patient-rated xerostomia and sticky saliva after treatment with intensity modulated radiotherapy for head and neck cancer: the role of dosimetric and clinical factors. Radiother Oncol. 2012;105(1):101–106.