
Abstract
Background
Evaluation of regional variation of prostate cancer (PCa) incidence and PCa-specific mortality is essential in the assessment of equity in a national healthcare system. We evaluated PCa incidence and PCa-specific mortality between different municipalities and hospital districts in Finland over 1985–2019.
Material and Methods
Men diagnosed with PCa in Finland from 1985 through 2019 were retrieved from Finnish Cancer Registry. Age-standardized PCa incidence and mortality rates were estimated by municipality and hospital district as well as municipality urbanization, education, and income level using hierarchical Bayesian modeling. Standard deviations (SD) of the regional rates were compared between periods from 1985–1989 to 2015–2019.
Results
We identified 123,185 men diagnosed with any stage PCa between 1985 and 2019. SD of PCa incidence rate (per 100,000 person-years) showed that the total variation of PCa incidence between different municipalities was substantial and varied over time: from 22.2 (95% CI, 17.1–27.8) in 1985–1989 to 56.5 (95% CI, 49.8–64.5) in 2000–2004. The SD of PCa mortality rate between all municipalities was from 9.0 (95% CI, 6.6–11.8) in 2005–2009 to 2.4 (95% CI, 0.9–4.8) in 2015–2019. There was a trend toward a lower PCa-specific mortality rate in municipalities with higher education level.
Discussion
Regional variation in the incidence rate of PCa became more evident after initiation of PSA testing in Finland, which indicates that early diagnostic practice (PSA testing) of PCa has been different in different parts of the country. Variation in the national PCa mortality rate was indeed recognizable, however, this variation diminished at the same time as the mortality rate declined in Finland. It seems that after the initiation period of PSA testing, PSA has equalized PCa mortality outcomes in Finland.
Introduction
Worldwide, prostate cancer (PCa) is the second most diagnosed invasive cancer and the fifth leading cause of cancer deaths in men [Citation1]. Older age, race, and family history of the disease are the only well-established risk factors for PCa [Citation2]. The incidence of PCa has increased in the western countries, including Scandinavia, starting before the era of PSA testing [Citation3]. In Finland, continuously increasing incidences of PCa were seen from 1953 to the early 1990s [Citation4]. Since the early 1990s at the onset of PSA testing, the incidence of PCa increased rapidly reaching its maximum at around 2005 and thereafter leveling off [Citation4]. The PCa mortality rates also increased steadily until 1995, after which the mortality rate has declined about 40% [Citation5].
The Finnish healthcare system is highly decentralized as the provision of health services is the responsibility of municipalities [Citation6]. Municipalities organize primary care as obligated by the primary Health Care Act of 1972. Specialized care is provided by 20 hospital districts, funded by their member municipalities, and an autonomous region of Åland. Each hospital district runs a central hospital, and some also affiliated community hospitals. Five hospital districts are university hospitals, which provide highly specialized care also for non-university central hospital districts. The country is divided into five university hospital districts as every other hospital district in Finland is part of five specific university hospital catchment areas, however, Åland islands is not a true member of any university hospital region. Organized PSA screening as part of in The Finnish Prostate Cancer Screening trial, [Citation7] was started in Tampere and Helsinki metropolitan area in 1996, when PSA testing was uncommon even in these largest urban areas of Finland [Citation8]. In the following 12 years, opportunistic PSA screening became common in Finland [Citation8]. In this European largest PCa screening trial only 1.4% (0.7% in the control arm and 0.7% in the intervention arm) of men had PSA test before the trial, while by the first 4, 8, and 12 years of follow-up 18.1%, 47.7%, and 62.7% of men in the control arm had undergone PSA testing at least once and in the screening arm the proportions were 69.8%, 81.1%, and 85.2%, respectively [Citation8]. PSA testing is available to Finnish citizens in public healthcare centers, but especially in recent decades more in occupational healthcare units. Finnish occupational health service has two simultaneous roles: mandatory preventive functions and voluntary primary care (curative) functions, both arranged by the same service provider. Occupational health service primary care is a parallel service to public and private care and employed patients can use all sectors [Citation6]. Furthermore, as PSA screening is not endorsed in national PCa guidelines [Citation9], probably most of the opportunistic PSA screening happens in private healthcare services. For reference in Finland in 2012, ∼25% of primary healthcare contacts were provided by the private sector [Citation10]. However, it is difficult to find data about PSA testing in the private healthcare sector [Citation8]. Moreover, the variation of ad-hoc PSA screening between different regions of the country is not known. It has been proposed that the population residing in urban areas were/are screened more actively and receive more often curative treatments for PCa [Citation11].
Recently, Seppä et al. reported that there is a markable variation in PCa survival between hospital districts, probably caused by differences in the early diagnosis of PCa [Citation12]. However, the total variation of relative survival was smaller in cervical cancer and in breast cancer than it was with PCa [Citation12]. Of note, both cancers are under organized cancer screening in Finland, cervical cancer from the early 1960s, and breast cancer from the late 1980s [Citation13]. This study aimed to investigate the possible regional variation, impact of urbanization, municipality education level and municipality income level in the association of PCa incidence, PCa-specific mortality, and to compare trends of variation between 5-year time periods from 1985 through 2019.
Material and methods
The nationwide population-based Finnish Cancer Registry collects information on the annual incidence of cancer from hospitals, outpatient clinics, and healthcare facilities and separately from histopathological laboratories in Finland. The registry has an estimated coverage of 99% for male genital cancers [Citation14]. The PCa stage classification data for all PCa cases covered by the Finnish cancer registry were retrieved in the current study. The Finnish Cancer Registry data can be linked with the population register center database for date of death or emigration and causes of death and education levels from Statistics Finland. The linkage was done with a personal social security number. We identified all patients diagnosed with PCa from 1 January 1985 until 31 December 2019 from Finnish Cancer Registry. This data was linked to cause of death data from Statistics Finland to obtain information on deaths caused by PCa. PCa incidence and mortality were analyzed between 311 municipalities and 21 hospital districts (including Åland) that existed in Finland in 2019. Patient’s municipality was based on the place of residence at the beginning of the year of cancer diagnosis and of death in incidence and mortality, respectively.
The incidence of PCa and PCa-specific mortality were also analyzed by the urbanization level (rural–semi-urban–urban) of the municipalities that was defined according to the proportion of people living in urban settlements and the population of the largest urban settlement [Citation15]. The association of education level and income level of municipalities to PCa incidence and mortality was also assessed by dividing municipalities into three categories based on the proportion of population with basic education and the median of household’s disposable money income per consumption unit, respectively, such that the population count in each category is close to one third of the total population. The municipalities were categorized according to their characteristics in 2019.
The study protocol was approved by the institutional review board of the Hospital District of Southwest Finland. The National Institute for Health and Welfare (Finland) approved access to the registry data (Study number THL/1340/5.05.00/2019). Statistics Finland approved access to the data on the cause of death (study number TK-53-86-17).
Statistical analysis
Age-specific PCa incidence and mortality rates in the population of Finland were modeled by using a Bayesian hierarchical Poisson regression. The rates were allowed to vary between districts (20 hospital districts and Åland) and between municipalities. Variation between hospital districts was modeled by a normal distribution and variation between municipalities by a BYM (Besag, York, and Mollié) model, which includes both spatially structured effects and unstructured normally distributed effects [Citation16]. Based on the model, we estimated age-standardized PCa incidence and mortality rates for each district and municipality where the age structure of male population in Finland in 2015–2019 was used as a standard. In addition, we report standard deviations (SD) of the regional rates to quantify the amount of variation (i) between and (ii) within districts and (iii) total variation between municipalities, and the proportion of variation within districts out of the total variation between municipalities. The SD was measured both on the absolute scale of age-standardized rates and on the relative (logarithmic) scale where the latter is used to compare variation between periods or between incidence and mortality, when the absolute level of rate differs. We also fitted alternative models, which also included multiplicative effects of the level of urbanization, income, and education of municipalities, and report their age adjusted rate ratios and the SD of the regional rates adjusted for both age structure the municipality characteristics. The models were fitted separately in 5-years periods from 1985–1989 to 2015–2019. The Bayesian inference was performed by using the R package R-INLA (ver. 21.02.23) that uses the efficient INLA (integrated nested Laplace approximation) approach in the posterior estimation [Citation16]. The details of the statistical analysis are described in the Supplementary appendix.
Results
The number of newly diagnosed PCa cases increased by fourfold from 1985–1989 (N = 6415) to 2015–2019 (N = 25,886), while over the same period the number of PCa deaths increased by 1.7-fold in Finland (). Most of the PCa cases (N = 77,292) and PCa deaths (N = 15,531) were encountered in urban regions over the study period (). The PCa incidence rate was higher in municipalities with the highest education tertile (191.7 per 100,000 pyrs) compared to middle (190.0 per 100,000 pyrs) and lowest tertile (179.7 per 100,000 pyrs), respectively. The PCa-specific mortality rate was somewhat higher in the lowest education level tertile municipalities compared to middle and highest tertile. The high municipality income level was associated with higher incidence ().
Table 1. Average population count, number (N) of PCa cases and deaths and age-standardized incidence and mortality rate by calendar period, university hospital region and municipality urbanization, education, and income level.
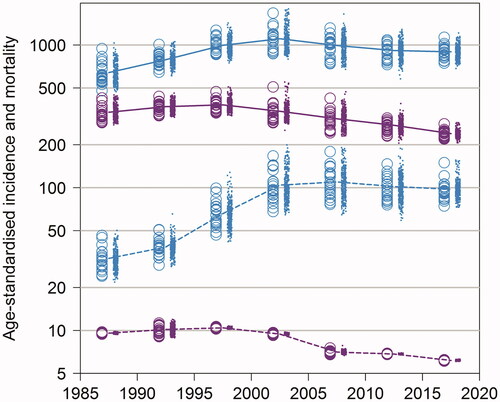
The age-standardized incidence of PCa increased to its peak in period 2000–2004 (231.0 cases per 100,000 person-years, ), where after this increase leveled off. Also, the geographical variation of age-standardized PCa incidence was substantial over the study period. On the other hand, the age-standardized PCa mortality has decreased by around 40% from 54.4 in 1995–1999 to 33.7 in 2015–2019, and the geographical variation has been small after 2010 in Finland. However, variation in PCa mortality between different hospital districts or municipalities was seen before that, from 1985 to 2010 (). The variation by age group (under or above 70 years) showed that the variation of the PCa-specific mortality has been very small among men <70 years of old in the PSA era, and the PCa mortality rate very low among these men ().
Figure 1. Age-standardized PCa incidence (blue) and mortality (violet) per 100,000 person-years in 5-years period from 1985–1989 to 2015–2019 by hospital district (circle) and municipality (dot).
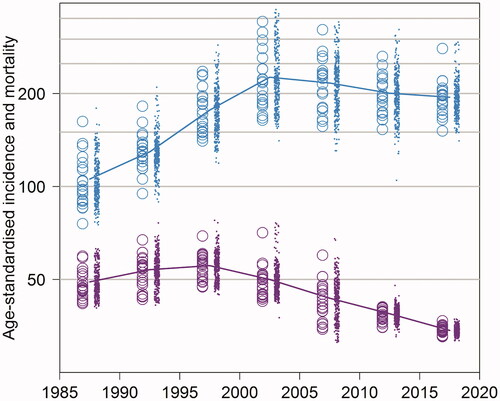
Figure 2. Age-standardized PCa incidence (blue) and mortality (violet) per 100,000 person-years in 5-years period from 1985–1989 to 2015–2019 by age group (0–69 years with dashed and 70+ years with solid line for the average rate), hospital district (circle), and municipality (dot).
The total variation of PCa incidence (per 100,000 person-years) between different municipalities was substantial and varied over time: from 22.2 (95% CI, 17.1–27.8) in 1985–1989 to 56.5 (95% CI, 49.8–64.5) in 2000–2004. The SD of PCa incidence between hospital districts was from 17.5 (95% CI, 12.3–24.2) in 1990–1994 to 50.3 (95% CI, 44.7–57.4) in 2000–2004, and within hospital districts from 12.9 (95% CI, 3.6–18.0) in 1985–1989 to 30.7 (95% CI, 25.7–35.9) in 1995–1999. The proportion of variation of PCa incidence (within/total) demonstrates that variation of PCa incidence was higher between than within hospital districts in 1985–1989; 2000–2004; 2005–2009; and in 2015–2019. Over the other calendar periods, the proportion was close to 0.5 indicating that the amount of variation between hospital districts was similar to that within hospital districts ().
Table 2. SD of age-standardized PCa incidence and mortality (per 100,000 person-years) between hospital districts (Between), within hospital districts (Within), and between all municipalities (Total) by calendar period.
In case of PCa mortality, the SD of PCa mortality (per 100,000 person-years) between all municipalities (total) was from 2.4 (95% CI, 0.9–4.8) in 2015–2019 to 9.0 (95% CI, 6.6–11.8) in 2005–2009. However, SDs of PCa mortality between and within hospital districts were rather similar, and according to the proportion of variation (within/total), there was no significant differences in the amount of variation between the two components ().
In the univariate model urban areas had a trend for higher PCa incidence between 1990–1994 [RR 1.13 (95% CI, 1.06–1.21); 1995–1999 [RR 1.09 (95% CI, 1.02–1.16)]; and in 2005–2009 [RR 1.05 (95% CI, 1.00–1.11)], compared to semi-urban and rural regions. In the PSA era 2005–2009 and 2010–2014 there was a trend for lower PCa specific mortality among men in the urban municipalities (). The PCa-specific mortality figures by municipality education level showed a clear trend for lower mortality in high education level municipalities compared to middle and low level municipalities in the PSA era from 2000 through 2019. Municipality income level was not associated with differences in PCa incidence, and the differences in mortality were sparse; men in high and middle [RR 1.12 (95% CI, 1.02–1.23) income level municipalities had higher mortality in 1985–1989 compared to low income level municipalities (). In the multivariate model, however, the only observed trend was a trend toward lower mortality among men in high education level municipalities in the PSA era; however, significant this was only in 2015–2019 ().
Table 3. Age adjusted rate ratios of level of municipality urbanization, education and income in PCa incidence, and mortality by calendar period.
The variance of the logarithm of PCa incidence and mortality showed that the total variation of PCa incidence on the logarithmic scale was highest in 2000–2004, and the variation in mortality highest in 2005–2009, which after the variance has been declined, more decline has been seen in mortality (Supplementary Table S1). The variance of the logarithm of PCa incidence and mortality between age groups of 0–69 years and over 70 years, showed markable variation in the PCa incidence among men under 70 years of age (Supplementary Table S2).
Periodic trends for the age-standardized incidence rate showed, that with high Bayesian posterior probability, larger incidence was seen in the northern part and in the south coast of Finland before the PSA era. The initiation of PSA testing in the early 1990s changed the geographical variation of PCa incidence rate quite radically in 1995–1999: the incidence rate increased rapidly in the Tampere University Hospital region (region E in Supplementary Figure S1) and in Helsinki metropolitan area (region A in Supplementary Figure S1) comparing to earlier periods. In the twenty first century, the incidence rate stayed high in the Tampere University Hospital district and increased to a high level in the Åland islands (region U in Supplementary Figure S1). While assessing the mortality rate from PCa over the study period 1985–2019, there is a trend for higher risk for PCa-specific mortality in the western parts of the country (Supplementary Figure S1).
Discussion
In this nationwide population-based analysis we showed that PCa incidence and PCa-specific mortality varied largely between different areas of Finland over the study period of more than 30 years. The total variation in PCa incidence rates between municipalities was highest during the years of the most rapidly increasing incidence rate of PCa (2000–2004) in Finland. While this incidence peak leveled off, also the variation, in terms of the SD of PCa incidence rate between municipalities declined. The population-based PSA screening trial in Tampere and Helsinki University Hospital districts increased the incidence of PCa between 1996 and 2004 [Citation7]. The periodic total variation of PCa-specific mortality between municipalities also differed between periods, and there was somewhat markable variance in PCa-specific mortality between different municipalities, as the total SD of incidence rate per 100,000 person-years was between 2.4 and 9.0. There was a trend toward higher incidence and lower PCa-specific mortality in urban municipalities of Finland and municipalities with higher education level. However, the income level of the municipality had little or no effect to PCa incidence and mortality.
Variation in PCa incidence and mortality identified by regional differences is important to try to explain the possible reasons behind the variation. Recently, Seppä et al. reported that there was a substantial variation in PCa survival between municipalities in 2007–2016, similarly also between and within hospital districts of Finland [Citation12]. Variation in PCa survival, however, might be related to differences in incidence rates explained by PSA screening. Earlier detection of localized PCa, in regions where PSA screening is more popular, can cause lead-time bias for survival estimates [Citation17]. In our current article, survival estimates were not assessed. It has been shown that the incidence of PCa in the PSA era is depended on the frequency of PSA testing [Citation18]. In our analysis, an increasing incidence of PCa was seen in metropolitan areas where an organized PCa screening trial was started in the late 1990s [Citation7]. In eastern Finland, where PSA screening was not that popular and the PCa incidence stayed low over 2000–2009. The decline in PCa mortality rate since 1995 was seen across university hospital regions [Citation5], which can depend on various factors: PSA screening was popularized around 1995 in Finland [Citation19], which may lead to lower PCa-specific mortality rates [Citation20]. There is also evidence that the decline in mortality rate could be artefactual. The relatively slow progression of PCa and peak incidence in the elderly population poses particular difficulties in the attribution of the cause of death [Citation21]. The drop in mortality may also be due to the positive effect of curative treatments for PCa [Citation22]. In some men with metastatic disease, hormonal therapy may lead to a true increase in time from diagnosis to death [Citation23].
Unfortunately, we have no data on differences in the detection rate of PCa in organized PSA screening, or cases detected by health checkups in Finland. Stattin et al. observed in Sweden an almost twofold difference in the incidence of PCa between counties and up to a 10-fold variation in the age-adjusted incidence of asymptomatic PCa detected at health checkups [Citation11]. Counties with a high total PCa incidence generally also had high incidences of non-palpable (category T1c) tumors diagnosed with random prostate biopsies and tumors detected at health checkups, as well as a high frequency of curative treatments [Citation11]. A higher incidence was mostly detected in urban regions and counties with university hospitals [Citation11]. We can assume that this trend for more ad–hoc PSA testing in urban areas especially with a university hospital might be true also in Finland before the variation of PCa incidence leveled off. Our data also indicated somewhat higher PCa incidence and lower PCa mortality in municipalities of higher education level. Earlier Finnish report stated that, between 1996 and 2005, 20%–25% of deaths from PCa could have been avoided if the impairing survival impact of shorter education was taken into account [Citation24]. The increased mortality is largely attributable to delayed diagnosis, suboptimal diagnostic workup, and less invasive treatments among these individuals [Citation25]. However, it should be noted that we did analyze only municipality level data on education and income levels, not individual level data.
In the pre-PSA era, from 1985 until 1994, higher PCa incidence, especially in the Bayesian posterior probability model, was seen in northern parts of Finland, in western parts of the Helsinki University Hospital region, and Åland islands. The reason for higher incidence, for instance in these regions is unknown. The peak in relative incidence rate leveled off quite rapidly in the northern part of Finland except in the Länsi-Pohja hospital district (region S in Supplementary Figure S1). Further studies explaining the difference in PCa incidence before the PSA era are needed from Finland.
Also, data has shown substantial genetic differences between the eastern and western parts of the country, especially in the male-mediated Y chromosome [Citation26]. Furthermore, Palo et al. also suggest substantial Scandinavian gene flow into south-western, but not into the eastern, Finland [Citation26]. And while men with Scandinavian gene flow might have higher risk for PCa mortality, whilst men in the eastern Finland die younger from cardiovascular causes [Citation27]. It has shown that even though PCa incidence has been very high in both Finland and Sweden, mortality rate from PCa is higher in Sweden [Citation28]. Genetic risk for higher PCa mortality may, thus, influence on higher PCa-specific mortality rate among Swedish speaking population in Finland, who are living mostly in the western and southern parts of the country.
Regional variation in PCa incidence was heterogeneous and not clearly dependent on hospital district, while variation between and within hospital districts did not show any clear trend. This may reflect to the health-care system in Finland, where protocols and decisions for PCa diagnostics and treatment are done in publicly reimbursed hospitals and the clinical practice in different hospitals is quite similar in different parts of the country. Variation in PSA testing, however, resulted in higher incidence of PCa in Tampere and Helsinki metropolitan areas after the initiation of PSA screening RCT [Citation29]. Our finding of increased variation of PCa incidence among Finnish men >70 years is probably explained by guideline recommendations, which do not recommend routine PSA testing on men over 70 years of age [Citation30]. Furthermore, when ad-hoc PSA testing became popular in Finland, it all started in larger metropolitans, while testing was uncommon in rural areas. According to our results, the regional policy and access to PSA testing, also outside clinical trials, probably explains differences in PCa incidence in the post-PSA era between hospital districts. Another explanation for the higher incidence might be a higher number of urologists in the southern and western parts of the country.
The total variation in PCa incidence was substantial over the region, while in PCa mortality the differences were smaller. Of these two, mortality is the one causing worries. Between 1985 and 2009 the SD in PCa-specific mortality between all municipalities in Finland was between 7 and 9 per 100,000 person-years. This would mean annually around 200 more deaths from PCa in Finland if mortality would be same in all municipalities as in the municipality with the highest mortality rate. However, the absolute risk for PCa mortality would increase only by around 1% [Citation31,Citation32].
Our study has several limitations. First, we do not have information on incidentally identified PCas and national information on PSA testing in Finland. Secondly, to assess variation in mortality from PCa, we should have better data on ad-hoc PSA testing, cancer treatments etc. For example, our data on cancer treatment is limited and may differ over time and between different hospital districts. Notwithstanding these limitations, this study contains several strengths. We have a nationwide population-based material including 99% of all PCas diagnosed in Finland between 1985 and 2019. We also have complete and accurate registration on cause of deaths and patient’s residency data from Statistics Finland and the Digital and Population Data Services Agency [Citation33], based on social security number system allowing for linkage between different sources. Also, there is practically no loss to follow-up.
Conclusions
In conclusion, regional variation in PCa incidence showed that it was somewhat higher in the western and southern Finland in the PSA testing era from 1995 on. Regional variation in PCa mortality was also seen but this variation diminished at the same time as the mortality rate declined. Our data indicates that after the initiation period of PSA testing in 1990s and early 2000s, as PSA became popular in Finland, PCa mortality outcomes have equalized throughout the country.
Supplemental Material
Download MS Word (24.9 KB)Supplemental Material
Download MS Word (19.5 KB)Supplemental Material
Download MS Word (3.9 MB)Disclosure statement
No potential conflict of interest was reported by the author(s).
Data availability statement
The data that support the findings of this study are available from the corresponding author, [HS], upon reasonable request.
Additional information
Funding
References
- Bray F, Ferlay J, Soerjomataram I, et al. Global cancer statistics 2018: GLOBOCAN estimates of incidence and mortality worldwide for 36 cancers in 185 countries. CA Cancer J Clin. 2018;68(6):394–424.
- Platz EA, Giovannucci E. Cancer epidemiology and prevention. Prostate cancer. New York, NY: Oxford University Press; 2006. p. 1128–1150.
- Hsing AW, Tsao L, Devesa SS. International trends and patterns of prostate cancer incidence and mortality. Int J Cancer. 2000;85(1):60–67.
- Age-standardised incidence rate of prostate cancer per 100,000 in Finland 1953–2019: Cancer society of Finland; Finnish Cancer Registry. 2021; [cited 2021 Aug 3]. Available from: https://cancerregistry.fi/statistics/cancer-statistics/.
- Age-standardised mortality rate of prostate cancer per 100,000 in Finland 1953–2019: Cancer society of Finland; Finnish Cancer Registry. 2021; [cited 2021 August 3]. Available from: https://cancerregistry.fi/statistics/cancer-statistics/.
- Keskimaki I, Tynkkynen LK, Reissell E, et al. Finland: health system review. Health Syst Transit. 2019;21(2):1–166.
- Mäkinen T, Tammela TL, Stenman UH, et al. Second round results of the finnish population-based prostate cancer screening trial. Clin Cancer Res. 2004;10(7):2231–2236.
- Kilpelainen TP, Pogodin-Hannolainen D, Kemppainen K, et al. Estimate of opportunistic prostate specific antigen testing in the finnish randomized study of screening for prostate cancer. J Urol. 2017;198(1):50–57.
- Aaltomaa S, Jousilahti P, Kataja V, et al. Eturauhassyövän Käypä hoito-suositus; [cited 2022 Jun 14]. Available from: http://www.kaypahoito.fi2014.
- StatisticsFinland; [cited 2022 Jun 8]. Available from: https://www.stat.fi/artikkelit/2014/art_2014-12-08_002.html?s=0.
- Stattin P, Johansson R, Lodnert R, et al. Geographical variation in incidence of prostate cancer in Sweden. Scand J Urol Nephrol. 2005;39(5):372–379.
- Seppä K, Malila N, Pitkäniemi J. Variation in cancer survival between hospital districts and within them in Finland. Acta Oncol. 2020;59(11):1316–1321.
- Finnish Cancer Registry. Cancer screening in Finland: Finnish Cancer Registry. 2022; [cited 2022 Jun 16]. Available from: https://cancerregistry.fi/screening/.
- Leinonen MK, Miettinen J, Heikkinen S, et al. Quality measures of the population-based finnish cancer registry indicate sound data quality for solid malignant tumours. Eur J Cancer. 2017;77:31–39.
- Statistics Finland. Statistical grouping of municipalities: Statistics Finland. 2022; [cited 2022 Jun 17]. Available from: https://www.stat.fi/meta/kas/til_kuntaryhmit_en.html.
- Seppä K, Rue H, Hakulinen T, et al. Estimating multilevel regional variation in excess mortality of cancer patients using integrated nested laplace approximation. Stat Med. 2019;38(5):778–791.
- Draisma G, Etzioni R, Tsodikov A, et al. Lead time and overdiagnosis in prostate-specific antigen screening: importance of methods and context. J Natl Cancer Inst. 2009;101(6):374–383.
- Wah W, Ahern S, Evans S, et al. Geospatial and temporal variation of prostate cancer incidence. Public Health. 2021;190:7–15.
- Seikkula HA, Kaipia AJ, Rantanen ME, et al. Stage-specific mortality and survival trends of prostate cancer patients in Finland before and after introduction of PSA. Acta Oncol. 2017;56(7):971–977.
- Hugosson J, Roobol MJ, Månsson M, et al. A 16-yr follow-up of the european randomized study of screening for prostate cancer. Eur Urol. 2019;76(1):43–51.
- Oliver SE, May MT, Gunnell D. International trends in prostate-cancer mortality in the ’PSA ERA’. Int J Cancer. 2001;92(6):893–898.
- Wilt TJ, Ullman KE, Linskens EJ, et al. Therapies for clinically localized prostate cancer: a comparative effectiveness review. J Urol. 2021;205(4):967–976.
- James ND, Spears MR, Clarke NW, et al. Survival with newly diagnosed metastatic prostate cancer in the ’docetaxel era’: data from 917 patients in the control arm of the STAMPEDE trial (MRC PR08, CRUK/06/019). Eur Urol. 2015;67(6):1028–1038.
- Pokhrel A, Martikainen P, Pukkala E, et al. Education, survival and avoidable deaths in cancer patients in Finland. Br J Cancer. 2010;103(7):1109–1114.
- Rapiti E, Fioretta G, Schaffar R, et al. Impact of socioeconomic status on prostate cancer diagnosis, treatment, and prognosis. Cancer. 2009;115(23):5556–5565.
- Palo JU, Ulmanen I, Lukka M, et al. Genetic markers and population history: Finland revisited. Eur J Hum Genet. 2009;17(10):1336–1346.
- Jousilahti P, Vartiainen E, Tuomilehto J, et al. Role of known risk factors in explaining the difference in the risk of coronary heart disease between Eastern and southwestern Finland. Ann Med. 1998;30(5):481–487.
- Bray F, Lortet-Tieulent J, Ferlay J, et al. Prostate cancer incidence and mortality trends in 37 European countries: an overview. Eur J Cancer. 2010;46(17):3040–3052.
- Auvinen A, Rietbergen JB, Denis LJ, et al. Prospective evaluation plan for randomised trials of prostate cancer screening. The international prostate cancer screening trial evaluation group. J Med Screen. 1996;3(2):97–104.
- Mottet N, Bellmunt J, Briers E, et al. EAU – ESTRO – ESUR – SIOG Guidelines on Prostate Cancer 2020; [cited 2022 Aug 6]. Available from: https://uroweb.org/guideline/prostate-cancer/.
- Statistics Finland: Cause of death data from Finland. 2008; [cited 2021 Aug 16]. Available from: https://www.stat.fi/til/ksyyt/2008/ksyyt_2008_2009-12-18_tie_001.html.
- Finnish Cancer Registry. 2021. [cited 2021 Aug 13]. Available from: https://cancerregistry.fi/statistics/cancer-statistics/.
- Statistics Finland. Quality description: Causes of death. 2020. Statistics Finland; 2020; [cited 2022 Jun 16]. Available from: https://www.stat.fi/til/ksyyt/2020/ksyyt_2020_2021-12-10_laa_001_en.html.