
Abstract
Background
High costs of cancer, and especially the increase in treatment costs, have raised concerns about the financial sustainability of publicly funded health care systems around the world. As cancers get more prevalent with age, treatment costs are expected to keep rising with aging populations. The objective of the study is to analyze the changes in cost of cancer care broken down into separate cost components and outcomes of cancer treatment in the Nordic countries 2012–2017.
Materials and methods
We estimated direct costs of cancer based on retrospective data from national registers: outpatient care and inpatient care in primary care and specialized care as well as medicine costs. The number of cancer cases and survival data was obtained from NORDCAN. Cancer was defined as ICD-10 codes C00–C97.
Results
Healthcare costs of cancer in real terms increased in all countries: CAGR was between 1 and 6% depending on the country. Medicine costs have increased rapidly (37–125%) in all countries during the observation period. In Finland and Denmark, inpatient care costs have decreased, whereas in Iceland, Norway, and Sweden, they have increased, although the number of inpatient days has decreased everywhere. The age-standardized cancer mortality has decreased constantly over time.
Conclusion
Cancer care in Nordic countries has significant differences in both cost structures and in the development of cost drivers, indicating differences in the organization of care and different focus in health policy. It is important to compare the cancer care costs internationally on a detailed level to understand the reasons for cost development. The registration of cost data, especially medicine costs, should be more standardized to enable better cost and outcomes comparisons between countries in the future.
Introduction
In 2018, cancer treatment costs (i.e., direct medical costs) were €103 billion, representing ∼4–7% of the total healthcare costs in European countries [Citation1]. On top of this, cancer caused ∼€70 billion in productivity losses [Citation1]. High costs of cancer, and especially the increase in treatment costs, have raised concerns about the financial sustainability of publicly funded health care systems around the world. As cancers get more prevalent with age, treatment costs are expected to keep rising with aging populations [Citation2]. Additionally, new treatments are emerging at a rapid pace causing concerns about access to new potential life-saving interventions for patients in the future [Citation3–6].
Several studies have investigated the cost of cancer and the literature covers most high-income countries [Citation7–11]. Historical changes in cancer treatment costs have been reported in European countries and in the United States [Citation1,Citation5,Citation12,Citation13]. The interesting finding in the studies [Citation1,Citation12] is that the actual development in total cost of cancer in the recent years has not increased as fast as feared in previous literature [Citation14–16]. In Finland, the total costs of cancer increased 1.7% annually between 2004 and 2014 [Citation12]. However, adjusted for the number of new cancer patients, the cost per patient has been stable during this period. The increasing costs from the introduction of new cancer medicines have largely been offset by reductions in the costs of inpatient care and productivity losses, resulting in modest growth figures especially in the 2010s [Citation1].
Cross-country comparisons have so far used methodologies that do not allow for delving into the cost components (such as inpatient care, medicines, etc.). Cross-country comparisons in the development of different cost components would shed more light into the cost drivers and enable better forecasts for future costs, supporting decision makers in budgeting and health care planning. In addition to treatment costs, benefits of cancer treatment to patients should be considered [Citation6]. There are several studies on cancer treatment outcomes in terms of survival rates [Citation17–20]. However, the studies considering both the development of costs and the outcomes on a country level are limited.
The objective of the study is to analyze the changes in cost of cancer care and outcomes of cancer treatment in the Nordic countries 2012–2017. Based on the comparison, we discuss which underlying cost drivers are general and which that are healthcare system specific. This provides a deeper understanding on the possibilities of affecting cost development in the future. Considering outcomes together with costs is important since an important goal of healthcare systems is to improve cost-effectiveness.
Materials and methods
Cancer was defined using the WHO International Classification of Diseases, 10th revision (ICD-10) codes C00–97. All data were collected based on this definition except for medicine data, in which the inclusion criteria were based on ATC-codes.
We used a bottom-up method to evaluate the direct costs of cancer [Citation21]. Treatment costs included the costs of primary and secondary care and medicines. Cost data were collected from national registries and published literature (Supplementary Table S1). Community level palliative care delivered in hospices or nursing homes was included in primary care costs. The available cost data did not enable the estimation of prevention-related costs.
Medicine costs were obtained through national medicine sales statistics (Denmark, Finland, and Iceland) or existing studies on cancer medicine costs (Norway and Sweden). Medicine costs are reported in wholesale prices per ATC code following the methodology used, e.g., by [Citation1]. The costs of outpatient and inpatient care were assessed through the sum of visits and inpatient episodes either using DRG-weights and unit costs (Denmark, Norway, and Sweden) or using average costs per visit and inpatient day (Finland and Iceland). The unit costs for episodes and visits include all costs of production, e.g., personnel, materials, facilities, and equipment. Thus, the care costs also include medicine costs to the extent that they are covered by hospital budgets, which differ between countries. In Denmark, medicine costs are entirely in the hospital budgets, whereas in other countries, a part of the medicine costs is in the hospital budgets and the rest (typically pharmacy-dispensed prescription medicines) through a national body. We estimated the share of costs included in the hospital budgets and deducted that from the secondary care costs. In countries where prescription medicines are reimbursed separately, the medicine costs in hospital budgets were assumed to be divided equally among inpatient and outpatient care, since there are no statistics of the actual division. In Denmark, we assumed 30% to be in inpatient care and 70% in outpatient care. This estimate is based on the fact that in the other countries hospital-dispensed medicines represent ∼60% of the total medicine costs, and half of them are assumed to be in inpatient care. The estimate was also validated with experts from Danish Cancer Society. In addition, we did sensitivity analysis using 20%/80% and 40%/60% distributions inpatient and outpatient medication costs their effects were ±5% to the development of the inpatient/outpatient costs, respectively.
The costs for 2017 were expressed in euros using average annual exchange rate. We also used Purchasing Power Parity-adjusted costs for comparisons in 2017. In cost development analysis, we used local currencies and local annual inflation rates from Eurostat. The development of costs was calculated by country using index value 100 for year 2012.
Data on annual incidence defined as the number of newly diagnosed patients, were obtained from the NORDCAN-project (https://nordcan.iarc.fr/) [Citation22]. Cost per patient was assessed by dividing total costs of cancer by the annual incidence. This method gives an estimate of cost per patient over the lifecycle. Also, age-standardized cancer mortality rates and 1-year survival rates were obtained from NORDCAN. The Pearson correlation coefficient between mortality and costs was estimated. We analyzed the correlation between the 1-year survival rate, mortality level and average annual change in mortality with PPP adjusted costs per capita. The correlation coefficient was calculated first for mortality and cost data from the same year and then for costs with the mortality rate from the following year (e.g., costs year 2015 and mortality year 2016).
Data on total healthcare expenditure and PPP were obtained from OECD and Eurostat databases [Citation23,Citation24].
Results
Total cost of cancer care represents 3.8–4.6% of the total healthcare expenditures in the Nordic countries in 2017 (). PPP adjusted cancer care costs per capita varied between €129 and €211. PPP adjusted cancer care costs per incidence varied from €20,900 to €32,900, which can be used as an estimate of total treatment cost per cancer patient. There is a large difference between the countries in the distribution of costs related to outpatient and inpatient care. Also, the share of medicine costs out of total costs varies significantly across countries. For all countries, primary care costs represented a small proportion of the total costs (5–9%).
Table 1. Total costs of cancer care, individual cost drivers, costs per population and per incidence, and share of total healthcare expenditure in 2017.
During 2012–2017, healthcare costs of cancer in real terms increased in all countries (). The growth was greatest in Sweden (33%) and smallest in Finland (4%). The compound annual growth rate (CAGR) in real costs was between 1% (in Finland) and 6% (in Sweden). The CAGR of nominal costs was approximately 2% in Finland and Norway, and approximately 7% in Sweden and Iceland.
Figure 1. (A) Development of costs of cancer care in real terms between 2012 and 2017 (indexed, 2012 = 100) and (b) development of cancer care costs per incidence (=number of new cancer patients each year), in real terms (indexed, 2012 = 100).
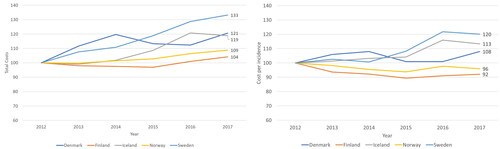
Cancer care costs per incidence in real terms decreased in Finland (–8%) and Norway (–4%) and increased in Sweden (29%), Iceland (13%), and Denmark (8%) between 2012 and 2017 (). This means that in Finland and Norway the total costs have increased less than the number of new cancer cases, whereas in Denmark, Iceland, and Sweden, the costs increase faster than the number of new cases.
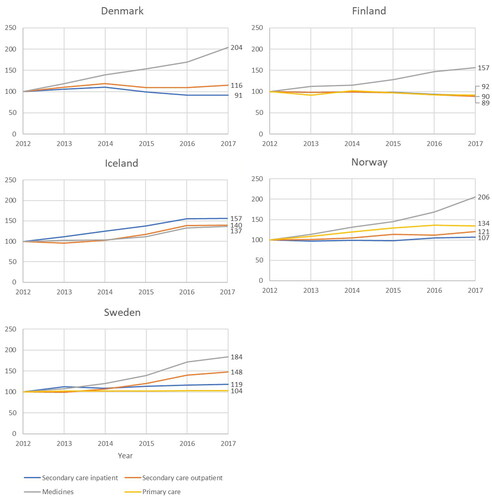
The different cost components have developed differently in the Nordic countries (). The increase has been greatest for total medicine costs in all countries except Iceland. Also, there are large differences in the growth ranging from 37% in Iceland to 125% in Denmark. What is also noteworthy is that in Finland and Denmark, inpatient care costs have decreased, whereas in Iceland, Norway, and Sweden, they have increased.
Figure 2. Development of individual cost drivers in real terms in each country between 2012 and 2017 (indexed, 2012 = 100).
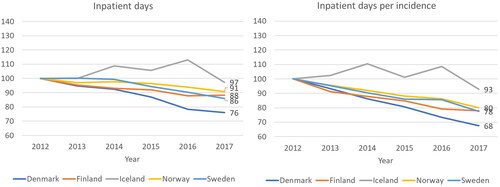
The number of secondary care inpatient days has decreased during the observation period in all the Nordic countries (). Because of the increase in the number of new patients, the average number of inpatient days per patient decreases even faster (). Interestingly, the trends observed are very similar in Finland, Denmark, Norway, and Sweden even though the starting level of inpatient days per incidence are different: 10.3 days per patient in Denmark in 2012, 10.8 days per patient in Finland, 15.0 in Iceland, 21.3 in Norway, and 13.0 in Sweden, respectively. Unlike in other countries, the trend in Iceland is first increasing and then decreasing, but this can be due to overall low volumes due to the small population.
Figure 3. Development of secondary care inpatient days and inpatient days per incidence (=number of new cancer patients each year), between in each country 2012 and 2017 (indexed, 2012 = 100).
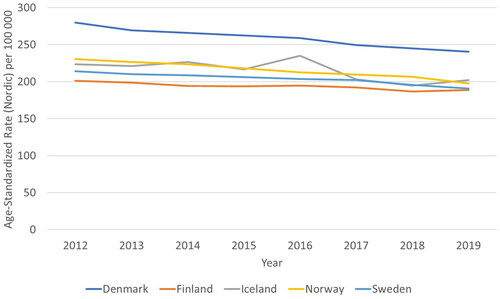
The age-standardized cancer mortality has decreased constantly over time (), with the exception of Iceland which may relate to low number of cases increasing variation. Moderate correlation (0.52) was found with the PPP adjusted cost per capita and age-standardized mortality but costs did not correlate with mortality for the following year (0.22) or changes in mortality (0.02) or 1-year survival rates (0.27).
Figure 4. Development of age-standardized cancer mortality rate in each country (deaths per 100,000 inhabitants) between 2012 and 2019.
Discussion
The growth of cancer care costs varied significantly across the Nordic countries. Finland and Norway had the lowest growth in costs. Denmark, Sweden, and Iceland experienced a faster growth, and the costs increased even after adjusting for the increase in newly diagnosed patients. Costs per cancer patient have gone up between 1995 and 2018 in Europe [Citation1]. Our CAGR of nominal cancer care costs varied between 2 and 7% which is aligned with EU average growth of 4.5% between 1995 and 2014 [Citation5]. The PPP-adjusted costs per capita had a moderate positive correlation with age-standardized mortality rate but no other associations between costs and mortality or 1-year survival rate were found. The positive correlation with mortality and costs may be due to higher incidence of both complicated cases and overall cases.
Most significant reason for lower growth of the costs in Finland and in Norway seems to be reduced secondary care inpatient costs. The assumptions made when deducting medicine costs from inpatient and outpatient costs, can affect the absolute numbers, but the decreasing trend in inpatient care costs is observable even before the deduction. Shifting care from inpatient to outpatient setting may be a means for controlling the costs without compromising the outcomes. Interestingly, the trend in the number of inpatient days is decreasing in Sweden, but inpatient care costs are still increasing. This can be due to cost inflation, but this can also indicate a change in cost reporting practices.
The cost structures differ across countries, and the trends do not seem to lead to convergence in cost structures. For example, inpatient costs constitute over 50% of total costs in Norway but only 24% in Finland, and medicine costs constitute over 30% of total costs in Finland and Denmark, but 18–25% in Norway, Sweden, and Iceland. Also, compared with previous findings in cancer costs, the differences between Nordic counties seem to have increased over time [Citation9]. This can be due to different health policies in the countries, which have focused development efforts in different segments of cancer care. Therefore, it is important to compare the cost levels, cost structures as well as cost trends between countries to obtain a better overall understanding of development possibilities and directions for national policies.
There are important limitations to the study due to diverging practices in reporting national statistics. Secondary care costs are estimated using DRG weights and corresponding unit costs in Denmark, Sweden, and Norway, but in Iceland and Finland care costs are estimated based on the number of outpatient visits and inpatient days, and corresponding unit costs. There can be differences in how DRG weights and prices are determined in each country. In addition, the extent to which medicine costs are included in the secondary care costs differs across countries. Thus, we have removed medicine costs from secondary care costs. However, the split of medicine costs between inpatient and outpatient care costs is based on an estimate and can have affected the ratio of inpatient to outpatient care costs. Also, the definition of which ATC codes are considered cancer medicines differs between countries. There is significant variance with respect to L03AX, but it represents only about 2% of cancer medicine costs, so the effect on the results is minimal. L04AX is missing from Norway, and it represents 10–15% of cancer medicine costs, thus the Norwegian medicine costs reported here are an underestimate. Another limitation of the study is the lack of primary care data from Denmark and Iceland. However, the share of primary care costs of total costs is small in the countries where primary care data is available (between 5% and 9%), thus the potential bias created by the missing data does not affect the conclusions drawn from the results.
The study only assesses the direct medical costs of cancer. We tried to collect the direct compensations of sick leaves and disability pensions but the compensation policies vary between countries making reliable comparisons difficult. Recent study from Norway highlights the significance of including indirect costs [Citation25] and they have been decreasing over time [Citation1,Citation12]. The decrease in indirect costs may be at least €20–60 million between 2012 and 2017 in Finland, Norway, and Sweden [Citation26] and should be evaluated when estimating the affordability of care. The economic benefits of improved care can often be seen in indirect costs.
In line with previous literature, medicine costs were the most rapidly growing cost element in most countries [Citation1]. Also, there are large differences in the medicine cost trends between countries observed in our study. This underlines the importance of improving medicine cost statistics in the future. Currently, it is difficult to assess actual medicine costs in a comparable way. Using wholesale data (except in Denmark) overestimates the cost of medication due to confidential rebates that reduce the actual prices [Citation1]. In addition, the medicines statistics do not allocate medicines to specific diagnoses. Using ATC codes in estimating medicine costs for diseases is reliable when specific medicines are used only for one type of disease, which fortunately is the case with most cancer medicines. However, some cancer medicines are also used for other diseases than cancers, and if this is growing trend, can create a bias in the medicine cost growth curves. Also, the allocation of medicine costs for each cancer diagnosis is difficult, since the same medicine can be used for different cancers. The costs of medicines should be allocated to diagnoses to enable disease-specific comparisons of costs. With transparent cost data on medicines, it would be easier to assess the impact of new medicines on cost development, and ultimately on the cost effectiveness of treatments.
Our study highlights the importance of continuous evaluation and follow-up of cancer-related costs. Most interesting cost elements are inpatient care and medicines as they seem to explain the differences in cost changes between countries. Obtaining cost data per diagnosis requires linking data from between multiple different records, which is a time-consuming process. Access to data and data sharing across countries should be improved so that the high-quality registry data available in the Nordics would be utilized better than it is today.
It is important to compare the cancer care costs internationally on a detailed level to understand the reasons for cost development. Cancer care in Nordic countries has significant differences in both cost structures and in the development of cost drivers, indicating differences in the organization of care and different focus in health policy. Our comparison supports the identification of the factors that can be controlled to ensure the cost-effectiveness and affordability of care in each system. Some of the countries may need to focus on development of the care organization (outpatient/inpatient) and some countries should focus on the monitoring of the rapidly increasing medicine costs and what outcomes are obtained with the treatments. The registration of cost data, especially medicine costs, should be more standardized to enable better cost and outcomes comparisons between countries in the future.
Supplemental Material
Download MS Word (16.1 KB)Acknowledgements
Ira Haavisto, Milja Asikainen, Bolette Danckert, and Elizabeth Johansson helped with data collection.
Disclosure statement
No potential conflict of interest was reported by the authors.
Data availability statement
The data are available upon request from the corresponding author
Additional information
Funding
References
- Hofmarcher T, Lindgren P, Wilking N, et al. The cost of cancer in Europe 2018. Eur J Cancer. 2020;129:41–49.
- Bugge C, Brustugun OT, Saether EM, et al. Phase- and gender-specific, lifetime, and future costs of cancer: a retrospective population-based registry study. Medicine. 2021a;100(26):e26523.
- Ferlay J, Shin HR, Bray F, et al. Estimates of worldwide burden of cancer in 2008: GLOBOCAN 2008. Int J Cancer. 2010;127(12):2893–2917.
- Møller H, Fairley L, Coupland V, et al. The future burden of cancer in England: Incidence and numbers of new patients in 2020. Br J Cancer. 2007;96(9):1484–1488.
- Jönsson B, Hofmarcher T, Lindgren P, et al. The cost and burden of cancer in the European Union 1995–2014. Eur J Cancer. 2016;66:162e70–162170.
- Sullivan R, Peppercorn J, Sikora K, et al. Delivering affordable cancer care in high-income countries. Lancet Oncol. 2011;12(10):933–980.
- Luengo-Fernandez R, Leal J, Gray A, et al. Economic burden of cancer across the European Union: a population-based cost analysis. Lancet Oncol. 2013;14(12):1165–1174.
- Mariotto AB, Yabroff KR, Shao Y, et al. Projections of the cost of cancer care in the US: 2010-2020. J Natl Cancer Inst. 2011;103(2):117–128.
- Kalseth J, Halvorsen T, Kalseth B, et al. Cross-country comparisons of health-care costs: the case of cancer treatment in the Nordic countries. Health Policy. 2014;115(2–3):172–179.
- Bradley CJ, Yabroff KR, Dahman B, et al. Productivity costs of cancer mortality in the United States: 2000–2020. J Natl Cancer Inst. 2008;100(24):1763–1770.
- Warren JL, Yabroff KR, Meekins A, et al. Evaluation of trends in the cost of initial cancer treatment. J Natl Cancer Inst. 2008;100(12):888–897.
- Torkki P, Leskela RL, Linna M, et al. Cancer costs and outcomes in the Finnish population 2004–2014. Acta Oncol. 2018;57(2):297e303–297e303.
- Tangka FK, Trogdon JG, Richardson LC, et al. Cancer treatment costs in the United States: has the burden shifted over time? Cancer. 2010;116(14):3477–3484.
- Aviki E, Abu-Rustum N, Moss H, et al. Cancer care affordability: what is our role? Gynecol Oncol. 2021;162:S101–S102.
- Aggarwal A, Sullivan R. Affordability of cancer care in the United Kingdom–is it time to introduce user charges? J Cancer Policy. 2014;2(2):31–39.
- Uyl-de Groot CA, Löwenberg B. Sustainability and affordability of cancer drugs: a novel pricing model. Nat Rev Clin Oncol. 2018;15(7):405–406.
- Allemani C, Weir HK, Carreira H, et al.; CONCORD Working Group. Global surveillance of cancer survival 1995–2009: analysis of individual data for 25 676 887 patients from 279 population-based registries in 67 countries (CONCORD-2). Lancet. 2015;385(9972):977–1010.
- De Angelis R, Sant M, Coleman MP, et al.; EUROCARE-5 Working Group. Cancer survival in Europe 1999-2007 by country and age: results of EUROCARE-5—a population-based study. Lancet Oncol. 2014;15(1):23–34.
- Sankaranarayanan R, Swaminathan R, Brenner H, et al. Cancer survival in Africa, Asia, and Central America: a population-based study. Lancet Oncol. 2010;11(2):165–173.
- Coleman MP, Forman D, Bryant H, ICBP Module 1 Working Group, et al. Cancer survival in Australia, Canada, Denmark, Norway, Sweden, and the UK, 1995–2007 (the International Cancer Benchmarking PPartnership): An analysis of population-based cancer registry data. Lancet. 2011;377(9760):127–138.
- Chapko MK, Liu CF, Perkins M, et al. Equivalence of two healthcare costing methods: bottom-up and top-down. Health Econ. 2009;18(10):1188–1201.
- Larønningen S, Ferlay J, Bray F, et al. NORDCAN: cancer incidence, mortality, prevalence and survival in the Nordic Countries, version 9.0 (01.03.2021). Association of the Nordic Cancer Registries. Cancer Registry of Norway; 2021 [cited 2021 Oct 11]. Available from: https://nordcan.iarc.fr/.
- OECD. Statistics – health expenditure and financing; 2021 [cited 2021 Aug 22]. OECD. Available from: https://stats.oecd.org/.
- Eurostat. Purchasing power parities (PPPs), price level indices and real expenditures for ESA 2010 aggregates [prc_ppp_ind]; 2021 [cited 2021 Aug 22]. Available from: https://ec.europa.eu/eurostat/data/database.
- Bugge C, Saether EM, Brustugun OT, et al. Societal cost of cancer in Norway—results of taking a broader cost perspective. Health Policy. 2021b;125(8):1100–1107.
- Hofmarcher T, Bradvik G, Svedman C, et al. Comparator report on cancer in Europe 2019 – disease burden, costs and access to medicines. Lund: IHE; 2019.