
 ?Mathematical formulae have been encoded as MathML and are displayed in this HTML version using MathJax in order to improve their display. Uncheck the box to turn MathJax off. This feature requires Javascript. Click on a formula to zoom.
Abstract
Purpose
To develop an advanced deep convolutional neural network (DCNN) architecture to generate synthetic CT (SCT) images from MR images for intensity-modulated proton therapy (IMPT) treatment planning of nasopharyngeal cancer (NPC) patients.
Methods
T1-weighted MR images and paired CT (PCT) images were obtained from 206 NPC patients. For each patient, deformable image registration was performed between MR and PCT images to create an MR-CT image pair. Thirty pairs were randomly chosen as the independent test set and the remaining 176 pairs (14 for validation and 162 for training) were used to build two conditional generative adversarial networks (GANs): 1) GAN3D: using a 3D U-net enhanced with residual connections and attentional mechanism as the generator and 2) GAN2D: using a 2D U-net as the generator. For each test patient, SCT images were generated using the generators with the MR images as input and were compared with respect to the corresponding PCT image. A clinical IMPT plan was created and optimized on the PCT image. The dose was recalculated on the SCT images and compared with the one calculated on the PCT image.
Results
The mean absolute errors (MAEs) between the PCT and SCT, within the body, were (64.89 ± 5.31) HU and (64.31 ± 4.61) HU for the GAN2D and GAN3D. Within the high-density bone (HU > 600), the GAN3D achieved a smaller MAE compared with the GAN2D (p < 0.001). Within the body, the absolute point dose deviation was reduced from (0.58 ± 1.61) Gy for the GAN2D to (0.47 ± 0.94) Gy for the GAN3D. The (3 mm/3%) gamma passing rates were above 97.32% for all SCT images.
Conclusions
The SCT images generated using GANs achieved clinical acceptable dosimetric accuracy for IMPT of NPC patients. Using advanced DCNN architecture design, such as residual connections and attention mechanism, SCT image quality was further improved and resulted in a small dosimetric improvement.
Introduction
The major advantage of proton therapy (PT) compared to photon therapy is the ability to increase the target dose conformality due to the finite range of a proton beam [Citation1]. However, this makes it more susceptible to the uncertainties caused by the patient’s anatomical changes and setup inaccuracy [Citation2]. PT treatment delivery accuracy has been substantially improved by using the onboard CBCT image as an imaging guidance [Citation3]. However, due to the lack of capabilities of real-time imaging and functional imaging, the potential of PT treatment is far from being fully explored. On the other hand, photon radiotherapy is moving rapidly toward the MR guidance treatment platform since MRI has shown significant clinical benefits in the target delineation [Citation4,Citation5] and toxicity reduction [Citation6]. Due to the tremendous cost and engineering challenges, the integration of MRI with PT is moving slowly. However, an integrated MR guided-PT (MRgPT) system has been conceptually developed and prototyped previously [Citation7]. The MRgPT system is capable of real-time imaging for localizing moving targets during dose delivery, which can mitigate the motion uncertainties and interplay effect [Citation8,Citation9]. Meanwhile, the system has great potential to visualize the tumor biological heterogeneity for targeting the resistance tumor sub-regions [Citation10].
One of many technical challenges for the clinical implementation of MRgPT treatment is the generation of a high-quality synthetic CT image (SCT) for a precise PT dose calculation. The methodologies of generating SCT images from MR images, such as multi-atlas deformable image registration [Citation11–14] and deep learning [Citation15–19], have been studied extensively during the past decades. The previous review articles [Citation20,Citation21] provide a detailed summary of the existing studies. So far, most studies have been focusing on the photon dose calculation [Citation22–29]. However, due to the nature of sharp dose falloff in the dose distribution, the PT dose calculation accuracy is much more sensitive to the CT number uncertainty compared to conventional photon therapy. Therefore, the accuracy requirement for the SCT image is much higher for MR-based PT treatment planning.
Numbers of studies investigated the SCT image-based PT dose calculation on different treatment sites, such as prostate [Citation30–32] and brain [Citation30,Citation33]. These treatment sites are relatively simple and have smaller impacts by the local tissue heterogeneity. Some of the other studies used SCT images generated by a generative adversarial network (GAN) for PT treatment planning. The SCT images have been evaluated on a relatively small number of pediatric abdominal patients [Citation34], liver cancer patients [Citation25], or head and neck (HN) patients [Citation35]. These anatomical sites are more challenging due to the complexity of the local anatomical structures. Both of air cavity and bony structure have a low MR signal on conventional MR images. However, their CT number differs significantly resulting in a significant deviation of their stopping power ratio affecting the local dose deposition. Therefore, inaccurate estimation of local HU number could lead to large dosimetric variations in PT dose calculation. Several other studies used additional non-conventional MR sequences for bone/air segmentation to improve the SCT image generation algorithm [Citation36,Citation37]. However, these specific MR sequences are not widely clinically available.
The purpose of this study is to develop an advanced deep convolutional neural network (DCNN) architecture to generate high-quality SCT images from conventional MR images for PT treatment planning of nasopharyngeal carcinoma (NPC) patients. NPC patient images were selected in the evaluation due to the significant local bone/air tissue heterogeneity adjacent to or within the targets affecting PT dose calculation accuracy. Clinical intensity-modulated PT (IMPT) plans from a cohort of 30 test patients were used to evaluate the accuracy of using the SCT images for PT dose calculation.
Methods and materials
Data acquisition and preprocessing
A total of 206 MR-CT paired images of NPC patients were used in the study. The interval between the MR and CT image acquisition is (2.3 ± 1.9) h. The patients were imaged head first supine. The MR images were acquired using a 3-tesla Ingenia high-field system (Philips Healthcare, Amsterdam, the Netherlands) with a vendor-supplied phased-array dStream Head-Neck Spine coil on a dedicated radiotherapy flat couch. A T1-weighted fast-field was used with an echo time/repetitive time of 4.9/2.4 ms, a flip angle of 12 degrees, and a reconstructed voxel size of 0.74× 0.74 × 3 mm3. Both CT and MR images were acquired with an immobilization mask in place. The CT images were acquired using a SOMATO Definition AS CT simulator (Siemens Medical System) with a reconstructed voxel size of 0.97 × 0.97 × 3 mm3. The intensity of each MR volume image was normalized as zero mean and unit variance and then scaled to a similar numeric range. Details of the intensity normalization were described in a previous study [Citation38].
A binary body mask was applied to override voxels outside the patient body for each volume image. To create better spatially matched MR-CT image pairs, deformable image registration was performed between MR and CT images for each patient using a deformable image registration tool (ADMIRE, Elekta). The resulting paired MR-CT images shared a resolution of 0.74 × 0.74 × 0.3 mm3 with 384 × 384 voxels per axial slice. The deformable registered MR-CT image pairs were used to train the models.
Conditional generative adversarial networks (GAN)
A conditional GAN framework was chosen in this study due to its excellent capability of generating a more realistic SCT image [Citation39]. A conditional GAN contains a generator CNN and a discriminator CNN. The generator is a function with an input of MR image and output of the corresponding SCT image. The discriminator is a classifier to classify a CT image as being real (output 1) or synthetic (output 0). In this study, two GAN models were implemented: (1) GAN2D: using a 2-dimensional (2D) standard 23-layer U-net [Citation40] as the generator and a 6-layer 2D CNN as the discriminator (2) GAN3D: using a 3-dimensional (3D) U-net [Citation41] enhanced with residual connections [Citation42] and attention mechanism [Citation43] as the generator and a 6-layer 3D CNN as the discriminator. In general, the 3D model is superior for learning 3D image features [Citation41]. However, it requires more GPU memory depending on the size of the input training samples. In this study, the residual connections were applied to improve the network training efficiency [Citation42]. Furthermore, the attentional mechanism was used to enhance the network capability to focus more on those local image features that are more relevant to the process of synthetic image generation [Citation43]. During training, the network gradually focuses on those most important image features for SCT image generation. Supplement Figure 1 shows the attention maps generated at different training iterations. Details of the 3D U-net architectures and their parameter settings were described in Supplement Figure 2. The hyperparameter settings of the discriminators are summarized in Supplement Table 1.
The GANs were trained with pair of {MRi, CTi}, i = 1, 2, …N (N is the total number of pairs in the training set). The training process is an iterative process to progressively identify the optimal parameters θG and θD for the generator (G) and the discriminator (D), such as:
(1)
(1)
and
(2)
(2)
where λ in EquationEquation (1)
(1)
(1) is the weighting factor for the discriminator loss term in the overall loss. Practically, it is selected empirically by balancing the generated image contrast and the MAE loss term. The
indicates the ith SCT image generated from ith MR image from the training samples. The
and
indicate the output of the discriminator with the inputs of the ith SCT image and the ith CT image, respectively. For an iteration of the training process for the GAN2D, θG was updated once and θD was updated twice successively based on the randomly selected paired MR-CT 2D image slices. The GAN3D cannot be trained with the whole 3D MR volume image as input due to the limited memory of our current GPU card. In this study, the GAN3D model was trained based on 3D image patches with the size of 80 × 80 × 48 randomly generated from the volume images of the training set.
Implementation details
A mini-batch of 3 was used for training the GAN models. Data augmentation was applied in two stages: (1) before training, each MR-CT image pair were deformed simultaneously using three different deformable vector fields randomly generated based on the 3 D B-spline method to triple the number of training samples; (2) during training, the training samples were randomly flipped and rigidly shift.
The models were implemented on Keras [Citation44] using Tensorflow [Citation45] as the backend and were trained on an NVIDIA GP100 GPU with 16GB memory. For an iteration of the training process, the parameters of the generators were updated once and the parameters of the discriminators were updated twice based on the randomly select samples. The learning rates were set to be 0.0001 and 0.0002 for the discriminators and the generators. The training process stopped when the validation loss reached a plateau to avoid model over-fitting.
Evaluation
Thirty of the 206 MR-CT image pairs were randomly selected as the independent test set. The other 176 pairs were used to build the 2 GAN models including 162 pairs as the training set and 14 pairs as the validation set. For each test patient, the MR image was used as input for the generators to generate the corresponding SCT images and compared with respect to the paired CT (PCT) image. The mean absolute error (MAE) between the SCT images and the PCT images was used to measure the CT number estimation accuracy within different regions of interest.
The dosimetric accuracy of using the SCT images for PT dose calculation was evaluated using clinical 4-beam IMPT treatment plans calculated using a pencil beam scanning algorithm (Raystation version 6. Stockholm, Sweden). A treatment dose of 35 × 2Gy was prescribed for the clinical tumor volume. For each test patient, an IMPT plan was created using the PCT images. The planning dose distribution was recalculated on the SCT images. The dose matrices have a resolution of 3 × 3 × 3 mm3 and cover the major regions of interest. The deviation between the dose matrices calculated on the PCTs and the SCT images was analyzed. Global 3D gamma analysis was performed under the criteria of 1%/1 mm, 2%/2 mm, and 3%/3 mm (dose discrepancy/distance agreement) with a 10% or 50% threshold, i.e., surpassing areas with point doses less than 10% or 50% of the prescription dose. Dose-volume histogram (DVH) parameters calculated from the PCT images and SCT images were also compared.
Statistical analysis
Wilcoxon signed-rank tests were used to compare the performance of the GAN2D and the GAN3D models. The MAEs between the SCT images and the PCT images and the gamma passing rates were tested. A p value less than 0.05 was considered statistically significant.
Results
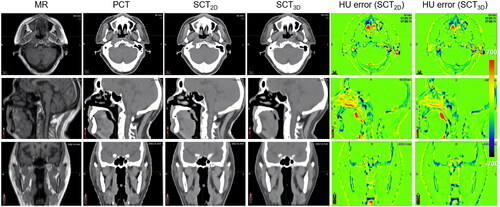
The GAN2D was trained in 300 k iterations using 175.5 h while the GAN3D was trained in 132k iterations using 96.8 h. Within the patient body, the MAEs between the PCT images and the SCT images were (64.89 ± 5.31) HU and (64.31 ± 4.61) HU for the GAN2D and the GAN3D (p = 0.36). Within the high-density bone regions (HU > 600), the GAN3D achieved a smaller MAEs compared to the GAN2D (p < 0.001). The corresponding MAEs were (221.63 ± 30.15) HU and (206.09 ± 27.43) HU for the GAN2D and the GAN3D. shows the MAE calculated within each bin of the CT or MR image intensity (left-axis) as well as the voxel image intensity distribution (right-axis). For those voxels within extreme HU values (e.g., HU > 600 or HU<-200), the GAN3D achieved a noticeably smaller MAE compared with the GAN2D. In addition, the majority of low MR signal voxels (MR intensity < 300) have a large MAE > 100HU. shows the MR, PCT, SCT images, and the corresponding HU error distributions for a patient with average HU accuracy.
Figure 1. (a) MAE between the PCT and SCT image versus CT number and the CT number distribution; (b) MAE versus MR intensity and the MR intensity distribution.
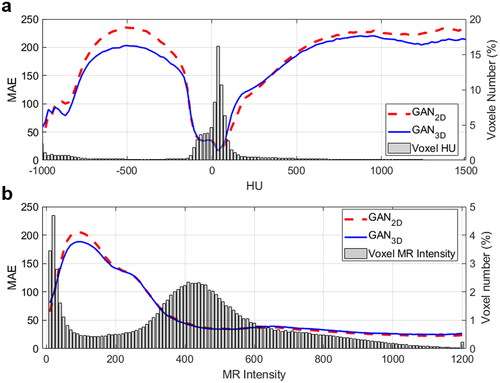
Figure 2. The MR, the PCT, the SCT images, and the HU error distributions for a test patient with average HU accuracy.
shows the cumulative distribution for the point dose absolute deviation between the dose calculated on the PCT images and the dose calculated on the SCT images. Within the patient body (10% threshold), the absolute point dose discrepancy was (0.58 ± 1.61) Gy for the GAN2D and were (0.47 ± 0.94) Gy for the GAN3D. Within the high dose regions (50% threshold), the dose deviation was (0.64 ± 1.1) Gy for the GAN2D and was (0.54 ± 0.91) Gy for the GAN3D. shows the distributions of the gamma passing rates under different criteria. Within the patient body (10% threshold), the mean ± SD of 1%/1 mm, 2%/2 mm, and 3%/3 mm gamma passing rates were (80.72 ± 6.5)%, (98.54 ± 1.5)%, and (99.64 ± 0.57)% for the GAN2D, whereas they were (82.15 ± 7.93)%, (98.59 ± 1.92)%, and (99.58 ± 0.68)% for the GAN3D. Within the high dose regions (50% threshold), the 1%/1 mm, 2%/2 mm, and 3%/3 mm gamma passing rates were (73.67 ± 9.2)%, (98.16 ± 1.99)%, and (99.54 ± 0.81)% for the GAN2D, whereas they were (75.61 ± 12.88)%, (98.3 ± 2.82)%, and (99.54 ± 0.92)% for the GAN3D. The gamma passing rates are not statistically significant for the 2 models (p ≥ 0.354). shows the absolute point dose discrepancy between the dose calculated on the PCT images and the dose calculated on the SCT images within each bin of MR intensity and CT intensity. shows the dose distributions calculated on PCT images and SCT images as well as the DVH for a test patient with a 3%/3 mm passing rate of 98.66% for the GAN2D and 99.89% for the GAN3D. Local point dose deviation on the nose, cavities. The region with dose deviation >3% of the prescription is smaller in the GAN3D-generated SCT images. Supplement Figure 3 shows the distributions for the DVH-parameter difference. The differences for CTV-D95, spinal cord-max, brain stem-max, left parotid mean dose, and right parotid mean dose were (−0.1 ± 0.2) Gy, (0.28 ± 0.56) Gy, (0.19 ± 0.45) Gy, (−0.13 ± 0.34) Gy, (−0.12 ± 0.31) Gy for the GAN2D, and (−0.1 ± 0.14) Gy, (0.09 ± 0.51) Gy, (0.18 ± 0.49) Gy, (−0.04 ± 0.37) Gy, (−0.02 ± 0.31) Gy for the GAN3D.
Figure 3. (a,b) The cumulative histograms of the absolute point dose deviations between dose calculated on the PCT images and dose calculated on the SCT images within the body (10% threshold) and within the high dose regions (50% threshold); (c,d) the gamma passing rates within the body (10% threshold) and within the high dose regions (50% threshold).
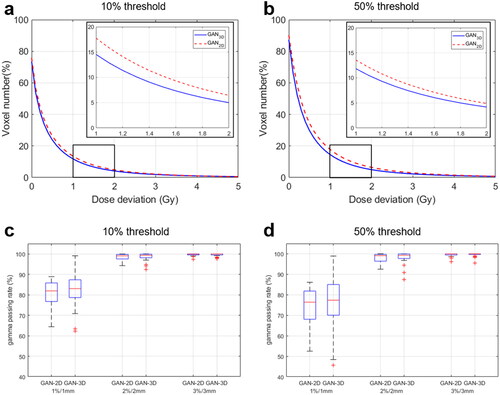
Figure 4. The absolute point dose discrepancy calculated within each bin of MR intensity and CT intensity (HU).
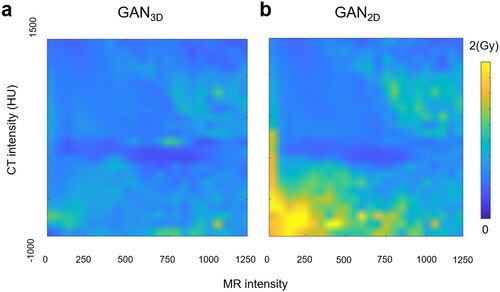
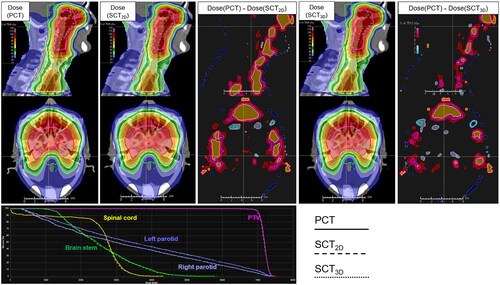
Figure 5. The dose distributions calculated on the PCT image and the SCTs, the dose discrepancies, and the corresponding DVH for a test patient with an average dosimetric performance.
Discussion
This study aims to develop an advanced CNN architecture to generate high-quality SCT images for IMPT treatment planning for NPC patients. Two GAN models were built using 176 MR-CT image pairs. The GAN2D used a standard 2D Unet as a generator while the GAN3D used a 3D Unet with residual connections and an attention mechanism. The results from the 30 test patients showed that both GANs can generate SCT images achieving high dosimetric accuracy. In particular, the GAN3D model is capable of improving the HU accuracy for high-density bone. Such SCT image quality improvement results in a small increase in dosimetry accuracy, particularly in air cavity regions, i.e., with a low MR and low CT intensity.
The MAE within the body was comparable between the two GAN models. However, the MAE for those high-density bone tissue with a HU ≥ 600 was reduced noticeably from (221.63 ± 30.15) HU for the GAN2D model to (206.09 ± 27.43) HU for the GAN3D model. It indicates that the GAN3D model could improve the 3D bone features learning. Additionally, the majority of low MR signal voxels (MR intensity < 300) have a relatively large MAE, i.e., >100HU, even for the GAN3D model (). Therefore, adding specific MR image sequences in training could be helpful to increase the prediction accuracy. It indicates the challenge of the CT number estimation accuracy in the low MR intensity regions for the current deep learning-based methods. A previous study used a 3D-Unet trained using T2-weighted MR images of HN patients to generate SCT images and it achieved an MAE = (75 ± 9) HU [Citation29]. Another study used a 2D-Unet trained using NPC patient images and the MAE = (97 ± 13) HU [Citation46]. Multi-sequences MR images have also been used to generate SCT images in 2 recent studies. The MAE was (75.7 ± 14.6) HU [Citation47] and (71.31 ± 12.4) HU [Citation48], respectively. In comparison, our model achieved a relatively lower MAE. Within the patient body, the MAE was (64.89 ± 5.31) HU for the GAN2D and (64.31 ± 4.61) HU for the GAN3D used in this study. The major reason could be that our studies used a much larger training dataset (176 patients) compared with other studies. The CT and MR images were acquired within the same day in the same treatment position with using a multi-modality CT-MR deformable image registration. Therefore, a sufficient number of high-quality MR/CT image pairs is the key to achieving high performance of the deep CNN-based models.
Overall, the dosimetric accuracy of using the SCT images for IMPT treatment planning is high for both GAN2D and GAN3D models. The 3%/3 mm gamma passing rate is above 97.32% for the two models. These results were comparable to the results evaluated for photon treatment planning of the NPC patients [Citation38]. However, PT treatment planning is more challenging because of the high dose gradient in the local regions within or adjacent to the air/bone tissue heterogeneity. Due to the low MR signals for both air and bone tissue, their HU estimation is of large uncertainty and causes dose discrepancy, especially for the GAN2D model (). The GAN3D model reduced the point dose deviation in these regions (). The % of voxels with dose deviation ≥2 Gy is 4.2% for the GAN3D and 4.9% for the GAN2D (). Therefore, the SCT images generated using the proposed GAN3D model is superior for online dose verification and plan re-optimization of PT. However, extra attention is needed for those low MR signal regions during IMPT planning on an MR-generated SCT image. Avoiding the air cavity region could be a practical way to reduce the dosimetric uncertainty.
In summary, SCT images generated using the conditional GAN models trained on a large patient cohort (n = 176) achieved clinically acceptable dosimetric accuracy for the IMPT plan of NPC patients with a 3%/3 mm gamma passing rate above 97.32%. Using the advanced neural network architecture designs, such as residual connections and attention mechanism for the generator, the SCT image quality, especially for those high-density bone tissues, was further improved and resulted in a small improvement in dosimetric accuracy.
Supplemental Material
Download MS Word (427.3 KB)Disclosure statement
X.D. report honorarium from IBA and Elekta speaker Bureau and research fundings from IBA, Elekta, and RadioMed outside the work presented here.
Data availability statement
The dataset are backed up on the Research Data Deposit (RDD Number: RDDB2019000772, https://www.researchdata.org.cn) and are available upon reasonable request.
References
- Newhauser WD, Zhang R. The physics of proton therapy. Phys Med Biol. 2015;60(8):R155–R209.
- Albertini F, Bolsi A, Lomax AJ, et al. Sensitivity of intensity modulated proton therapy plans to changes in patient weight. Radiother Oncol. 2008;86(2):187–194.
- Mackay RI. Image guidance for proton therapy. Clin Oncol (R Coll Radiol). 2018;30(5):293–298.
- Khoo VS, Joon DL. New developments in MRI for target volume delineation in radiotherapy. BJR. 2006;79(1):S2–S15.
- Rasch C, Steenbakkers RJHM, Fitton I, et al. Decreased 3D observer variation with matched CT-MRI, for target delineation in nasopharynx cancer. Radiat Oncol. 2010;5:21–28.
- Schumacher LED, Dal Pra A, Hoffe SE, et al. Toxicity reduction required for MRI-guided radiotherapy to be cost-effective in the treatment of localized prostate cancer. Br J Radiol. 2020;93(1114):20200028.
- Schellhammer SM, Hoffmann AL, Gantz S, et al. Integrating a low-field open MR scanner with a static proton research beam line: proof of concept. Phys Med Biol. 2018;63(23):23LT01.
- Dowdell S, Grassberger C, Sharp GC, et al. Interplay effects in proton scanning for lung: a 4D monte carlo study assessing the impact of tumor and beam delivery parameters. Phys Med Biol. 2013;58(12):4137–4156.
- Li Y, Kardar L, Li X, et al. On the interplay effects with proton scanning beams in stage III lung cancer. Med Phys. 2014;41:21721.
- Jones KM, Michel KA, Bankson JA, et al. Emerging magnetic resonance imaging technologies for radiation therapy planning and response assessment. Int J Radiat Oncol Biol Phys. 2018;101(5):1046–1056.
- Dowling JA, Lambert J, Parker J, et al. An atlas-based electron density mapping method for magnetic resonance imaging (MRI)-alone treatment planning and adaptive MRI-based prostate radiation therapy. Int J Radiat Oncol Biol Phys. 2012;83(1):e5–11–11.
- Gudur MSR, Hara W, Le Q-T, et al. A unifying probabilistic bayesian approach to derive electron density from MRI for radiation therapy treatment planning. Phys Med Biol. 2014;59(21):6595–6606.
- Sjölund J, Forsberg D, Andersson M, et al. Generating patient specific pseudo-CT of the head from MR using atlas-based regression. Phys Med Biol. 2015;60(2):825–839.
- Chen S, Quan H, Qin A, et al. MR image-based synthetic CT for IMRT prostate treatment planning and CBCT image-guided localization. J Appl Clin Med Phys. 2016;17(3):236–245.
- Han X. MR-based synthetic CT generation using a deep convolutional neural network method. Med Phys. 2017;44(4):1408–1419.
- Wolterink JM, Dinkla AM, Savenije MHF, et al. Deep MR to CT synthesis using unpaired data. MICCAI. 2017; p. 1–10.
- Chen S, Qin A, Zhou D, et al. Technical note: u-net-generated synthetic CT images for magnetic resonance imaging-only prostate intensity-modulated radiation therapy treatment planning. Med Phys. 2018;45(12):5659–5665.
- Emami H, Dong M, Nejad-Davarani SP, et al. Generating synthetic CTs from magnetic resonance images using generative adversarial networks. Med. Phys. 2018;45(8):3627–3636.
- Lei Y, Harms J, Wang T, et al. MRI-only based synthetic CT generation using dense cycle consistent generative adversarial networks. Med Phys. 2019;46(8):3565–3581.
- Johnstone E, Wyatt JJ, Henry AM, et al. Systematic review of synthetic computed tomography generation methodologies for use in magnetic resonance imaging–only radiation therapy. Int J Radiat Oncol Biol Phys. 2018;100(1):199–217.
- Spadea MF, Maspero M, Zaffino P, et al. Deep learning based synthetic-CT generation in radiotherapy and PET: a review. Med Phys. 2021;48(11):6537–6566.
- Liu Y, Lei Y, Wang T, et al. MRI-based treatment planning for liver stereotactic body radiotherapy: validation of a deep learning-based synthetic CT generation method. Br J Radiol. 2019;92(1100):20190067.
- Dinkla AM, Wolterink JM, Maspero M, et al. MR-only brain radiotherapy: dosimetric evaluation of synthetic CTs generated by a dilated convolutional neural network. Int J Radiat Oncol Biol Phys. 2018;102(4):801–812.
- Tyagi N, Fontenla S, Zhang J, et al. Dosimetric and workflow evaluation of first commercial synthetic CT software for clinical use in pelvis. Phys Med Biol. 2017;62(8):2961–2975.
- Liu Y, Lei Y, Wang T, et al. MRI-based treatment planning for proton radiotherapy: dosimetric validation of a deep learning-based liver synthetic CT generation method. BJR. 2019;92(1100):20190067.
- Kazemifar S, McGuire S, Timmerman R, et al. MRI-only brain radiotherapy: assessing the dosimetric accuracy of synthetic CT images generated using a deep learning approach. Radiother Oncol. 2019;136:56–63.
- Qi M, Li Y, Wu A, et al. Multisequence MR‐generated sCT is promising for HNC MR‐only RT: a comprehensive evaluation of previously developed sCT generation networks. Med Phys. 2022;49(4):2150–2158.
- Kemppainen R, Suilamo S, Tuokkola T, et al. Magnetic resonance-only simulation and dose calculation in external beam radiation therapy: a feasibility study for pelvic cancers. Acta Oncol. 2017;56(6):792–798.
- Dinkla AM, Florkow MC, Maspero M, et al. Dosimetric evaluation of synthetic CT for head and neck radiotherapy generated by a patch-based three-dimensional convolutional neural network. Med Phys. 2019;46:4095–4104
- Koivula L, Wee L, Korhonen J. Feasibility of MRI-only treatment planning for proton therapy in brain and prostate cancers: dose calculation accuracy in substitute CT images. Med Phys. 2016;43(8):4634–4642.
- Maspero M, Van Den Berg CAT, Landry G, et al. Feasibility of MR-only proton dose calculations for prostate cancer radiotherapy using a commercial pseudo-CT generation method. Phys Med Biol. 2017;62(24):9159–9176.
- Liu Y, Lei Y, Wang Y, et al. Evaluation of a deep learning–based pelvic synthetic CT generation technique for MRI-based prostate proton treatment planning. Phys Med Biol. 2019;64:205022.
- Neppl S, Landry G, Kurz C, et al. Evaluation of proton and photon dose distributions recalculated on 2D and 3D unet-generated pseudoCTs from T1-weighted MR head scans. Acta Oncol. 2019;58(10):1429–1434.
- Florkow MC, Guerreiro F, Zijlstra F, et al. Deep learning-enabled MRI-only photon and proton therapy treatment planning for paediatric abdominal tumours. Radiother Oncol. 2020;153:220–227.
- Thummerer A, de Jong BA, Zaffino P, et al. Comparison of the suitability of CBCT- And MR-based synthetic CTs for daily adaptive proton therapy in head and neck patients. Phys Med Biol. 2020;65(9):095002.
- Su KH, Friel HT, Kuo JW, et al. UTE-mDixon-based thorax synthetic CT generation. Med Phys. 2019;0:1–12.
- Zheng W, Kim JP, Kadbi M, et al. Magnetic resonance-based automatic air segmentation for generation of synthetic computed tomography scans in the head region. Int J Radiat Oncol Biol Phys. 2015;93(3):497–506.
- Peng Y, Chen S, Qin A, et al. Magnetic resonance-based synthetic computed tomography images generated using generative adversarial networks for nasopharyngeal carcinoma radiotherapy treatment planning. Radiother Oncol. 2020;150:217–224.
- Isola P, Zhu JY, Zhou T, et al. Image-to-Image translation with conditional adversarial networks. CVPR. 2017;11129:601–618.
- Ronneberger O, Fischer P, Brox T. U-Net: Convolutional networks for biomedical image segmentation. MICCAI. 2015.
- Çiçek Ö, Abdulkadir A, Lienkamp SS, et al. 3D U-net: learning dense volumetric segmentation from sparse annotation. MICCAI. 2016.
- He K, Zhang X, Ren S, et al. Deep residual learning for image recognition CVPR. 2016.
- Oktay O, Schlemper J, Folgoc L, et al. Attention u-net: learning where to look for the pancreas. 2018. DOI:10.48550/arXiv.1804.03999
- Chollet F. Keras: deep learning library for theano and tensorflow. 2015. Available from: https//KerasIo/2015
- Abadi M, Barham P, Chen J, et al. TensorFlow: a system for large-scale machine learning. Carlsbad (CA): OSDI, 2016. p. 265–284.
- Wang Y, Liu C, Zhang X, et al. Synthetic CT generation based on T2 weighted MRI of nasopharyngeal carcinoma (NPC) using a deep convolutional neural network (DCNN). Front Oncol. 2019;9:1333.
- Tie X, Lam S, Zhang Y, et al. Pseudo-CT generation from multi-parametric MRI using a novel multi-channel multi-path conditional generative adversarial network for nasopharyngeal carcinoma patients. Med Phys. 2020;47(4):1750–1762.
- Qi M, Li Y, Wu A, et al. Multi‐sequence MR image‐based synthetic CT generation using a generative adversarial network for head and neck MRI‐only radiotherapy. Med Phys. 2020;47(4):1880–1894.