
Abstract
Background
The Prostate Cancer Cohort Consortium (PC3) Working Group proposed a definition for aggressive prostate cancer (PC) for aetiologic epidemiologic research. We aimed to validate this definition as well as a second approach utilising only information on stage at diagnosis.
Methods
First primary PCs diagnosed 2004 − 2009 in the population-based Janus Serum Bank (JSB) cohort were identified by linkage to the population-based Cancer Registry of Norway (CRN) (n = 3568). The CRN and Norwegian Prostate Cancer Registry provided clinicopathological data for these cases. Approach 1 classified PC as aggressive if it was clinically T4, or N1, or M1, or had a Gleason score ≥8 at diagnosis (as proposed). Approach 2 classified PC as aggressive if CRN stage at diagnosis was ‘regional spread’ or ‘distant metastases’. Both approaches were validated by calculating the sensitivity and positive predictive value (PPV) against PC-death within 10 years of diagnosis.
Results
Overall, 555 died from PC within 10 years. Approach 1 classified 24.7% of cases as aggressive and 13.6% were unclassified due to missing information. Approach 2 classified 19.6% as aggressive and 29% were unclassified. Sensitivity was highest for Approach 1 (0.76, 95% CI: 0.72 − 0.80 vs 0.69, 95% CI: 0.64 − 0.73), while PPVs were similar for both approaches (0.43, 95% CI: 0.40 − 0.46 and 0.40, 95% CI: 0.36 − 0.44). We observed similarly high sensitivity and higher PPVs than those reported by the PC3 Working Group.
Conclusions
The proposed definition of aggressive PC was applicable and valid in the JSB cohort. Stage at diagnosis can be useful if data on cTNM or Gleason score is unavailable.
Background
Prostate cancer (PC) is the second most common cancer in men worldwide [Citation1]. After prostate-specific antigen (PSA) testing became common in the 1990s, most countries experienced an increase in PC incidence and a decrease in PC-specific mortality [Citation2–4]. This is because PSA testing can discover slow-growing asymptomatic disease that previously went undetected and which is thought to represent clinical overdiagnosis (indolent cancer) [Citation5,Citation6]; before the PSA-testing era, most PC cases were clinically detected (i.e., palpable, symptomatic) [Citation7,Citation8]. Additionally, molecular tumour characterisation and improved treatment have contributed to the decline in PC-specific mortality [Citation9].
Risk factors for aggressive PC, as defined by advanced stage and poorer prognosis, often differ from those for early-stage PC in epidemiological studies and this may indicate that indolent and aggressive PC have distinct aetiologies [Citation10–12]. To increase knowledge about PC aetiology and improve targeted prevention, it has been recommended to study aggressive PC as a distinct outcome. To this end, the Prostate Cancer Cohort Consortium (PC3) Working Group recently proposed a set of classification rules to define aggressive PC [Citation13]. Based on the sensitivity and positive predictive values (PPV) of different definitions for aggressive PC using the National Cancer Institute’s Surveillance, Epidemiology, and End Results-18 (SEER-18) database, they proposed defining aggressive PC using the American Joint Committee on Cancer’s Tumour-Node-Metastasis (TNM) standard for cancer staging as PC with large tumour spread (T4), lymph node involvement (N1), distant metastasis (M1), or a Gleason score ≥8 [Citation13,Citation14]. To facilitate the comparison of results between studies, the PC3 Working Group recommended epidemiologic studies report results for the proposed definition of aggressive PC and for fatal PC.
Increased detection of early-stage PC has triggered a need for biomarkers that can predict the development of aggressive malignancies and support tailored treatment. This requires large prospective cohorts with high-quality cancer data and biospecimens [Citation15]. The Norwegian population-based Janus Serum Bank (JSB) cohort includes pre-diagnostic serum samples, health measures, and data on modifiable lifestyle factors for more than 17,000 incident PC cases diagnosed during 1973–2019 [Citation16,Citation17]. The JSB has been widely used in cancer biomarker studies since the early 1990s and the serum sample volumes are a limited resource. An optimised operation of the JSB includes restricted use of sample volumes and the use of a recommended definition of aggressive prostate cancer is essential in this setting.
In this study, we aimed to validate the definition of aggressive PC proposed by the PC3 Working Group (using the information on TNM and Gleason score [Citation13]), and to validate a second approach (using less detailed clinicopathological information) in primary invasive PC cases in the JSB cohort using high-quality data from the Cancer Registry of Norway (CRN).
Methods
Data sources
All cancer diagnoses in Norway have been registered at the CRN since 1953 using the 7th edition of the International Classification of Diseases (ICD-7) and ICD of oncology (version 2 and 3; ICD-O-2 and ICD-O-3), converted to the 10th ICD version. Based on clinical and pathological information on metastasis, the CRN classifies the stage at diagnosis as a local disease (no metastasis); regional metastasis (regional lymph nodes, satellites, and in-transit metastasis); distant metastasis (non-regional lymph node and organ metastasis); or unspecified (cases lacking verified information on metastasis) [Citation4]. Extensive registration of clinicopathological variables, including clinical TNM (cTNM) staging and Gleason score, has taken place since 2004 when the Norwegian Prostate Cancer Registry (NPCR) was established under the CRN [Citation18]. Reporting from several independent clinical sources ensures complete and high-quality data at the CRN. Since 2000, 97% of PC diagnoses in CRN have been morphologically verified [Citation19]. Information about vital status and cause of death is provided to the CRN by the Norwegian Cause of Death Registry.
Study population
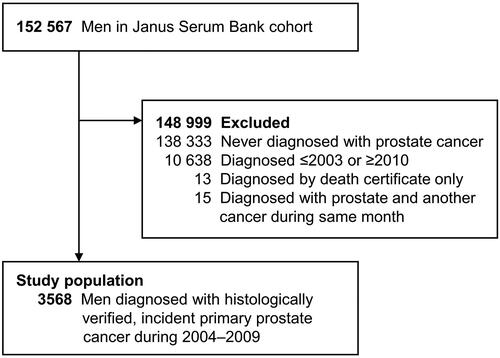
Individuals were enrolled in the JSB cohort when participating in population-based, cardiovascular disease health surveys in Norway between 1972 and 2004. The mean age at enrollment was 41 years [Citation16]. In four of the five regional health surveys, the participation rate was ≥60%. To identify PC cases, men in the JSB cohort were linked to the CRN and NPCR using the unique personal national identity number assigned all Norwegian residents. The study population included men who were diagnosed with a first primary PC between 1 January 2004, and 31 December 2009 (). We excluded men who had a PC diagnosis reported to the CRN based on a death certificate only or were diagnosed with PC and another malignancy within the same month.
Figure 1. Flowchart illustrating inclusions, exclusions, and the final study population.
From the CRN, we obtained information on PC diagnoses (ICD-10 code C61) and vital status (alive, emigrated, or dead). From the NPCR, we obtained information about cTNM and Gleason scores. The Norwegian Cause of Death Registry provided the date and cause of death from men’s entry into the cohort until 31 December 2019.
This study was approved by the Regional Committee for Medical Research Ethics, South-East Norway (no. 2014/204).
Classifying aggressive prostate cancer
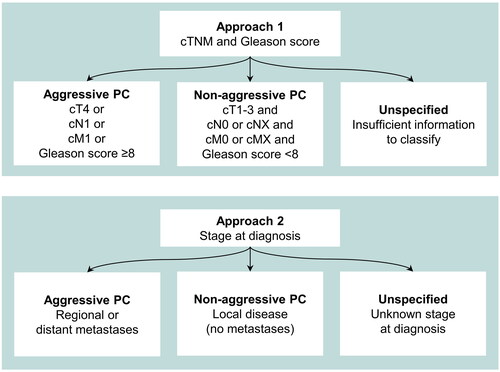
PC cases were classified as aggressive if they had a clinical category of T4 or N1 or M1, or a Gleason score of ≥8 at diagnosis (Approach 1), as proposed by the PC3 Working Group [Citation13]. Cases were classified as non-aggressive if they did not meet these criteria for aggressiveness and had complete information on cTNM and Gleason scores. Following the methodology of the PC3 Working Group, we assumed cNX and cMX represented non-aggressive disease [Citation13]. All remaining cases were classified as unspecified.
Information about cTNM and Gleason score was not routinely collected at the CRN for PC diagnosed before 2004. Because this historical incompleteness could present a challenge for future retrospective studies, we evaluated a second approach for classifying aggressive PC (). In Approach 2, aggressiveness was classified using CRN information about stage at diagnosis: cases were classified as aggressive if the stage was recorded as ‘regional spread’ or ‘distant metastases’, and as non-aggressive if the PC was diagnosed as ‘local disease’. All other cases were classified as unspecified.
Figure 2. Approaches used to classify aggressive prostate cancer (PC).
Statistical analyses
We described the study population using means, standard deviations (SD), and ranges for continuous variables and frequencies and proportions (%) for categorical variables, stratified by diagnostic period (2004 − 2005, 2006 − 2007, 2008-2009) and overall (2004 − 2009) (). We also described the number and proportion of aggressive PC for both approaches.
Table 1. Characteristics of the study population of men with a primary invasive prostate cancer (PC) within the Janus Serum Bank cohort, diagnosed 2004 − 2009, stratified by year of diagnosis.
We evaluated the agreement between Approaches 1 and 2 using percent agreement, Cohen’s Kappa with a 95% confidence interval (CI), and the asymptotic McNemar test for symmetry [Citation20]. The qualitative guideline proposed by Landis and Koch was used to interpret the Kappa statistic [Citation21].
In keeping with the analyses by the PC3 Working group, a PC diagnosis was defined as fatal if PC was listed as the underlying cause on a man’s death certificate within 10 years of diagnosis [Citation13]. We validated both approaches against this standard of fatal PC (hereafter referred to as 10-year fatal PC) by calculating sensitivity and positive predictive values (PPVs) which were prioritised as outcomes by the PC3 Working Group [Citation13]. Sensitivity captures whether the proposed definition of aggressive PC identifies a high proportion of life-threatening cases and PPV captures whether the criteria of aggressiveness indeed represent a life-threatening disease. Sensitivity was defined as the number of cases defined as aggressive and 10-year fatal (i.e., true positives, TP) divided by the total number of 10-year fatal cases (i.e., TP + false negatives, FN). The PPV was defined as the number of cases defined as aggressive and 10-year fatal (TP) divided by the total number of aggressive cancers (i.e., TP + false positives, FP). For both outcomes, 95% CI were calculated using the Wilson Score interval [Citation22]. Sensitivity and PPV were calculated on an annual basis and overall. Results pertaining to men diagnosed in 2007 were used for direct comparison with results from the PC3 Working Group [Citation13]. Lastly, we calculated the annual sensitivity and PPV of Approach 1 for men diagnosed with PC, using a reference standard of fatal PC within 5 and 7 years of diagnosis.
All analyses were performed using Stata (version 17.0). The 95% CI for Cohen’s Kappa was calculated using the kappaetc package.
Results
Of the 152 567 men in the JSB cohort, the final study population included 3568 men with a verified first incident primary PC diagnosis during 2004–2009 (). The proportion of 10-year fatal PC slightly decreased from 19.5% to 12.5% over the study period (). Data completeness for cN and cM was roughly 90%, and somewhat higher for cT (, Supplementary Figure S1). The completeness for the Gleason score was also high (>90%). Data completeness for the CRN stage categories improved over time – the proportion of unspecified PC decreased from 30.6% to 26.0% –and the proportion of cases with regional metastasis increased from 7.8% to 19.2% (, Supplementary Figure S2).
Proportion of aggressive cases
Using Approach 1, 24.7% of all cases were classified as aggressive, while 13.6% could not be classified due to missing information (). The proportions of aggressive and unspecified cases both increased slightly during 2004 − 2009.
Using Approach 2, 19.6% of all cases were classified as aggressive and 29.0% could not be classified. Between 2004 and 2009, the proportion of aggressive cases increased from 16.1% to 25.1% and the proportion of unspecified cases decreased from 30.6% to 26.0%.
Agreement between approaches
Overall, 2254 cases could be classified as aggressive or non-aggressive using both Approaches (Supplementary Table S1). Overall agreement was 79.7% (n = 1797 cases) and Cohen’s Kappa was 0.51 (95% CI: 0.47–0.55), suggesting moderate agreement between the two approaches. Discordant cases were no more likely to be classified as aggressive or non-aggressive by either approach (p = 0.48).
Sensitivity and positive predictive value
For PC cases in the JSB cohort, Approach 1 had a higher sensitivity (0.76, 95% CI: 0.72 − 0.80) than Approach 2 (0.69, 95% CI: 0.64 − 0.73) (). The PPV was similar for both approaches: 0.43 (95% CI: 0.40 − 0.46) and 0.40 (95% CI: 0.36 − 0.44), respectively. Results from annual analyses demonstrated similar sensitivities and PPVs for both approaches (): there was some annual variation for sensitivity, while the PPVs decreased slightly between 2005 and 2007.
Figure 3. Sensitivity (A) and positive predictive values (B) with corresponding 95% confidence intervals for defining aggressive prostate cancer (PC) using Approaches 1 and 2 for cases diagnosed 2004–2009. The horisontal dashed lines and shaded bands represent point estimates with 95% confidence intervals for PCs diagnosed in 2007 in the SEER-18 cohort as reported by the PC3 Working Group [Citation16].
![Figure 3. Sensitivity (A) and positive predictive values (B) with corresponding 95% confidence intervals for defining aggressive prostate cancer (PC) using Approaches 1 and 2 for cases diagnosed 2004–2009. The horisontal dashed lines and shaded bands represent point estimates with 95% confidence intervals for PCs diagnosed in 2007 in the SEER-18 cohort as reported by the PC3 Working Group [Citation16].](/cms/asset/4adfcc43-e69d-4137-a891-c1c826505add/ionc_a_2175331_f0003_c.jpg)
Table 2. Number (n) of cases, and sensitivity and positive predictive values (PPVs), with 95% confidence intervals (CIs), for Approaches 1 and 2 to classify aggressive prostate cancer among cases in the Janus Serum Bank cohort diagnosed 2004–2009 and in 2007.
Analyses restricted to cases diagnosed in 2007 (n = 648, mean age at diagnosis 66.7 (SD 7.8) years) produced similar sensitivities for Approaches 1 and 2: 0.71 (95% CI 0.60 − 0.79) and 0.66 (95% CI 0.54 − 0.77), respectively (). These estimates were similar to that reported by the PC3 Working Group for SEER-18 cases diagnosed in the same year in the USA (0.66, 95% CI 0.64 − 0.67). The PPV was slightly lower for Approach 1 (0.39, 95% CI 0.31 − 0.47) than for Approach 2 (0.44, 95% CI 0.34 − 0.54), but both were notably higher than the PPV reported for the SEER-18 cohort (0.23, 95% CI 0.22 − 0.24).
Sensitivity and PPV analyses using a reference standard of fatal PC within 5 and 7 years of diagnosis showed similar temporal trends to those observed in the main analysis of 10 years follow-up (Supplementary Figure S3). The sensitivity increased slightly with a shorter follow-up window to define fatal cases, while the PPV decreased when using a shorter follow-up window.
Discussion
In this study, we utilised population-based cancer data from the CRN and NPCR to identify aggressive PC according to the criteria proposed for epidemiologic studies by the PC3 Working Group, and an alternative approach using stage at diagnosis. In our study population of 3568 PC cases in the JSB cohort, 555 men died of PC within 10 years from diagnosis. Compared to the results reported from the SEER-18 cohort in USA, we found similarly high sensitivity, and even higher PPV for PC death within 10 years. We found similar results when using CRN data on stage at diagnosis to identify aggressive PC cases.
The number of PC cases in our closed cohort study increased during 2004 − 2009, while the proportion of 10-year fatal PC decreased. Men in the JSB cohort were recruited when they were 35-40 years old, and ageing of the cohort causes an increase in PC incidence over time (). Additionally, the use of PSA-testing increased in Norway during the study period which resulted in an increase in PC diagnoses and a simultaneous decrease in the proportion of 10-year fatal cases [Citation23]. Intensified or improved treatment for aggressive tumours may also partly explain the decrease in fatal cancers over time [Citation24].
During the study period, in particular the years 2008 − 2009, we observed an increase in the proportion of cases diagnosed with regional metastasis and a slight decrease in cases diagnosed with distant metastasis. This may result from improved diagnostic tools and procedures, but the proportion of cases with unspecified cTNM and stage makes interpretation of this finding challenging. Data from the SEER-18 cohort indicate a decrease in local stage and increase in metastatic PC for men aged ≥75 during 2004–2010 and stable rates of localised and metastatic PC among younger men during the same period [Citation25].
Overall, Approach 1 classified 24.7% of all PC cases as aggressive and 13.6% were unspecified. A lower proportion (19.6%) were classified as aggressive using Approach 2, but 29.0% were unspecified. This highlights the benefit of using detailed information on cTNM and Gleason score to define aggressive PC (Approach 1). We observed moderate agreement between Approaches 1 and 2 using Landis and Koch’s qualitative guideline for the Kappa statistic [Citation21]. Although this guideline is commonly used in medical research, the Kappa statistic is affected by the marginal rates for both Approaches which can limit the utility of using a pre-defined scale to qualify the level of observed agreement [Citation26]. Further research is needed to identifywhether the aggressive prostate cancers identified by both approaches have similar aetiologies, but our results for sensitivity and PPV indicate that cTNM and Gleason score (Approach 1) predict aggressiveness better than CRN stage at diagnosis only (Approach 2). However, when such information is lacking, as is the case in Norway prior to the establishment of NPCR in 2004, Approach 2 may provide a useful alternative to classify aggressiveness. We observed that the sensitivity of both approaches improved slightly over time, but this trend was most pronounced for Approach 2. The PPVs decreased between 2005 and 2007, likely due to a slight increase in the number of aggressive cancers and a concomitant decrease in the number of fatal cancers. It may also partially be due to the increase in clinical data completeness over time.
Direct comparison of results from JSB cases diagnosed in 2007 and the SEER-18 cohort studied by the PC3 Working Group showed similarly high sensitivity in both cohorts and notably higher PPVs in the JSB cohort [Citation13]. The prevalence of fatal cancers in the JSB cohort was roughly nine percentage points higher than reported for the SEER-18 cohort. This is likely the main cause of the difference in PPVs, since an increased prevalence of fatal cancers will also increase PPV (all other factors held equal). The higher proportion of PC deaths observed in the JSB cohort can potentially result from reporting bias on death certificates which lead to misclassification of PC deaths. The manual classification of deaths in Norway is not likely to explain the high PC mortality, however, the accuracy of cause of death assignments is reduced for PC patients over 75 years old as they are more likely to have PC incorrectly registered as their cause of death [Citation27,Citation28]. Racial or ethnic differences between the study populations may have also contributed to different results observed from the JSB and SEER-18 cohorts. JSB has no information about race or ethnicity, but most men were recruited to the cohort during the 1970s and ‘80s when immigration to Norway was minimal and the cohort would therefore consist predominantly of White, ethnically Norwegian men [Citation29]. Other differences between our study population from the JSB cohort and the SEER-18 cohort used by the PC3 Working Group are the sample size (JSB smaller) and age distribution (JSB younger).
A strength of our study is the use of the large, population-based JSB cohort, which allowed for long-term follow-up for PC diagnoses and death. Individuals choosing to participate in a health survey may have been more health-conscious than non-participants. However, the cohort includes participants from 17 of 19 counties and their cancer incidence reflect the incidence in the Norwegian population, and we thus assume the cohort represents the Norwegian population in this regard. However, the age distribution of this closed cohort does not represent that of the Norwegian population. The availability of individual-level, population-based cancer information from the CRN and NPCR is another strength of our study. Mandatory reporting has ensured valid and high-quality data on all cancer cases in the CRN and NPCR. A weakness of our study is the use of 10-year fatality as the reference standard to define deadly PC cases. This is not a perfect measure: some men would have died prematurely from competing causes and others would have died after 10 years, even though in both cases their PC would have been aggressive and eventually fatal. Our data showed that 24% and 17% of those who met the criteria of aggressive PC in Approaches 1 and 2 died from other causes within 10 years of diagnosis.
To conclude, the proposed cTNM and Gleason score criteria to identify aggressive PC was applicable and valid in the population-based JSB cohort. We also found that the stage at diagnosis (based on data on metastasis) can be useful in identifying aggressive PC when data on cTNM and Gleason score is lacking. Both these approaches will be essential to identify aggressive PC cases when utilising the JSB cohort for future aetiologic epidemiologic research since PC cases in this cohort date as far back as the 1970s.
| Abbreviations | ||
| PC | = | Prostate cancer |
| PSA | = | Prostate-specific antigen |
| PC3 | = | Prostate cancer cohort consortium |
| TNM | = | Tumour-node-metastasis |
| cTNM | = | Clinical tumour-node-metastasis |
| JSB | = | Janus serum bank |
| NPCR | = | Norwegian prostate cancer registry |
| CRN | = | Cancer registry of norway |
| CI | = | Confidence interval |
| PPV | = | Positive predictive value |
| SEER | = | Surveillance, epidemiology, and end results-18 |
| TP | = | True positive |
| FN | = | False negative |
| FP | = | False positive |
Supplemental Material
Download MS Word (16.8 KB)Supplemental Material
Download PDF (67.3 KB)Supplemental Material
Download PDF (55 KB)Supplemental Material
Download PDF (61.8 KB)Acknowledgements
We sincerely acknowledge Kim Lund Nilsen for his help with the NPCR data which facilitated the interpretation of NPCR data changes over time.
Disclosure statement
Role of the funder: Not applicable.
Author disclosures: No conflicts of interest.
Data availability statement
The data underlying this article cannot be shared publicly due to patient privacy. The data can be shared for research purposes on request to the Cancer Registry of Norway’s data delivery unit via Helsedata.no (https://helsedata.no/).
Additional information
Funding
References
- Ferlay JE, Lam F, Colombet M, et al. Global cancer observatory: cancer today international agency for research on cancer. Lyon, France: International Agency for Research on Cancer; 2020. [cited 2021 Jul 07]. Available from: https://gco.iarc.fr/today/home.
- Lavi A, Cohen M. [PROSTATE cancer early detection using psa – current trends AND recent updates]. Harefuah. 2017;156(3):185–188.
- Torre LA, Siegel RL, Ward EM, et al. Global cancer incidence and mortality rates and trends–An update. Cancer Epidemiol Biomarkers Prev. 2016;25(1):16–27.
- Cancer Registry of Norway. Cancer in Norway 2020 – Cancer incidence, mortality, survival and prevalence in Norway. Oslo: Cancer Registry of Norway; 2021.
- Brawley OW. Prostate cancer epidemiology in the United States. World J Urol. 2012;30(2):195–200.
- Pernar CH, Ebot EM, Wilson KM, et al. The epidemiology of prostate cancer. Cold Spring Harb Perspect Med. 2018;8(12):a030361–18.
- Draisma G, Etzioni R, Tsodikov A, et al. Lead time and overdiagnosis in prostate-specific antigen screening: importance of methods and context. J Natl Cancer Inst. 2009;101(6):374–383.
- Albertsen PC. Observational studies and the natural history of screen-detected prostate cancer. Curr Opin Urol. 2015;25(3):232–237.
- Komura K, Sweeney CJ, Inamoto T, et al. Current treatment strategies for advanced prostate cancer. Int J Urol. 2018;25(3):220–231.
- Jahn JL, Giovannucci EL, Stampfer MJ. The high prevalence of undiagnosed prostate cancer at autopsy: implications for epidemiology and treatment of prostate cancer in the prostate-specific antigen-era. Int J Cancer. 2015;137(12):2795–2802.
- Giovannucci E, Liu Y, Platz EA, et al. Risk factors for prostate cancer incidence and progression in the health professionals follow-up study. Int J Cancer. 2007;121(7):1571–1578.
- Platz EA, De Marzo AM, Giovannucci E. Prostate cancer association studies: pitfalls and solutions to cancer misclassification in the PSA era. J Cell Biochem. 2004;91(3):553–571.
- Hurwitz LM, Agalliu I, Albanes D, et al. Recommended definitions of aggressive prostate cancer for etiologic epidemiologic research. J Natl Cancer Inst. 2021;113(6):727–734.
- Amin MB, Greene FL, Edge SB, et al. The eighth edition AJCC cancer staging manual: continuing to build a bridge from a population-based to a more "personalized" approach to cancer staging. CA Cancer J Clin. 2017;67(2):93–99.
- Garcia-Marques F, Liu S, Totten SM, et al. Protein signatures to distinguish aggressive from indolent prostate cancer. Prostate. 2022;82(5):605–616.
- Langseth H, Gislefoss RE, Martinsen JI, et al. Cohort profile: the janus serum bank cohort in Norway. Int J Epidemiol. 2017;46(2):403–404g. g
- Hjerkind KV, Gislefoss RE, Tretli S, et al. Cohort profile update: the janus serum bank cohort in Norway. Int J Epidemiol. 2017;46(4):1101–1102f. f
- Norwegian Prostate Cancer Registry. Årsrapport for prostatakreft 2021. [Annual Report 2021]. Norwegian Oslo: Cancer Registry of Norway; 2022.
- Larsen IK, Småstuen M, Johannesen TB, et al. Data quality at the cancer registry of Norway: an overview of comparability, completeness, validity and timeliness. Eur J Cancer. 2009;45(7):1218–1231.
- Fagerland MW, Lydersen S, Laake P. The McNemar test for binary matched-pairs data: mid-p and asymptotic are better than exact conditional. BMC Med Res Methodol. 2013;13:91.
- Landis JR, Koch GG. The measurement of observer agreement for categorical data. Biometrics. 1977;33(1):159–174.
- Lydersen S, Fagerland MW, Laake P. Categorical data and contingency tables. In Veierod MB, Lydersen S, Laake P, editors. Medical statistics in clinical and epidemiological research. 1th ed. Oslo, Norway: Gyldendal Akademisk; 2012. p. 48–89.
- Breidablik HJ, Meland E, Aakre KM, et al. PSA measurement and prostate cancer – overdiagnosis and overtreatment? Tidsskr Nor Laegeforen. 2013;133(16):1711–1716.
- Sandhu S, Moore CM, Chiong E, et al. Prostate cancer. Lancet. 2021;398(10305):1075–1090.
- Desai MM, Cacciamani GE, Gill K, et al. Trends in incidence of metastatic prostate cancer in the US. JAMA Netw Open. 2022;5(3):e222246.
- Cook RJ. Kappa and its dependence on marginal rates. Encyclopedia of Biostatistics. Wiley StatsRef; 2005.
- Hernes E, Johansson LA, Fosså SD, et al. High prostate cancer mortality in Norway evaluated by automated classification of medical entities. Eur J Cancer Prev. 2008;17(4):331–335.
- Löffeler S, Halland A, Weedon-Fekjær H, et al. High Norwegian prostate cancer mortality: evidence of over-reporting. Scand J Urol. 2018;52(2):122–128.
- Statistics Norway. Statistikkbanken: Immigrants and Norwegian-born to immigrant parents statistics Norway. Oslo, Norway: Statistics Norway; 2022 [cited Apr 14].