
Abstract
Background
The irradiation of sub-regions of the parotid has been linked to xerostomia development in patients with head and neck cancer (HNC). In this study, we compared the xerostomia classification performance of radiomics features calculated on clinically relevant and de novo sub-regions of the parotid glands of HNC patients.
Material and Methods
All patients (N = 117) were treated with TomoTherapy in 30–35 fractions of 2–2.167 Gy per fraction with daily mega-voltage-CT (MVCT) acquisition for image-guidance purposes. Radiomics features (N = 123) were extracted from daily MVCTs for the whole parotid gland and nine sub-regions. The changes in feature values after each complete week of treatment were considered as predictors of xerostomia (CTCAEv4.03, grade ≥ 2) at 6 and 12 months. Combinations of predictors were generated following the removal of statistically redundant information and stepwise selection. The classification performance of the logistic regression models was evaluated on train and test sets of patients using the Area Under the Curve (AUC) associated with the different sub-regions at each week of treatment and benchmarked with the performance of models solely using dose and toxicity at baseline.
Results
In this study, radiomics-based models predicted xerostomia better than standard clinical predictors. Models combining dose to the parotid and xerostomia scores at baseline yielded an AUCtest of 0.63 and 0.61 for xerostomia prediction at 6 and 12 months after radiotherapy while models based on radiomics features extracted from the whole parotid yielded a maximum AUCtest of 0.67 and 0.75, respectively. Overall, across sub-regions, maximum AUCtest was 0.76 and 0.80 for xerostomia prediction at 6 and 12 months. Within the first two weeks of treatment, the cranial part of the parotid systematically yielded the highest AUCtest.
Conclusion
Our results indicate that variations of radiomics features calculated on sub-regions of the parotid glands can lead to earlier and improved prediction of xerostomia in HNC patients.
Background
Radiation therapy plays a key role in the treatment of patients diagnosed with Head and Neck Cancer (HNC). Despite recent technological advances in radiotherapy delivery [Citation1], a large proportion of HNC patients treated suffer from radiation-induced xerostomia [Citation2,Citation3], which is related to hypo-salivation and significantly impacts the quality of life.
Irradiation of the parotid glands disrupts salivary secretion and the mean dose to the parotids has been shown to predict xerostomia [Citation4,Citation5]. This approach, however, does not take the anatomical complexity of the glands into consideration and could therefore be refined [Citation6]. Several studies have shown that key sub-regions of the parotid glands may play distinct functions in saliva production and recovery from irradiation.
Van Luijk et al. have shown in rats that irradiation of the salivary ducts, found to contain stem and progenitor cells, leads to a loss of regenerative capacity, resulting in long-term gland dysfunction [Citation7]. They also found in a cohort of HNC patients that the radiation dose to the stem cells centre (SCC) predicts the function of the salivary glands one year after radiotherapy. In another study, the sparing of parotid ducts during the radiotherapy treatment of 38 patients resulted in a reduction of patient-rated xerostomia [Citation8]. In parallel, Miah et al. have shown that bilateral superficial lobe parotid-sparing intensity-modulated radiotherapy leads to a reduction in the incidence of high-grade xerostomia compared with contralateral parotid-sparing intensity-modulated radiotherapy [Citation9]. These studies indicate that sub-regions of the parotid glands differ in radio sensitivity.
Radiomics is an emerging field in which features extracted from medical images are used to uncover disease or treatment response characteristics. In several studies, imaging biomarkers extracted from the parotid glands from various imaging techniques were found to enhance the prediction of xerostomia [Citation10–13]. Despite the promising results and the potential of this approach, the predictive power of radiomics analyses is sensitive to several factors, including image acquisition parameters [Citation14–17]. As a result, the performance of radiomics analysis in predicting an outcome is not simply a function of the clinical/anatomical significance of the region studied.
Image-guidance (IG) is now commonly used in radiotherapy where its primary purpose is to improve the accuracy of the dose delivery [Citation18–20]. However, these images may also contain information on the patient-specific response to treatment. Several studies have demonstrated, for various sites including HNC, the predictive potential of radiomics calculated on IG scans [Citation21–24]. Using such an approach, van Dijk et al. found that the variations of radiomics features of the parotid glands on weekly diagnostic quality CTs of HNC patients improved the prediction of late xerostomia compared to a dose-based model [Citation25]. Whilst these studies have demonstrated that radiomics can be used for predicting xerostomia from the whole gland, the predictive power of the sub-regions has not been investigated.
The aim of our study was to compare the performance of radiomics features calculated on sub-regions of the parotid glands for predicting xerostomia.
Material and methods
A total of 117 HNC patients treated with external beam RT at Addenbrooke’s hospital in Cambridge between 2014 and 2017 recruited to the VoxTox study (UK CRN ID 13716) [Citation26,Citation27], were selected for analysis. Toxicity, which was prospectively collected based on the Common Terminology Criteria for Adverse Events (CTCAEv4.03) scoring system, was reported for 112 patients at 6 months and 95 patients at 12 months. The endpoint of interest was moderate-to-severe xerostomia after radiotherapy and was defined by a toxicity score ≥ 2. The treatment characteristics and relevant clinical information are detailed in . All patients were treated with 30–35 fractions of 2–2.167 Gy per fraction on a TomoTherapy HiArt System (Accuray, Sunnyvale, CA, USA). For the purpose of image-guidance, Mega Voltage CT (MVCT) images (voxel dimensions: 0.7647 × 0.7647 × 6 mm3) were acquired daily. Following enhancements of the quality assurance programme, HU stability of the TomoTherapy machines improved between 2014 and 2017, corresponding to the time interval of patient selection [Citation28]. Relevant target-related and organ-at-risk contours, including the parotid glands, were delineated using the approach described in the previously published article [Citation23]. In particular, parotid glands were contoured by experienced clinicians on planning CTs and propagated to daily MVCTs using a deformable image registration algorithm. An illustration of contra-lateral parotid contours on MVCTs can be seen in Supplementary Material A for one patient who reported xerostomia at 6 and 12 months after radiotherapy and one that did not.
Table 1. demographic and treatment characteristics.
Radiomics and statistical analyses were performed using MatLab (Mathworks, Natick, MA, USA) software. In order to extract features from specific regions of the contra-lateral parotid glands, their contours on MVCTs were divided into nine sub-regions comprising those previously found to be associated with xerostomia as well as de novo sub-regions derived in this work. The corresponding masks of these sub-regions, which were defined based on geometric patterns of the parotid contours as well as bony landmarks as detailed in the following paragraphs, are illustrated in . The Field Of View of the MVCTs has a maximum extent in the cranio-caudal direction. As a result, the scans did not systematically include the whole parotid glands for all fractions. The regions were therefore not consistently composed of the same number of slices for the same patient and occasionally missed some fractions. The number of patients for which the regions were successfully calculated on all 30 fractions is shown in Supplementary Material B.
Figure 1. Illustration of 8 of the 10 parotid gland regions on a transversal slice. (A) whole parotid gland; (B) deep lobe; (C) superficial lobe; (D) disc around the SCC (radius 9 pixels); (E) outer layer; F) middle layer; (G) inner layer; (H) disc around the centre of mass (radius 9 pixels). The remaining two regions are defined based on the cranio-caudal axis and could not be illustrated on this figure. The red cross illustrates the SCC and is used with the green cross to define the border between the two lobes. The centre of mass of the parotid contour is shown by a red dot. The outer contour of the parotid is shown in blue and the region of interest is highlighted by a red line.
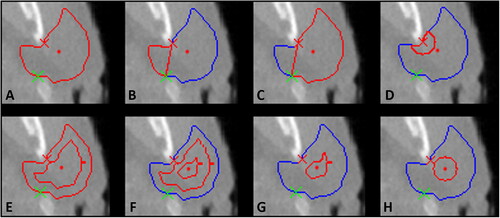
First, the parotid glands were divided into three layers including internal regions of the gland. This was done in three dimensions by eroding the original parotid contour to produce three equally spaced layers between the exterior border of the contour and the core of the gland, as shown in (E, F and G) (outer, middle and inner layer). In this way, any isotropic shrinkage of the gland would impact the layers in proportion.
Two regions were defined along the cranio-caudal axis (caudal part and cranial part) to investigate the potential of radiomics calculated on these regions for predicting xerostomia. To account for the reproducibility issues previously discussed, the parotid glands were split into two regions using the slice with a maximum volume as the border. This is shown in (left graph) and allows for consistency in the cranial/caudal definition across all fractions.
Figure 2. Volume of the slices composing a parotid gland: Illustration of the superior-inferior extension of caudal, cranial parts and SCC region.
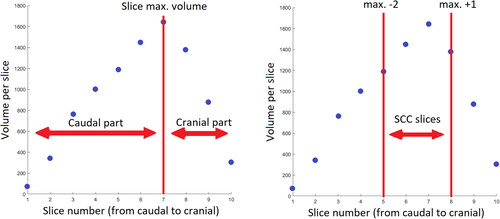
The centre of the stem cell active region was defined based on the findings of van Luijk et al. as located next to the dorsal edge of the mandible [Citation7]. A sub-region directly originating from this location was defined as a disc of a radius of 9 pixels (disc SCC R09) centred on the SCC (D)). As the extent of the stem cell active region is not known with certainty, another sub-region was defined as a disc of 9 pixels in radius centred on the parotid’s centre of mass CofM (disc CofM R09) on transversal slices ((H)).
For inter-patient consistency and to exclude slices away from the SCC, the two regions mentioned above (disc SCC R09 and disc CofM R09) were defined on a maximum of 4 MVCT slices centred on the slice with the maximum parotid gland volume (, right graph).
Using the definition of Zhang et al. the parotid glands were split into deep and superficial lobes, with a boundary stretching from the stylomastoid foramen to the posterior border of the mandible [Citation29]. The border of these two complementary regions includes the SCC as shown in by the red crosses.
Finally, the parotid gland was considered as a whole and was used as a reference.
Textural features were calculated on a total of nine sub-regions of the contra-lateral parotid gland as well as on the whole structure. At each fraction and for each region,
a total of 123 features listed in Supplementary Material C and defined according to the Image Biomarker Standardisation Initiative (IBSI) [Citation30,Citation31] were extracted. The scripts used for feature calculation were benchmarked using reference values provided on the IBSI website.
In this article, we provide an overview of the key steps of data analysis. A full description of the methods used for radiomics feature extraction and selection can be found in Figure 1 of the following publication [Citation23].
The present study is based on the analysis of day-to-day kinetics of radiomics features. For this purpose, the slopes of the regressions between the first and fractions 5, 10, 15, 20, 25 and 30, which quantify the variation in feature value that occurred during the treatment, were extracted and considered as potential predictors of xerostomia. This resulted, for each region studied, in 123 slopes for every week after the start of treatment, the slopes were considered as potential predictors of xerostomia after being standardised.
The TRIPOD (Transparent Reporting of a multivariable prediction model for Individual Prognosis Or Diagnosis) checklist showing our adherence to this initiative can be found in Supplementary Material D. Also, the predictive performance of our models was estimated in compliance with its recommendations [Citation32].
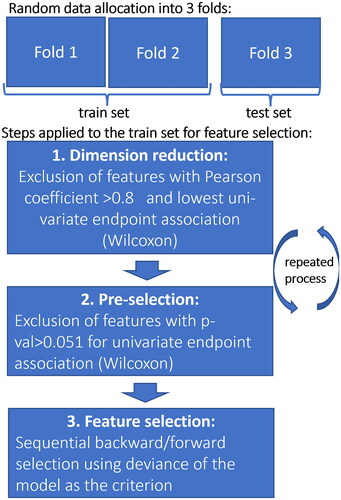
The selection process of the predictors consisted of three phases and was used to choose amongst the 123 predictors available at each week of treatment for every region as illustrated in and described in detail in this previously published article [Citation23]. In summary, to form the combinations of predictors, the selection process involved the removal of statistically redundant information and backwards forward stepwise selection carried out on a sub-set composed of two-thirds of the patients: the train set. This same set was used to adjust the parameters of a logistic regression model of every selected combination and to evaluate its predictive power; then, the model was applied to the remaining third of the patients: the test set. This was evaluated by the Area Under the receiver operating Curve (AUC), resulting in AUCtrain and AUCtest values. For robustness, the three folds were rotated (cross-validation); this process was repeated 100 times for each combination of predictors selected.
Figure 3. Flowchart showing the selection process for the predictors.
The AUCtrain and AUCtest of the selected combinations of predictors were plotted in as a function of time since the start of treatment.
Figure 4. Predictive power (AUCtrain in panel (A) and AUCtest in panel (B)) of the 10 regions studied from predictors generated at the end of every week of treatment and for the two follow-up times: 6 and 12 months. SCC: stem cell centre; CofM: centre of mass; R: radius (in pixels). The magenta dots show the AUCs of models that solely used mean dose to the contra-lateral parotid gland and baseline xerostomia scores as predictors.
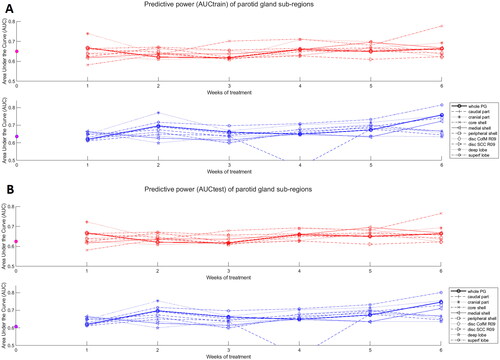
Also, to determine the potential advantage of this radiomics sub-regional analysis compared to conventional approaches, AUCtrain and AUCtest of logistic regression models including mean dose to the contra-lateral parotid gland as well as xerostomia at baseline plotted in (magenta dots).
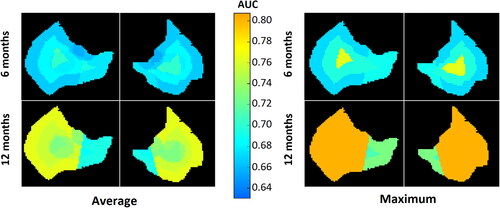
Finally, to visualise the predictive power of the different parts of the parotid glands, the average AUCtest per voxel across all sub-regions as well as the maximum AUCtest value was calculated and plotted in .
Figure 5. Average and maximum AUCtest across all sub-regions in colour-wash for 6, and 12 months of follow-up illustrated on a transversal slice of two parotid glands.
Results
The proportion of patients with moderate-to-severe xerostomia was 46% at 6 months and 33% at 12 months after radiotherapy. The predictive performance of logistic regression models based on mean dose to the contra-lateral parotid gland combined with xerostomia scores at baseline decreased for longer follow-up times, with an AUCtest of 0.63 and 0.61 at 6 and 12 months. Overall, radiomics-based models were found to outperform models solely based on clinical factors, and followed an opposite trend with an improvement at predicting xerostomia for longer follow-up times with a maximum AUCtest reaching 0.76 and 0.80 at 6 and 12 months. The models are listed in detail in Supplementary Material E.
When looking across all six weeks of treatment, the sub-regions that yielded identical or higher AUCtest compared to the whole parotid were: the core-shell and cranial part for predicting xerostomia at 6 months with AUCtest of 0.76 and 0.72 respectively (compared to 0.67 for the whole parotid), and the superficial lobe and the cranial part for predicting xerostomia at 12 months with AUCtest of 0.80 and 0.75, respectively (0.75 for the whole parotid).
Considering only the slopes from the first week and first two weeks of treatment, which would leave at least four weeks for treatment adaptation if the patient selection was performed based on these, the cranial part of the parotid was systematically the sub-region yielding the highest AUCtest with 0.72 at 6 months and 0.75 at 12 months (0.67 and 0.70 for the whole gland on this time-interval).
The superficial lobe yielded better predictors compared to the deep lobe at 12 months with AUCtest gains of 0.14 while it was a worse predictor at 6 months by 0.02 (from 0.67 to 0.69). The performance of the stem cell active region (disc SCC R09) was systematically worse than that of the whole parotid with an AUCtest lower by 0.03 and 0.07 at 6 and 12 months, respectively.
Discussion
Using the contralateral parotid gland, radiomics classification performance was found to be better than that of the whole parotid gland for 2 sub-regions at 6 months and 2 sub-regions at 12 months. Overall, the prediction was found to be better at 12 months than at 6 months with an AUCtest of 0.80 compared to 0.76, across regions and for all six weeks of treatment. This trend is, in this study, found to be opposite to standard models solely based on clinical factors, indicating that radiomics analysis of the parotids may be particularly useful for predicting long-term toxicity. Also, because radiomics analysis of sub-regions of the parotid gland (i.e. cranial part) within the first two weeks of treatment yields a high classification performance, there may be scope for selecting patients for treatment adaptation with this approach.
Some of the regions that we found to be associated with better prediction of xerostomia correspond to regions identified in the literature as radio-sensitive. In particular, we found that the variations in features extracted from the cranial part of the parotid glands were similar or stronger predictors of xerostomia for all follow-up times compared to those calculated on the whole gland. After only two weeks of radiotherapy treatment, the cranial part of the parotid was systematically the best-performing region with an AUCtest of 0.72 at 6 months and 0.75 at 12 months (0.67 and 0.70 for the whole gland). This increased classification performance early in the treatment is a great advantage as it would leave the remaining four weeks of treatment for the patients to benefit from individualised approaches. Such personalised strategies could consist of the introduction of stricter dose constraints to the parotids or of a complete replanning, which would tailor the treatment plan to the new anatomy of the patient, compensating for morphological changes.
Konings et al. found that in rats the irradiation of the cranial part of the parotid glands resulted in a more severe late reduction in flow rate compared to the irradiation of the caudal part [Citation6]. In addition, Guo et al. found that, in HNC patients, a lower dose to the superior portion of the two parotid glands was associated with a greater chance of xerostomia recovery [Citation33]. Conversely, Han et al. found that the dose to the middle and inferior parts of the contralateral parotid glands were stronger predictors of injury compared to other regions [Citation34]. However, they found recovery, to be associated with dose to the superior part of the contralateral parotid and middle and superior parts of the ipsilateral gland.
Buettner et al. following a detailed analysis of the dosimetry data from the PARSPORT clinical trial, reported that the lateral-cranial part of the deep lobe was more sensitive to xerostomia than other parts of the glands [Citation35]. In this study, we found that the superficial lobe had a similar classification performance compared to the whole parotid at 6 months but markedly higher at 12 months with an AUCtest of 0.80 compared to 0.75. These results are aligned with those of previous studies suggesting that the irradiation of the superficial lobe may play an important role in the development of xerostomia [Citation9,Citation36,Citation37].
The work of Jeong et al. and van Luijk et al. has contributed significantly to understanding the key role that stem cells play in xerostomia development following irradiation [Citation7,Citation38]. In this study, we found that the sub-region that included the SCC was generally a worse predictor of xerostomia compared to the whole parotid. A potential explanation of this result may be that when applying texture analysis, a compromise must be reached between the narrowing of the region and the quality and resolution of the images. For example, a more radio-sensitive region may be expected to increase the prediction of xerostomia; however, the size of the region needs to be sufficient for the feature calculations to be meaningful and robust.
Whilst we found that some sub-regions, known to be radio-sensitive, yielded better predictors of xerostomia, these results should be interpreted with caution. The features extracted from the MVCTs are assumed to reflect the biological processes taking place during treatment although there are many other parameters that affect this association. The resolution and the quality of the images are for example obvious limiting factors.
It is important to keep in mind that our findings are a result of a single institution, single modality study that would benefit from external collaborations, as currently being promoted by recent initiatives [Citation32,Citation39,Citation40]. In particular, the extent of the clinical utility of our findings vastly depends on their generalisability. It would be especially interesting to investigate whether the present findings may be corroborated by images from other modalities, such as the widely used Cone-Beam CT, as, if demonstrated, this would substantially increase the scope and the associated clinical benefits for the patients.
In conclusion, our study indicates that variations of radiomics features calculated on sub-regions of the parotid glands from daily MVCTs can lead to earlier and improved prediction of late xerostomia in HNC patients compared to analysis of the whole gland. Strategies to use such information to individualise treatment approaches may be clinically worthwhile.
Supplemental Material
Download MS Word (11.7 KB)Supplemental Material
Download MS Excel (14.5 KB)Supplemental Material
Download MS Power Point (237.3 KB)Supplemental Material
Download MS Excel (10.3 KB)Supplemental Material
Download MS Word (13.3 KB)Supplemental Material
Download PNG Image (194 KB)
Acknowledgements
The authors gratefully acknowledge the support of (1) the VoxTox and computational Oncology group at the University of Cambridge and (2) the staff in the Department of Oncology Physics at the Edinburgh Cancer Centre and the Institute for Digital Communications, College of Science and Engineering at the University of Edinburgh.
Disclosure statement
The authors report no conflicts of interest. The authors alone are responsible for the content and writing of the paper.
Data availability statement
The data analysed in this work are available upon reasonable request.
Additional information
Funding
References
- Berger T, Noble DJ, Shelley LEA, et al. 50 Years of radiotherapy research: evolution, trends and lessons for the future. Radiother Oncol. 2021;165:75–86.
- Wijers OB, Levendag PC, Braaksma MMJ, et al. Patients with head and neck cancer cured by radiation therapy: a survey of the dry mouth syndrome in long-term survivors. Head Neck. 2002;24(8):737–747.
- Sim CPC, Soong YL, Pang EPP, et al. Xerostomia, salivary characteristics and gland volumes following intensity-modulated radiotherapy for nasopharyngeal carcinoma: a two-year follow up. Aust Dent J. 2018;63(2):217–223.
- Owosho AA, Thor M, Oh JH, et al. The role of parotid gland irradiation in the development of severe hyposalivation (xerostomia) after intensity-modulated radiation therapy for head and neck cancer: temporal patterns, risk factors, and testing the QUANTEC guidelines. J Craniomaxillofac Surg. 2017;45(4):595–600.
- Gabryś HS, Buettner F, Sterzing F, et al. Parotid gland mean dose as a xerostomia predictor in low-dose domains. Acta Oncol. 2017;56(9):1197–1203.
- Konings AWT, Cotteleer F, Faber H, et al. Volume effects and region-dependent radiosensitivity of the parotid gland. Int J Radiat Oncol Biol Phys. 2005;62(4):1090–1095.
- Van Luijk P, Pringle S, Deasy JO, et al. Sparing the region of the salivary gland containing stem cells preserves saliva production after radiotherapy for head and neck cancer. Sci Transl Med. 2015;7(305):305ra147.
- Fried D V, Zhu T, Das SK, et al. Prospective assessment of sparing the parotid ducts via MRI sialography for reducing patient reported xerostomia. Radiother Oncol. 2022;172:42–49.
- Miah AB, Gulliford SL, Morden J, et al. Recovery of salivary function: contralateral parotid-sparing intensity-modulated radiotherapy versus bilateral superficial lobe parotid-sparing intensity-modulated radiotherapy. Clin Oncol. 2016;28(9):e69–76–e76.
- van Dijk LV, Brouwer CL, van der Schaaf A, et al. CT image biomarkers to improve patient-specific prediction of radiation-induced xerostomia and sticky saliva. Radiother Oncol. 2017;122(2):185–191.
- van Dijk LV, Thor M, Steenbakkers RJHM, et al. Parotid gland fat related magnetic resonance image biomarkers improve prediction of late radiation-induced xerostomia. Radiother Oncol. 2018;128(3):459–466.
- van Dijk LV, Noordzij W, Brouwer CL, et al. 18 F-FDG PET image biomarkers improve prediction of late radiation-induced xerostomia. Radiother Oncol. 2018;126(1):89–95.
- Wilkie JR, Mierzwa ML, Casper KA, et al. Predicting late radiation-induced xerostomia with parotid gland PET biomarkers and dose metrics. Radiother Oncol. 2020;148:30–37.
- Yip SSF, Aerts HJWL. Applications and limitations of radiomics. Phys Med Biol. 2016;61(13):R150–166.
- Mayerhoefer ME, Materka A, Langs G, et al. Introduction to radiomics. J Nucl Med. 2020;61(4):488–495.
- Piotrowski T, Gintowt K, Jodda A, et al. Impact of the intra- and inter-observer variability in the delineation of parotid glands on the dose calculation during head and neck helical tomotherapy. Technol Cancer Res Treat. 2015;14(4):467–474.
- Berger T, Noble DJ, Yang Z, et al. Assessing the generalisability of radiomics features previously identified as predictive of radiation-induced sticky saliva and xerostomia. Phys Imaging Radiat Oncol. 2022;25:100404.
- Ghadjar P, Fiorino C, Munck af Rosenschöld P, et al. ESTRO ACROP consensus guideline on the use of image guided radiation therapy for localized prostate cancer. Radiother Oncol. 2019;141:5–13.
- Bell K, Licht N, Rübe C, et al. Image guidance and positioning accuracy in clinical practice: influence of positioning errors and imaging dose on the real dose distribution for head and neck cancer treatment. Radiat Oncol. 2018;13(1):190.
- Berger T, Fokdal LU, Assenholt MS, et al. Robustness of elective lymph node target coverage with shrinking planning target volume margins in external beam radiotherapy of locally advanced cervical cancer. Phys Imaging Radiat Oncol. 2019;11:9–15.
- Rosen BS, Hawkins PG, Polan DF, et al. Early changes in serial CBCT-measured parotid gland biomarkers predict chronic xerostomia after head and neck radiation therapy. Int J Radiat Oncol Biol Phys. 2018;102(4):1319–1329.
- van Timmeren JE, Leijenaar RTH, van Elmpt W, et al. Survival prediction of non-small cell lung cancer patients using radiomics analyses of cone-beam CT images. Radiother Oncol. 2017;123(3):363–369.
- Berger T, Noble DJ, Shelley LEA, et al. Predicting radiotherapy-induced xerostomia in head and neck cancer patients using day-to-day kinetics of radiomics features. Phys Imaging Radiat Oncol. 2022;24:95–101.
- Sellami S, Bourbonne V, Hatt M, et al. Predicting response to radiotherapy of head and neck squamous cell carcinoma using radiomics from cone-beam CT images. Acta Oncol. 2022;61(1):73–80.
- van Dijk LV, Langendijk JA, Zhai TT, et al. Delta-radiomics features during radiotherapy improve the prediction of late xerostomia. Sci Rep. 2019;9(1):1–8.
- Burnet NG, Adams EJ, Fairfoul J, et al. Practical aspects of implementation of helical tomotherapy for intensity-modulated and image-guided radiotherapy. Clin Oncol (R Coll Radiol). 2010;22(4):294–312.
- Burnet NG, Scaife JE, Romanchikova M, et al. Applying physical science techniques and CERN technology to an unsolved problem in radiation treatment for cancer: the multidisciplinary “VoxTox” research programme. CERN Ideasq J Exp Innov. 2017;1(1):3–12.
- Thomas SJ, Romanchikova M, Harrison K, et al. Recalculation of dose for each fraction of treatment on TomoTherapy. Br J Radiol. 2016;89(1059):20150770.
- Zhang HB, Lu X, Huang SM, et al. Superficial parotid lobe–sparing delineation approach: a better method of dose optimization to protect the parotid gland in intensity-modulated radiotherapy for nasopharyngeal carcinoma. Current Oncology. 2013;20(6):e577–584.
- Zwanenburg A, Vallières M, Abdalah MA, et al. The image biomarker standardization initiative: standardized quantitative radiomics for high-throughput image-based phenotyping. Radiology. 2020;295(2):328–338.
- The image biomarker standardisation initiative — IBSI 0.0.1dev documentation [Internet]. [cited 2021 Dec 23]. Available from: https://ibsi.readthedocs.io/en/latest/#%0Ahttps://ibsi.readthedocs.io/en/latest/.
- Moons KGM, Altman DG, Reitsma JB, et al. Transparent reporting of a multivariable prediction model for individual prognosis or diagnosis (TRIPOD): explanation and elaboration. Ann Intern Med. 2015;162(1):W1–73.
- Guo Y, Jiang W, Lakshminarayanan P, et al. Spatial radiation dose influence on xerostomia recovery and its comparison to acute incidence in patients with head and neck cancer. Adv Radiat Oncol. 2020;5(2):221–230.
- Han P, Lakshminarayanan P, Jiang W, et al. Dose/volume histogram patterns in salivary gland subvolumes influence xerostomia injury and recovery. Sci Rep. 2019;9(1):3616.
- Buettner F, Miah AB, Gulliford SL, et al. Novel approaches to improve the therapeutic index of head and neck radiotherapy: an analysis of data from the PARSPORT randomised phase III trial. Radiother Oncol. 2012;103(1):82–87.
- Nevens D, Nuyts S. Can sparing of the superficial contralateral parotid lobe reduce xerostomia following radiotherapy for head and neck cancer? Br J Radiol. 2017;90(1080):20170596.
- Kawamoto T, Nihei K, Nakajima Y, et al. Comparison of xerostomia incidence after three-dimensional conformal radiation therapy and contralateral superficial lobe parotid-sparing intensity-modulated radiotherapy for oropharyngeal and hypopharyngeal cancer. Auris Nasus Larynx. 2018;45(5):1073–1079.
- Jeong J, Baek H, Kim YJ, et al. Human salivary gland stem cells ameliorate hyposalivation of radiation-damaged rat salivary glands. Exp Mol Med. 2013;45(11):e58–e58.
- Ibrahim A, Primakov S, Beuque M, et al. Radiomics for precision medicine: current challenges, future prospects, and the proposal of a new framework. Methods. 2021;188:20–29.
- Platform – E2-RADIatE [Internet]. [cited 2021 Dec 23]. Available from: https://project.eortc.org/e2-radiate/platform/.