
 ?Mathematical formulae have been encoded as MathML and are displayed in this HTML version using MathJax in order to improve their display. Uncheck the box to turn MathJax off. This feature requires Javascript. Click on a formula to zoom.
Abstract
Background
Stereotactic body radiotherapy (SBRT) is an effective therapeutic approach in patients with liver metastases. However, long-term changes in hepatic normal tissue have to be taken into account in multimodal treatment regimes. Magnetic-resonance-imaging (MRI) based morphologic liver alterations (MMA) after liver SBRT have been analyzed longitudinally.
Material and methods
57 patients treated with gantry-based or robotic-based SBRT of 69 treatment volumes of liver metastases, who had long-term follow-up (FU) ≥6 months were included in this retrospective analysis. Post-SBRT MMAs were contoured on each contrast-enhanced-T1-weighted (T1w) MRI-sequence. Morphologic/volumetric data of the liver and MMAs were evaluated longitudinally, including the dependency on treatment-related factors of the planning target volume (PTV) and liver.
Results
The median FU time was 1 year [6–48 months]. 66 of 69 treatment volumes developed MMAs (mean 143.8 ± 135.1 ccm at first appearance). 31.8% of MMAs resolved completely during FU. Of the persisting MMAs 82.2%/13.3% decreased/increased in size until last available FU. Morphological characterization of the MMAs at first appearance included 75% hypointense and 25% hyperintense T1w-MRI-based appearances. Hypointense as compared to hyperintense appearance was significantly associated with a higher mean liver dose EQD2α/β=3 Gy (p = 0.0212) and non-significantly greater MMA size. Variance analysis demonstrated a significant reduction of MMA and total liver volume after SBRT (p < 0.0001). The volume reduction decelerated longitudinally for both MMA (p < 0.0001) and liver size (p = 0.0033). Radiation doses (PTV-BEDα/β=3 Gy and 10 Gy) were not significantly associated with MMA volume reduction. SBRT of liver metastases with mean liver dose EQD2α/β=3 Gy > 18 Gy were characterized by greater MMA volumes (p = 0.0826) and steeper MMA reduction gradients during FU than those with EQD2α/β=3 Gy ≤ 18 Gy (p < 0.0001).
Conclusion
Radiogenic MMAs either completely resolve or usually decrease in volume with pronounced reduction during short-term FU. This course was independent of the MMA’s morphological appearance. Further, increased mean liver dose was associated with greater MMA size and a greater gradient of MMA size reduction during FU.
Background
In the framework of oligometastatic disease, SBRT can be effectively used for liver metastases with high local control and low toxicity rates [Citation1–3]. However, the application of this locally ablative treatment approach requires specific technical preparations and quality assurance to ensure precision and preservation of surrounding normal tissue [Citation4,Citation5]. Overall toxicity by means of radiation induced liver disease (RILD) reported after SBRT in a non-cirrhotic liver is rare [Citation6]. If toxicity occurs in non-cirrhotic patients, it is mostly caused by violation of dose constraints to surrounding healthy serial organs such as stomach, intestines and central biliary structures rather than by toxicity to the liver itself [Citation7]. However, radiotherapy in a cirrhotic liver could lead to fulminant typical or atypical RILD [Citation6–8]. Radiation tolerance doses of cirrhotic or chemotherapy-induced damaged liver is yet to be specifically quantified [Citation9].
Dose-dependent morphologic alterations of peritumoral healthy liver tissue corresponding to veno-occlusive disorders and evidenced by computed tomography (CT) or magnetic resonance imaging (MRI) have been previously described with specific focus on the early phase after SBRT [Citation10]. Furthermore, threshold doses for beam-path-like MRI-morphologic alterations (MMAs) at 6–9 weeks post-SBRT have been established at Equivalent Dose in 2 Gy fractions with α/β = 2–3 Gy (EQD2α/β=2–3 Gy) 38–42 Gy for image guided, gantry-based SBRT (G-SBRT) [Citation11–13] and 79–91 Gy for concentric MMAs after robotic SBRT (R-SBRT) [Citation10] for healthy liver tissue surrounding the gross target volume (GTV).
Post-SBRT transient laboratory alterations, namely albumin reduction and liver enzymes elevation have been also observed; nevertheless, a correlation with MMAs has not been established to date [Citation2,Citation14,Citation15]. Evidence on clinical impact and evolution of these MMAs remains unclear; they could, however, serve as an in-vivo surrogate of dose-delivery accuracy [Citation16].
On this basis, patients with long-term overall survival should receive regular liver-directed imaging to detect and document late post-SBRT toxicity, as scarce data are available for follow-up (FU) periods longer than 2–3 years.
Herein, long-term characterization of the evolution of post-SBRT MMAs and its correlation to treatment-related factors from a pooled multicenter cohort treated with actively motion-managed liver SBRT is reported.
Material and methods
Patient characteristics and longitudinal morphologic assessment on MRI
Long-term FU (≥6 months after treatment) MRIs were evaluated retrospectively from a multicenter pooled cohort of 135 patients with a total of 227 liver metastases from diverse primary tumors, treated with actively motion-managed SBRT.
Long-term MRI-based imaging of 57 patients (long-term survivors with sufficiently long MRI-based FU) being treated in 64 radiation series for a total of 69 treatment volumes (being defined as all directly neighboring liver metastases being treated within one treatment field) made up of cumulative 88 liver metastases was included in this analysis. The data collection encompassed 257 MMA 3D-segmentations in a median of 4 [2–7] control MRIs per treatment volume with a median FU time of 1 year [6 months–4 years FU]. Patients were treated either with G-SBRT (with deep inspiration breath-hold (DIBH)-gating and ultrasound tracking: 39 patients with 44 treatment volumes) or R-SBRT (with real-time fiducial tracking: 18 patients with 25 treatment volumes).
FU MRI examinations were performed at various institutions with homogenized imaging protocols according to internal guidelines of each center. Transversal, contrast enhanced T1-weighted sequences after the application of gadolinium-based contrast agents were used for contouring of the MMAs. MRI series were reviewed by experienced radiation oncologists, being specialized in hepatobiliary SBRT, judging especially contrast enhancement and MMA demarcation as described before [Citation13,Citation16].
All T1-weighted contrast-enhanced MRI sequences were exported to Velocity 4.0 (Varian Medical Systems, Palo Alto, USA) and a deformable matching approach was applied, to ensure that registration suits with the whole liver, in which MMAs were analyzed. The MMAs visible as transition between unaffected and morphologically changed liver tissue were delineated on each MRI (encompassing the whole volume of changes in signal intensity in the liver around the target volume treated with SBRT). The MMAs’ general morphologic appearance as compared to normal liver tissue in T1-weighted contrast-enhanced MRI at baseline was analyzed using an unblinded dichotomized analysis (0/1 = predominantly hyper-/hypointense appearance as compared to normal liver tissue). The extraction of the total liver volume (including the treated liver metastases and MMA thereafter) was based on MRI scans, and if unavailable on CT scans (treatment planning CT). The volumetric data of both MMA and total liver were collected for each FU visit.
Baseline parameters of radiation treatment planning, including PTV size, dose prescription to the PTV converted to Biologically effective Dose (BED): PTV-BEDα/β=3Gy and 10 Gy; and mean dose exposure to the total liver converted to EQD2 (Dmean-L-EQD2α/β=3 Gy) were analyzed. The choice of mean liver dose as a summarizing surrogate parameter for dose exposure to the liver takes into account, that firstly, dose exposure both to the total liver and the locoregional healthy liver tissue might influence the MMA course, and secondly, allows for the robust comparison by a parameter of daily clinical practice. Dmean-L-EQD2α/β=3 Gy = 18 Gy was set as a cutoff point in analysis. The cutoff point was derived from daily clinical practice based on treatment planning constraints of Koay et al. assuming little liver impairment (Child-Pugh Score A) with a mean liver dose of 15 Gy in 3 fractions (converted to Dmean-L-EQD2α/β=3 Gy = 18 Gy) – correspondingly to Son et al. the total liver mean dose was evaluated [Citation17,Citation18].
Endpoints and statistical analysis
Volumetric parameters of liver and MMA measured at 3-, 6-, 9-, 12-, 12–24-, 24–36-, and 36–48-months FU time intervals were analyzed longitudinally by variance analysis with tests of fixed effects and under consideration of potential cofactors. Post-hoc analysis for multiple comparisons was performed under consideration of Scheffe adjustment.
Subgroup-analysis based on dichotomizing factors of the investigated collective (morphological appearance by means of hypo- or hyperintensity, dose exposure to the liver, volume dynamic and disappearance of the MMAs) were performed by variance analysis with tests of fixed effects: differences of MMA parameters between the subgroups and the subgroups’ interaction with time as a parameter of different longitudinal gradients were evaluated.
Statistical differences between subgroups were analyzed by Mann–Whitney U and Kruskal Wallis test. Correlations were tested by Spearman Correlation Coefficient (CC). Comparisons of correlations between two subgroups were performed by covariance analysis. A p-value ≤0.05 was assumed for statistical significance. The analysis was performed with SAS (Statistical Analysis System, SAS Institute, Cary, North Carolina, U.S.).
Results
Descriptive analysis
From the cohort with long-term MRI-based FU, MMAs appeared in 66 of 69 treated liver treatment volumes after SBRT (64 at 3 months, 1 at 6 months and 1 at 9 months FU). The mean PTV size was 88.8 ± 130.7 ccm, the margin size of CTV (clinical target volume) to PTV accounted for 3/5/8 mm in 7%/65%/28%. Regarding treatment regime, 18 different dose prescriptions have been used in the collective – most frequently 5×12 Gy (37.9%) and 3×15 Gy (16.7%). Generally, mean D-PTV-BEDα/β=3 Gy and BEDα/β=10 Gy were 240.9 ± 76.3 Gy and 106.6 ± 28.5 Gy. The mean volume of the MMAs at first appearance was 143.8 ± 135.1 ccm, that characteristically correlated to the delivered dose with path-like/concentric alterations after SBRT [Citation10,Citation13]. Exemplified segmentations of MMA course in the FU are given in .
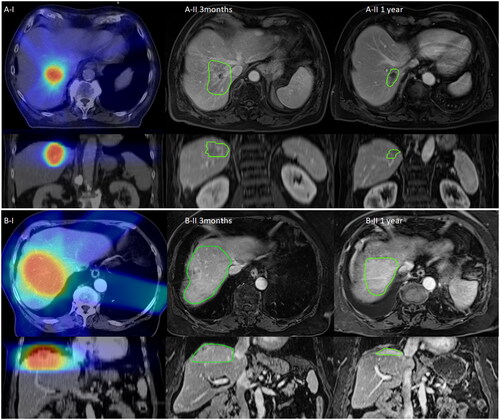
Figure 1. Longitudinal course of exemplified MMAs (MR-morphologic alterations) after SBRT: Exemplified imaging of stereotactic radiotherapy of liver metastases with the longitudinal course of the MMA. Column I demonstrates the dose distribution on the basis of the treatment planning CT (Computed Tomography) scan, Column II 3 months and 1 year demonstrates the longitudinal course of the MMA being contoured with green color. Images of Column II are at the approximately same slice localization as compared to Column I. Section A) demonstrates hypointense as compared to Section B) with hyperintense MMA in transversal (first row) and coronal view (second row).
Longitudinal assessment of MMA
The MMA volumes decreased significantly over time from the mean value 144.9 ± 136.3 ccm at 3 months FU to 22.1 ± 52.6 ccm at 3–4 years FU (p < 0.0001), however PTV margin size, D-PTV-BEDα/β=3 Gy and BEDα/β=10 Gy were not significantly correlated (p = 0.0987, 0.9932 and 0.9027). In post-hoc comparison, MMA volumes at 3 months FU were significantly different from the FU thereafter (each adjusted p ≤ 0.0001–0.0022). Post-hoc comparisons of the MMAs from 6 months FU onwards were not significantly different.
The longitudinal development with absolute values is given in ; equating the baseline MMA at first appearance to 100%, the following MMA volumes in relation to baseline until 3–4 years FU with the mean value of 12.3 ± 26.8% are given in .
Figure 2. Longitudinal course of the mean MMA (MR-morphologic alterations) parameters and mean MMA changes during the follow-up investigations after liver SBRT: Mean values with standard deviation are given longitudinally, population size is indicated by the number at the top of each column in black color. The MMA values are given as absolute parameters (ccm) (A) and relative parameters (%), equating the relative MMA size in relation to the baseline of first appearance with 100% (B) at the specific time points. Mean values of ‘Delta MMA’ parameters (defined as the difference between two consecutive FU time points) with standard deviation are given longitudinally for the different time intervals (C). Spearman correlation coefficient (CC) was significant and negative, demonstrating that the amount of MMA reduction decreases over time and is more pronounced during short-term FU.
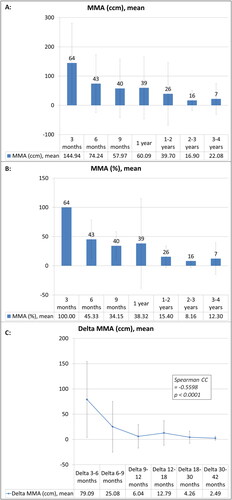
The absolute differences of MMA volumes (Delta-MMA) between consecutive FU time points correlated negatively with the chronological FU time point (Spearman CC −0.5598, p < 0.0001, ), thus demonstrating a decrease of the negative gradient of MMA change from short-term to long-term FU (e.g., mean Delta_3–6 months = 79.1 ± 75.2 ccm and Delta_6–9 months = 25.1 ± 5.1 ccm).
In the following passages subgroup analyses regarding the dichotomized factors are described. For each subgroup analysis the MMA volumes remained significantly dependent on the time after SBRT (p < 0.0001), except for the subgroup with increasing MMA volumes during FU (as described in the consecutive passage).
Subgroup-analysis: morphological appearance of the MMA
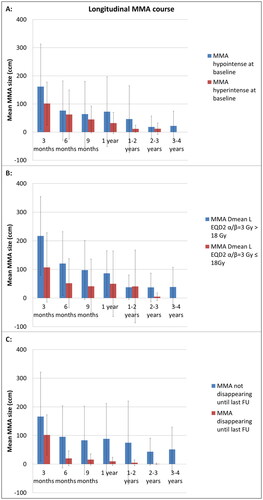
Of 66 MMAs, 75% developed hypointense and 25% hyperintense MMAs at baseline appearance. The MMA volumes were numerically larger for the hypointense subgroup as compared to the hyperintense subgroup () (p = 0.1638). The interaction of morphological appearance and time was not significant (p = 0.5163) – that is to say MMA change over time was not dependent on the morphological appearance.
Figure 3. Longitudinal course of the mean MMA (MR-morphologic alterations) after liver SBRT with regard to different subgroup characteristics: (A) Morphological characteristics of MMA at baseline after liver SBRT (hypointense vs. hyperintense signal intensity in contrast-enhanced, T1-weighted MRI sequence). (B) Dose exposure to the total liver during SBRT (Dmean-L-EQD2α/β=3 Gy >/≤ 18 Gy). (C) Disappearance or persistent demarcation of MMA until last analyzable FU with contrast-enhanced, T1-weighted MRI sequence. The subgroup comparisons (A–C) are displayed by the allocated color of each graph (blue vs. red). Mean MMA values with standard deviation are given longitudinally for the different FU points.
Dmean-L-EQD2α/β=3 Gy was higher for hypointense as compared to hyperintense MMAs (mean 16.1 ± 8.8 vs. 10.4 ± 7.1 Gy, p = 0.0212). The PTV size (p = 0.5170), D-PTV-BEDα/β=3 Gy (p = 0.9465) and BEDα/β=10 Gy (p = 0.9228) were not significantly different between both subgroups.
Subgroup-analysis: dose exposure to the liver
Of 66 MMAs, 68.12% were associated with a Dmean-L-EQD2α/β=3Gy ≤ 18 Gy.
The MMAs were numerically larger in the subgroup with Dmean-L-EQD2α/β=3 Gy > 18 Gy () (p = 0.0826). However, the interaction of dose exposure to the liver with time was significantly influencing the MMA volumes (p < 0.0001) – consequently the gradients (MMA change over time) of the subgroups are different, as demonstrated in : The overall decline from 3 months FU to 6 months FU accounts for a reduction from the mean value 107.1 ± 120.9 ccm to 51.9 ± 85.6 ccm for MMAs with Dmean-L-EQD2α/β=3 Gy ≤ 18 Gy as compared to the reduction from 217.1 ± 137.4 ccm to 120.5 ± 111.5 ccm for MMAs with Dmean-L-EQD2α/β=3 Gy > 18 Gy.
The MMA subgroup with Dmean-L-EQD2α/β=3 Gy > 18 Gy as compared to the one with ≤18 Gy was characterized with significant greater PTV sizes (mean 129.0 ± 82.0 ccm vs. 70.0 ± 145.1 ccm, p < 0.0001) and per definition also Dmean-L-EQD2α/β=3 Gy (mean 24.7 ± 5.2 Gy vs. 9.5 ± 4.7 Gy, p < 0.0001). D-PTV-BEDα/β=3 Gy (mean 233.2 ± 63.5 Gy vs. 244.5 ± 81.9 Gy, p = 0.4280) and D-PTV-BEDα/β=10 Gy (mean 103.3 ± 25.0 Gy vs. 108.2 ± 30.1 Gy, p = 0.4127) were not significantly different for the two subgroups.
Subgroup-analysis: disappearance of MMAs during FU
During FU, a total of 21 (31.82%) MMAs resolved completely after a median of 12 months [range 6 months–4 years] post-SBRT. Forty-five (68.18%) MMAs were still present at the last included FU MRI analysis (median 12 months, range 6 months–4 years); from this subcohort the analysis of 9 MMAs in 8 patients was censored at FU investigations after the diagnosis of hepatic progression (at a median of 9 months FU [range 6 months – 24–36 months]). The MMAs were significantly greater in the subgroup persisting longitudinally until last analyzable FU as compared to those disappearing over time during FU () (p = 0.0294). However, the change of MMA over time was not significantly different for the subgroups of disappearance (p = 0.7430).
To predict longitudinal disappearance based on the first two FU a binary logistic model was established, within this model the MMA volumes were non-significant at 3 months FU (p = 0.0948) and significant at 6 months FU (p = 0.0097). The logistic regression model with the formula in EquationEquation (1)(1)
(1) has an area under the curve (AUC) of 0.844.
(1)
(1)
EquationEquation (1)(1)
(1) Formula of logistic regression. Calculation of the probability of disappearance of the MMA (Magnetic resonance imaging morphologic alteration) until last Follow-up (FU). Prob.=Probability, MMA3Mo/6Mo = MMA at 3 months and 6 months FU
The MMA subgroups were not significantly different regarding Dmean-L-EQD2α/β=3 Gy (mean 16.2 ± 8.9 Gy vs. 12.2 ± 7.6 Gy, p = 0.1351), PTV volume (mean 101.3 ± 155.0 ccm vs. 72.5 ± 80.9 ccm, p = 0.1699), D-PTV-BEDα/β=3 Gy (mean 253.0 ± 65.7 Gy vs. 223.4 ± 90.3 Gy, p = 0.0654) and BEDα/β=10 Gy (mean 111.1 ± 25.6 Gy vs. 100.8 ± 31.4 Gy, p = 0.0665). Disappearance of MMA was not significantly different for the different PTV margin sizes (p = 0.3881).
Subgroup-analysis: MMA volume dynamic
Of the 45 MMAs, which did not resolve completely until last included FU, 37 MMAs (82.22%) were found to show volume reduction until last analyzable FU, while 6 MMAs (13.33%) increased in volume until last analyzable FU and 2 demonstrated hepatic tumor progression at second FU after baseline at 3 months FU (4.44%), which is why these two MMAs could not be included in analysis of volume dynamic. Regarding the total cohort (including the subgroup of 21 MMAs with disappearance), 9.09% MMAs demonstrated an increase and 87.88% a decrease of volume over time. Statistically, in variance analysis, MMA values were not significantly different regarding the subgroups of volume dynamic (increase or decrease of MMA size) (p = 0.5111). However, in the variance analysis of the subgroup with longitudinal decrease, MMAs were significantly different over time (p < 0.0001), the subgroup with longitudinal increase of MMAs did not show significant changes over time (p = 0.2838). Correspondingly, the interaction of volume dynamic and time, that is to say the gradient was significantly different between both subgroups (p = 0.0087).
The subgroup with decreasing MMA volume as compared to increasing MMA volumes was characterized by significantly smaller PTV (mean 84.2 ± 136.5 ccm vs. 156.5 ± 112.0 ccm, p = 0.0287); Dmean-L-EQD2α/β=3 Gy (mean 14.5 ± 8.4 Gy vs. 18.3 ± 11.1 Gy, p = 0.3690), D-PTV-BEDα/β=3 Gy (mean 247.5 ± 72.7 Gy vs. 202.0 ± 93.6 Gy, p = 0.2427) and BEDα/β=10 Gy (mean 109.5 ± 26.8 Gy vs. 90.8 ± 34.3 Gy, p = 0.2151) were not significantly different.
Longitudinal assessment of liver volume
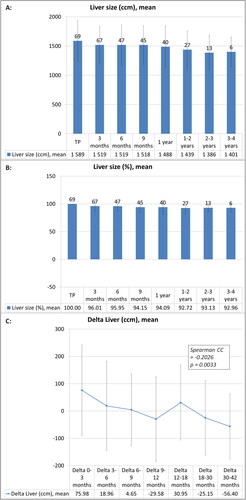
The total liver volumes decreased from the mean value of 1588.6 ± 345.5 ccm at treatment planning baseline to 1400.5 ± 250.3 ccm at 3–4 years FU and in relative terms from 100% at baseline (per definition) to 93.0 ± 7.8% at 3–4 years FU ().
Figure 4. Longitudinal course of the mean total liver volume parameters after liver SBRT and mean total liver volume changes during the follow-up investigations after liver SBRT: Mean values with standard deviation are given longitudinally, population size is indicated by the number at the top of each column in black color. The liver volume values are given as absolute parameters (ccm) (A) and relative parameters (%), equating the relative liver size in relation to the baseline at treatment planning (TP) with 100% (B). Mean values of ‘Delta liver volume’ parameters (defined as the difference between two consecutive investigation time points from baseline and follow-up) with standard deviation are given longitudinally for the different time intervals (C). Spearman correlation coefficient (CC) was significant and negative, demonstrating that the amount of liver volume reduction decreases over time and is more pronounced during short-term FU.
The liver volume decreased significantly over time in variance analysis (p < 0.0001). In posthoc comparison, the liver volumes at the following FU points until 1–2 years FU were significantly different from baseline (each adjusted p ≤ 0.0036–0.0481, except for comparison of baseline with 6 months FU, adjusted p = 0.0615). The other posthoc comparisons of the different FU time points were not significantly different. D-PTV-BEDα/β=3 Gy and BEDα/β=10 Gy were not significantly associated with liver volume changes in variance analysis (p = 0.8306 and 0.9250).
The absolute differences (Delta) of liver volume between consecutive FU time points correlated negatively with the chronological FU time point (Spearman CC −0.2026, p = 0.0033, ), thus demonstrating a decrease of the negative gradient of MMA change from short-term to long-term FU (e.g., mean value of Delta_0–3 months = 76.0 ± 166.1 ccm, Delta_3–6 months = 19.0 ± 163.4 ccm).
The analyzed factors morphological appearance of MMAs at baseline, disappearance of MMAs until last FU, increase/decrease of MMAs until last FU and dose exposure to the liver with Dmean-L-EQD2α/β=3 Gy ≤/>18 Gy did not show a significant influence on the liver volume course after SBRT.
Discussion
To our knowledge, this is the largest long-term assessment of MMAs after SBRT in a multi-platform patient cohort treated with comparable techniques regarding accuracy [Citation16]. About 96% of the treated liver metastases demonstrated acute MMAs in the FU-MRIs; while 32% of the MMAs showed complete resolution until last available FU. Nevertheless, with the amount of longitudinal decrease being non-significantly different between both groups (complete resolution and persistent MMAs until last analyzable FU) a further resolution of the persistent MMAs is possible. A long-term decline in MMA reduction could be demonstrated, thus MMA reduction is pronounced in the first years of FU. Based on the MMA volumes at 3 months and 6 months FU, a predictive logistic regression formula for the probability of disappearance could be demonstrated. This may potentially increase the future precision in the differentiation of liver tissue changes in patients being treated with repetitive SBRT and multimodal treatment regimen.
MMAs with hypointense as compared to hyperintense signal intensity at first appearance were greater and associated with a higher dose exposure to the liver, but longitudinal development was not significantly different. SBRT of liver metastases with Dmean-L-EQD2α/β=3 Gy > 18 Gy were characterized with numerically greater MMA volumes and significantly steeper reduction gradients than those with Dmean-L-EQD2α/β=3 Gy ≤ 18 Gy. The radiological resolution in terms of volume reduction of the radiation-induced radiologically visible reaction of the MMAs and overall stable liver volume corresponds well with the remarkably low clinical toxicity observed in an overlapping cohort analysis [Citation19], thus reaffirming the safety of the application of ablative doses also on the long-term. However, further liver tissue regeneration of the non-ablative dose zone during long-term FU remains a possibility. Whole-liver volume changes were found in a relatively small range leading to a mean whole-liver volume reduction to about 93% after 1 year post-SBRT as compared to baseline and staying in this range after 3–4 years. With regard to earlier analyses from Olsen et al. and Stinauer et al. the volume reduction was less pronounced in our collective, especially with regard to short-term volume reduction – possibly due to different treatment techniques and populations [Citation20,Citation21]. When analyzing data of the metabolic liver function after radiotherapy comparable tendencies of longitudinal courses were observed [Citation22].
Knowledge about the evolution of MMAs is essential for the radiological interpretation of post-SBRT imaging. For long-term survivors, eligibility for other local therapy modalities such as surgical resection, thermal ablation or repeated SBRT in case of out-of-field progression is essential. Based on these data, the peritumoral healthy liver tissue receiving non-ablative radiation doses seems to recover continuously post-SBRT in most of the cases, pointing toward a possibility of repeating local therapeutic approaches when necessary [Citation23]. Further research is necessary to define the transition of ablative irradiation to non-ablative dose exposure to the healthy liver tissue. Proposed thresholds such as the BEDα/β=10 Gy of 100 Gy are possibly to be adapted based on clinical cofactors such as chronic liver impairment [Citation24]. In this regard, clinical and biochemical-functional correlation with the MMA should be further evaluated especially with the evolving clinical application of quantitative imaging data, such as radiomics databases [Citation25]. Moreover, our findings suggest that significant changes could be expected within the first two post-treatment years. Corresponding to our results, short-term course of CT-based tissue alterations in surrounding liver tissue after SBRT have been reported by Herfarth et al. describing a prevalence of 100% (vs. 96% in our MRI-population) after SBRT and volume-reduction to about 40% at 2–4 months after initial detection (vs. median 44% in our population) [Citation26]. However, it is noteworthy to mention, that direct comparisons would be inaccurate due to the different information being given by CT- or MRI-based evaluation. Regarding the 9% of cases with unaltered MMAs, further investigations with a greater population are necessary. In addition, and aiming at elucidating differences between hypo- and hyperintense changes, histological analysis of the altered peritumoral healthy liver tissue would be needed to improve our understanding of these phenomena.
Despite of the systematic FU assessment and SBRT techniques with comparable accuracy, this study carries inherent limitations, such as its retrospective nature and the limited number of available imaging from the entire cohort, which were performed on diverse platforms, with different MRI scanners and different MRI sequence adaptions. With MMA contouring being generally performed in contrast-enhanced T1-weighted sequences, possible confounding effects of the different contrast enhancement phases have to be taken into account. On top of that, regarding the applied matching approach, influencing factors such as the above-mentioned differences of image acquisition and the lack of ex-vivo verification of matching accuracy have to be taken into consideration [Citation27,Citation28]. Due to the retrospective character distinct differences for the time interval of MRI FU investigations have to be taken into account. For liver volume analysis, both CT and MRI-based liver volumes were included into analysis. As this analysis was based on a multicentric cohort, different imaging modalities and parameter deviations have to be considered regarding the virtual liver volumetry. Furthermore, several patients received SBRT to multiple treatment volumes in one or more treatment courses. The per MMA analysis approach of this study may obscure confounding influence of radiotherapy of multiple liver lesions both within one and in sequential treatment series. Due to multidisciplinary treatment regimens, confounding factors for changes in MMA and liver volume (such as hepatotoxic chemotherapy and radiofrequency ablation) cannot be excluded. On top of that, longitudinal total liver volume reduction may be in part influenced by the simultaneous response and volume reduction of the liver metastases, especially in case of greater size of the metastases before SBRT. An indirect comparison with changes after radiofrequency ablation was not possible due to insufficient reporting of this approach in this matter. Prospective studies should include standardized imaging protocols within the FU schedule at specific time points for the whole population and allow for correlations with clinical parameters, such as metabolic liver function and analyze changes in morphological appearance in MRI-FU including quantitative imaging parameters. This is of special importance, as an increasing proportion of patients is treated with repetitive, ablative radiation of liver tumors in combination with different multimodal treatment approaches (e.g., systemic and other ablative therapeutic modalities). Consequently further research in radiological changes after SBRT is needed, on the one hand to optimize dose prescription and PTV contouring and on the other hand to distinguish effect and toxicity of different treatment modalities on an individual patient’s basis.
In conclusion, post-SBRT MRI-morphologic alterations in the peritumoral healthy liver tissue resolve either completely or partially in most patients up to 4 years after treatment. MMA reductions are to be expected especially within short-term FU investigations after SBRT. The dependency of longitudinal MMA course on treatment-related factors could be demonstrated. A deeper understanding of radiological changes after SBRT may optimize radiotherapy in the multimodal field of the treatment of liver tumors, which is why investigations of different time frame evolutions, overall prognostic values and clinical correlations of MMAs are required.
Ethical approval
This study was approved by the institutional ethics boards (2018-869R-MA and KI-D-458/17), according to the principles of the Declaration of Helsinki.
Acknowledgements
The authors especially thank Yvette Wilbur (Varian, USA) for providing and training them with the investigational software.
Disclosure statement
C.D.: Nothing to disclose
G.R.S.: Personal fees and grants from Carl Zeiss Meditec AG, not related to this work. Personal fees from Roche AG, not related to this work.
G.M.: Nothing to disclose
C.W.: Nothing to disclose
D.B.: D.B. reports personal fees from NB Capital ApS, personal fees from Nordic Biotech, personal fees from Siemens AG, personal fees from b.e. Imaging GmbH, and personal fees from PharmaMar outside the submitted work.
P.W.: Nothing to disclose
A.A.T.: Nothing to disclose
D.K.: D.K. received honoraria from Merck Sharp & Dohme and Pfizer and research funding from Merck KGaA
H.O.: Nothing to disclose
F.A.G.: F.A.G. has received or receives research grants, personal fees and/or travel expenses from Carl Zeiss Meditec AG, personal fees from Roche Pharma AG and Medac, grants and personal fees from AstraZeneca, Bristol-Myers Squibb, Cureteq AG, Elekta AB, FoMF GmbH, Guerbet SA, MSD Sharp and Dohme GmbH and Opasca GmbH, stocks, grants and personal fees from TME Pharma AG (formerly Noxxon Pharma AG), compensation for advisory boards from the Federal Joint Committee (G-BA) of the Federal Republic of Germany and of the German Cancer Aid and non-financial support from Oncare GmbH and Opasca GmbH.
M.B.: Nothing to disclose
F.L.: Nothing to disclose
J.D.: Nothing to disclose.
O.B.: Nothing to disclose.
J.B-H.: Personal fees from EBAMed SA outside the submitted work.
Data availability statement
The data used and generated in this work may be available under ethical and data protection considerations upon request to the leading institution on an individual basis.
Additional information
Funding
References
- Palma DA, Olson R, Harrow S, et al. Stereotactic ablative radiotherapy versus standard of care palliative treatment in patients with oligometastatic cancers (SABR-COMET): a randomised, phase 2, open-label trial. Lancet. 2019;393(10185):2051–2058.
- Andratschke N, Alheid H, Allgauer M, et al. The SBRT database initiative of the german society for radiation oncology (DEGRO): patterns of care and outcome analysis of stereotactic body radiotherapy (SBRT) for liver oligometastases in 474 patients with 623 metastases. BMC Cancer. 2018;18(1):283.
- Clerici E, Comito T, Franzese C, et al. Role of stereotactic body radiation therapy in the treatment of liver metastases: clinical results and prognostic factors. Strahlenther Onkol. 2020;196(4):325–333.
- Guckenberger M, Baus WW, Blanck O, et al. Definition and quality requirements for stereotactic radiotherapy: consensus statement from the DEGRO/DGMP working group stereotactic radiotherapy and radiosurgery. Strahlenther Onkol. 2020;196(5):417–420.
- Schmitt D, Blanck O, Gauer T, et al. Technological quality requirements for stereotactic radiotherapy: expert review group consensus from the DGMP working group for physics and technology in stereotactic radiotherapy. Strahlenther Onkol. 2020;196(5):421–443.
- Bae SH, Park HC, Yoon WS, et al. Treatment outcome after fractionated conformal radiotherapy for hepatocellular carcinoma in patients with child-pugh classification B in korea (KROG 16-05). Cancer Res Treat. 2019;51(4):1589–1599.
- Hsieh CE, Venkatesulu BP, Lee CH, et al. Predictors of radiation-induced liver disease in Eastern and Western patients with hepatocellular carcinoma undergoing proton beam therapy. Int J Radiat Oncol Biol Phys. 2019;105(1):73–86.
- Rim CH, Kim HJ, Seong J. Clinical feasibility and efficacy of stereotactic body radiotherapy for hepatocellular carcinoma: a systematic review and meta-analysis of observational studies. Radiother Oncol. 2019;131:135–144.
- Nabavizadeh N, Waller JG, Fain R, 3rd, et al. Safety and efficacy of accelerated hypofractionation and stereotactic body radiation therapy for hepatocellular carcinoma patients with varying degrees of hepatic impairment. Int J Radiat Oncol Biol Phys. 2018;100(3):577–585.
- Boda-Heggemann J, Jahnke A, Chan MKH, et al. Direct dose correlation of MRI morphologic alterations of healthy liver tissue after robotic liver SBRT. Strahlenther Onkol. 2018;194(5):414–424.
- Sihono DSK, Vogel L, Weiß C, et al. A 4D ultrasound real-time tracking system for external beam radiotherapy of upper abdominal lesions under breath-hold. Strahlenther Onkol. 2017;193(3):213–220.
- Vogel L, Sihono DSK, Weiss C, et al. Intra-breath-hold residual motion of image-guided DIBH liver-SBRT: an estimation by ultrasound-based monitoring correlated with diaphragm position in CBCT. Radiother Oncol. 2018;129(3):441–448.
- Boda-Heggemann J, Attenberger U, Budjan J, et al. MRI morphologic alterations after liver SBRT: direct dose correlation with intermodal matching. Strahlenther Onkol. 2016;192(9):641–648. Sep
- Andratschke N, Parys A, Stadtfeld S, et al. Clinical results of mean GTV dose optimized robotic guided SBRT for liver metastases. Radiat Oncol. 2016;11:74.
- Mahadevan A, Blanck O, Lanciano R, et al. Stereotactic body radiotherapy (SBRT) for liver metastasis – clinical outcomes from the international multi-institutional RSSearch(R) Patient registry. Radiat Oncol. 2018;13(1):26.
- Boda-Heggemann J, Jahnke A, Chan MKH, et al. In-vivo treatment accuracy analysis of active motion-compensated liver SBRT through registration of plan dose to post-therapeutic MRI-morphologic alterations. Radiother Oncol. 2019;134:158–165.
- Koay EJ, Owen D, Das P. Radiation-induced liver disease and modern radiotherapy. Semin Radiat Oncol. 2018;28(4):321–331.
- Son SH, Choi BO, Ryu MR, et al. Stereotactic body radiotherapy for patients with unresectable primary hepatocellular carcinoma: dose-volumetric parameters predicting the hepatic complication. Int J Radiat Oncol Biol Phys. 2010;78(4):1073–1080.
- Stera S, Miebach G, Buergy D, et al. Liver SBRT with active motion-compensation results in excellent local control for liver oligometastases: an outcome analysis of a pooled multi-platform patient cohort. Radiother Oncol. 2021;158:230–236.
- Olsen CC, Welsh J, Kavanagh BD, et al. Microscopic and macroscopic tumor and parenchymal effects of liver stereotactic body radiotherapy [case reports clinical trial, phase I clinical trial, phase II]. Int J Radiat Oncol Biol Phys. 2009;73(5):1414–1424.
- Stinauer MA, Diot Q, Westerly DC, et al. Fluorodeoxyglucose positron emission tomography response and normal tissue regeneration after stereotactic body radiotherapy to liver metastases. Int J Radiat Oncol Biol Phys. 2012;83(5):e613–8.
- Dreher C, Hoyer KI, Fode MM, et al. Metabolic liver function after stereotactic body radiation therapy for hepatocellular carcinoma. Acta Oncol. 2016;55(7):886–891.
- Gkika E, Strouthos I, Kirste S, et al. Repeated SBRT for in- and out-of-field recurrences in the liver. Strahlenther Onkol. 2019;195(3):246–253.
- Sterzing F, Brunner TB, Ernst I, et al. Stereotactic body radiotherapy for liver tumors: principles and practical guidelines of the DEGRO working group on stereotactic radiotherapy. Strahlenther Onkol. 2014;190(10):872–881.
- Dreher C, Linde P, Boda-Heggemann J, et al. Radiomics for liver tumours. Strahlenther Onkol. 2020;196(10):888–899.
- Herfarth KK, Hof H, Bahner ML, et al. Assessment of focal liver reaction by multiphasic CT after stereotactic single-dose radiotherapy of liver tumors. Int J Rad Oncol Biol Phys. 2003;57(2):444–451.
- Hussein M, Akintonde A, McClelland J, et al. Clinical use, challenges, and barriers to implementation of deformable image registration in radiotherapy – the need for guidance and QA tools. Br J Radiol. 2021;94(1122):20210001.
- Lowther N, Louwe R, Yuen J, et al. MIRSIG position paper: the use of image registration and fusion algorithms in radiotherapy. Phys Eng Sci Med. 2022;45(2):421–428.