
Abstract
Background
Liver cancer is one of the most common types of cancer and the third leading cause of cancer-related deaths globally. The most common type of primary liver cancer is called hepatocellular carcinoma (HCC) which accounts for 75–85% of cases. HCC is a malignant disease with aggressive progression and limited therapeutic options. While the exact cause of liver cancer is not known, habits/lifestyles may increase the risk of developing the disease.
Material and methods
This study is designed to quantify the liver cancer risk through a multi-parameterized artificial neural network (ANN) based on basic health data including habits/lifestyles. In addition to input and output layers, our ANN model has three hidden layers having 12, 13, and 14 neurons, respectively. We have used the health data from the National Health Interview Survey (NHIS) and Prostate, Lung, Colorectal, and Ovarian Cancer (PLCO) datasets to train and test our ANN model.
Results
We have found the best performance of the ANN model with an area under the receiver operating characteristic curve of 0.80 and 0.81 for training and testing cohorts, respectively.
Conclusion
Our results demonstrate a method that can predict liver cancer risk with basic health data and habits/lifestyles. This novel method could be beneficial to high-risk populations by enabling early detection.
Introduction
Liver cancer, the third main cause of cancer-related deaths, is placed as the sixth most common type of cancer worldwide [Citation1,Citation2]. The Centers for Disease Control and Prevention estimates 33,000 new cases of liver cancer and 27,000 liver-cancer-related deaths each year in the United States. Consequently, the attention of the public to liver cancer has gradually increased and many resources have been devoted to its research.
Anything that causes an increase in the chance of catching a disease such as cancer is called a risk factor and each cancer has its risk factors. The main risk factors for liver cancer (i.e., hepatocellular carcinoma (HCC)) are a high occurrence of hepatitis B and C [Citation3], a history of diabetes mellitus (DM), and environmental exposure to aflatoxin B1 [Citation4]. Furthermore, a strong correlation exists between certain lifestyle habits including cardiovascular metrics [Citation5], and the occurrence of liver cancer [Citation6]. These include but are not limited to alcohol consumption [Citation7], smoking [Citation8], obesity/body mass index (BMI) [Citation9], inadequate physical activity [Citation5], hypertension [Citation10], and diet [Citation5,Citation11], etc. However, still, the causes may be different across the populations. In endemic areas such as China and Africa, chronic infection of the hepatitis B virus (HBV) is the major risk factor. While chronic alcohol consumption, obesity, and hepatitis C virus (HCV) are the main risk factors in low-risk areas such as western countries [Citation12–14]. Some risk factors such as smoking are independent of geography and race-ethnicity [Citation14–16]. Cigarettes have destructive effects on most of the body’s organs by carrying over 4000 toxic substances [Citation17]. While the liver has no direct contact with smoking, recent studies have shown the adverse effect of smoking on the liver [Citation16], longitudinal studies have correlated smoking with liver cancer occurrence in the United States [Citation18], and smokers are at higher risk of getting liver cancer [Citation19]. There is now enough evidence to state that smoking causes liver cancer, according to the International Agency for Research on Cancer (IARC) Monograph on smoking [Citation20]. Considering this research, it is important to make healthy lifestyle choices to reduce the risk of developing liver cancer.
Artificial neural networks (ANNs) are influenced by the functioning of the brain [Citation21]. In other words, ANNs are computing systems with mathematical algorithms which enable the neural networks to learn from the standard data and find patterns contained in the data. ANNs have a broad range of applications in different fields. One of the major applications of ANNs is in the field of medicine. A recent survey shows a major impact of artificial intelligence (AI) in healthcare [Citation22]. It has caught the attention of the scientific community in medicine due to its usefulness in the prediction and detection of disease [Citation23–25]. Nowadays, ANNs have an important role in medical diagnoses to detect patterns in medical images, classify diseases, and monitor patient health. These are cost-effective machine learning techniques for healthcare providers because they enable automated decision-making, provide analysis faster than traditional methods, and can be scaled to large datasets to provide better patient outcomes [Citation26,Citation27].
It has been shown that HCC screening is impactful [Citation28]. However, the real-world utilization rate of screening is below 20% due to multiple patient- and provider-related factors [Citation29]. The vast size of the at-risk population is another concern. It would be useful if machine learning-based methods could better identify the group that would benefit most from screening. Therefore, in the presented study, we have used an ANN to model liver cancer risk quantitatively. We foresee that our model can predict liver cancer risks and suggest interventions to reduce liver cancer risks by changing lifestyles. Such a model may provide clinicians with a novel approach to determining individuals with a higher chance of getting liver cancer and provide chances for interventions.
Material and methods
Datasets
Interviews of personal households in the United States on a broad range of health topics are conducted annually by the Centers for Disease Control and Prevention since 1957 and are maintained electronically for free download [Citation30]. This study used the National Health Interview Survey (NHIS) [Citation30] data from 1997 to 2019. Basic health data of 671,697 persons including 256 with liver cancer were acquired from NHIS data and the details of the datasets are given in . The other population that we used is the Prostate, Lung, Colorectal, and Ovarian cancer screening trial (PLCO) [Citation31] dataset. The PLCO dataset is defined as the randomized, controlled trial that investigates if specific test evaluations reduce mortality from prostate, lung, colorectal, and ovarian cancer. Between November 1993 and July 2001, 154,897 participants were enrolled, 225 of whom developed liver cancer during 13 years of follow-up. We used the PLCO dataset to check the diversity and predictive power of our model.
Table 1. Description of the datasets.
The features (risk predictors) that are used as model input include age, smoking habits, exercise habits, diabetes, race, body mass index (BMI), heart disease, stroke, other heart conditions, emphysema, arthritis, asthma, hypertension, drinking habits, and cancers other than liver cancer. These risk predictors are selected based on literature review, biological plausibility, and clinical judgment [Citation32]. PubMed knowledge was used to give weight to the various risk factors. These weights were calculated independently from fits on training datasets. Moreover, the input features to the model are time-dependent because a persons’ health condition can change over time. For example, the data for people who were diagnosed with cancer long ago may not be useful. Therefore, we considered only data for people who received a positive liver cancer diagnosis. Therefore, we have used a 4-year, cutoff for the liver cancer group.
We defined the PLCO dataset as DataSet1 (DS1), and the NHIS dataset as DataSet2 (DS2). We used DS1 and DS2 to measure the performance of the model. The different datasets were used to find the optimum performance of the model. Firstly, the constructed datasets were randomized to be used as a train/test scheme. Our ANN model was trained on 70% of datasets and tested on the remaining 30% using 10-fold cross-validation. We calculated cancer risk, sensitivity, and specificity for both the training and testing datasets.
Missing data
Participants did not necessarily respond to every question and so, there are some missing data entries in our datasets. Since our variables have no ordinal relationship, the integer encoding will not be able to address the missing data and we might get unpredictable results. To impute the missing data, a one-hot encoding idea was used [Citation33]. This method has broad applications in engineering and sciences [Citation34] it is proposed [Citation35]. In this method, for each feature, a new binary variable is created [Citation27] indicating whether a respondent has a value for that feature. Then the missing value is set to −1, outside of the range of the ‘real’ data [Citation36].
Artificial neural network
We used ANN models along with other machine learning tools (e.g., Support Vector Machine, Decision Tree, Naive Bayes, Linear Discriminant Analysis, and Logistic Regression) to investigate other cancer types, such as lung cancer [Citation37], prostate cancer [Citation38], endometrial cancer [Citation39], colorectal cancer [Citation40,Citation41], and pancreatic cancer [Citation36]. Following these studies, we also used the ANN model for this study. In these studies, the ANN model showed the best performance in terms of measuring the sensitivity, specificity, and area under the receiver operating characteristic curve (AUC) [Citation36,Citation41]. Therefore, we adopted our previous ANN model for establishing our model for this study. In addition to the first (i.e., input) and last (i.e., output) layers, our multilayer ANN has three hidden layers with 12,13, and 14 neurons, respectively to reach to the optimum architecture of our model. Our prediction model provided better accuracy and performance with this architecture. Three hidden layers have more neurons that help to reduce bias and improve the overall accuracy of the model. A schematic of the used neural network is shown in . We used 15 personal health features as input including age, BMI, race, smoking habits, exercise habits, drinking habits, diabetes, stroke, other heart condition, heart disease, hypertension, emphysema, asthma, arthritis, and other cancers.
Figure 1. A schematics of an ANN [Citation42]. Circles and lines represent a neuron and a weight, respectively.
![Figure 1. A schematics of an ANN [Citation42]. Circles and lines represent a neuron and a weight, respectively.](/cms/asset/fd05deca-8083-4ea9-a777-f13493ab47b2/ionc_a_2213445_f0001_c.jpg)
The output of our ANN model is a fractional number between 0 and 1, with a higher number indicative of a higher risk of liver cancer. This fractional number can be converted to a binary prediction status (‘yes’ or ‘no’) by selecting a threshold value above which the model will give a positive prediction.
We trained the model on the full training dataset by using the standard backpropagation algorithm with simple gradient descent that produced the best results for this study. A 10-fold stratified cross-validation, 8000 iterations within the training dataset, and the meaning of the performance on the validation dataset were used to evaluate the model. After choosing the best model, the testing dataset was used to evaluate the model performance, using the AUC curves. In addition, sensitivity and specificity were calculated for all the datasets (training and testing).
Statistical analysis
Our prediction model was developed using the logistic activation and sum of squared errors cost function. The standard backpropagation algorithm is used to train the model. We used an in-house MATLAB code to develop, analyze, and minimize the fitting error of our five-layered ANN model.
Results
Model selection
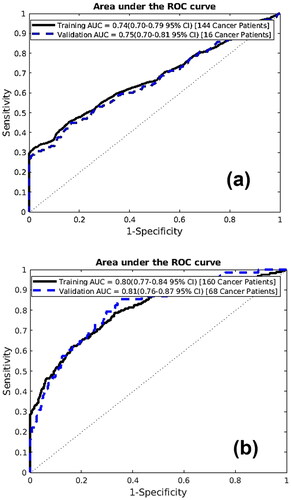
To quantify the performance of the ANN model, the AUC for DS1 and DS2 were calculated. The AUCs for DS1 are 0.74 and 0.75 for training and testing sets respectively (), while 0.80 for training and 0.81 for testing for DS2 (). We have found the best model performance for the DS2. The proximity of AUC values between training and testing indicated no overfitting in our model.
Figure 2. (a) Receiver operating characteristic (ROC) plots for the training and testing datasets of DS1. (b) Receiver operating characteristic (ROC) plots for the training and testing datasets of DS2.
Final model performance
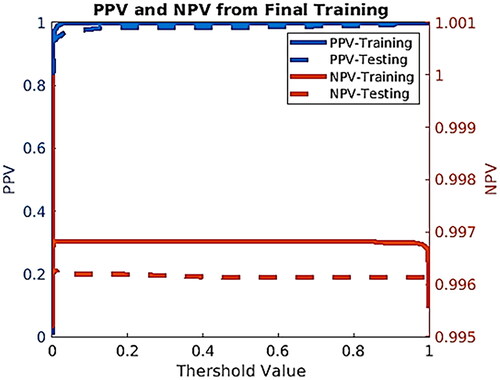
The training dataset of DS2 is applied to train and afterward, the testing dataset is used to evaluate the training performance. We plotted the sensitivity and specificity as functions of the threshold risk to evaluate the performance of our model for DS2 (). The threshold risk was selected to maximize the sum of the sensitivity and specificity. Both sensitivity and specificity values are plotted in . We also created plots for positive predictive value (PPV) and negative predictive value (NPV). These were plotted as a function of the threshold value (see ).
Figure 3. (a) Sensitivity and specificity curves for both training and testing as functions of the threshold risk (b) Comparison of sensitivity and specificity values between training and testing datasets for DS2.
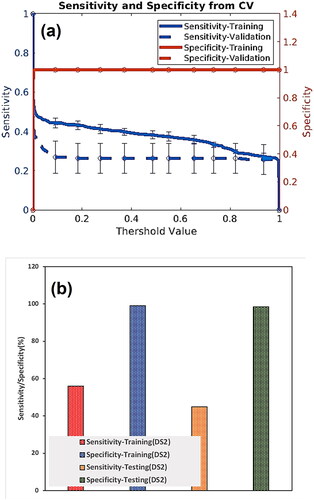
Figure 4. Positive predictive value (PPV) and negative predictive value (NPV) for training and testing datasets.
Risk stratification
To demonstrate the capability of our model for clinical use, we assessed a scheme to manage risk. The scheme stratifies the studied population into low-, medium-, and high-risk categories. The training dataset was used to choose boundaries so that no more than 1% of applicants without/with cancer were categorized as high/low risk, respectively. Once the boundaries were selected, the testing dataset was used for applying the stratification scheme to show the possible use of the model clinically. Through this stratification, we could screen positive high-risk individuals at once [Citation42] and recommend common screenings for medium-risk individuals. The output of the presented model stratified the DS2 dataset into low, medium, and high risk. The results are summarized in .
Table 2. Risk stratification results on the DS2 dataset.
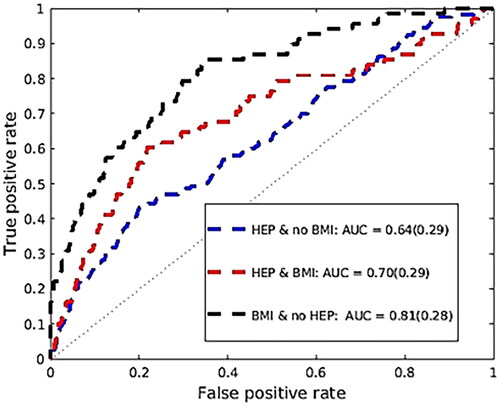
Compared to having a normal BMI, being overweight is associated with a 21% increased risk of liver cancer [Citation43]. As people become heavier, they develop fatty infiltration in their liver which leads to chronic inflammation. In the United States, this is now becoming the most rapidly developing cause of liver cancer [Citation43], since there are better treatments to control hepatitis C and hepatitis B. In , we repeated the analysis of our dataset (DS2) by considering the group of people who were never diagnosed with hepatitis, and the remaining population by considering their BMI.
Figure 5. Receiver operating characteristic (ROC) plots for three scenarios: HEP & no BMI, HEP & BMI, and BMI & no HEP.
Discussion
The presented ANN model predicted and stratified the liver cancer risk using personal health data. To optimize the performance of the model, the training and testing datasets were used. An AUC of 0.80 (95%CI 0.77–0.84) and 0.81 (95%CI 0.76–0.87) for training and testing, accordingly (), were the best values acquired from the model. The model’s sensitivity hovered around 60% ± 1.13% and 40% ± 1.10% on the training and testing dataset, respectively. For both the training and testing datasets, the specificity remains above 99.5% ± 1.13% for most threshold values. The NPV value of 99.55% was found for the testing dataset, meaning the model prediction of when someone does not have cancer is wrong by 0.45%. For our testing dataset, the PPV value is 0.11%.
According to the American Cancer Society [Citation44], the commonly promising modalities for HCC screening are (1) a blood test to find a substance produced by cancer cells called alpha-fetoprotein (AFP) and (2) imaging such as ultrasound, computed tomography (CT), or magnetic resonance imaging (MRI). It has been shown that HCC surveillance is cost-effective [Citation45]. It has been reported that these screening techniques (i.e., Biannual AFP, annual abdominal ultrasound, triple-phase CT) are cost-effective compared to no surveillance [Citation46,Citation47]. While effective, these common screening techniques are mainly used when the symptoms start appearing. Most commonly, the signs and symptoms of liver cancer will appear when the cancer reaches its later stages, when screening may no longer be helpful.
According to the American cancer society [Citation44], the early diagnosis of liver cancer is quite challenging. The liver is located under the rib cage and that makes the physical exam quite hard for the early detection of cancer. Once the tumor can be felt by physical exam, it might be quite large. The presented model is designed to help with the early prediction of HCC risk before overt symptoms while considering the lifestyle. Moreover, we emphasize readily available data in the electronic medical record to obtain this level of sensitivity and specificity.
Recently, there have been studies that suggest different models to predict HCC risk. These models were developed in chronic hepatitis B (CHB) cohorts and are common in some limitations [Citation48–50]. The group of patients who were signed up for hospital-based studies in China, Hong Kong, and Korea had active disease. Therefore, a higher rate of HCC was found in the training cohort compared to patients with CHB infection [Citation51]. However, based on the primary care setting, patients with chronic HBV would be categorized as low-risk, causing an increase in NPV [Citation51]. There is another constraint that causes limitations of these models. The only ethnicity considered in the mentioned model was West Asians HCC risk may vary in different ethnic groups [Citation51]. Another limitation of existing ANN models is that they are often limited to a single dataset or a small number of datasets. This can limit the model’s ability to accurately learn the complex relationships between the input and output variables, leading to a decrease in predictive accuracy [Citation52].
Most of the existing models for HCC risk prediction consider only the high-risk population who were carrying HBV. It is important to develop better biomarkers and models that can quantify the risk not only based on hepatitis status but also on lifestyle-related factors [Citation51]. Therefore, there is a growing need to develop an easy model that can predict the risk based on available general population data. To our knowledge, the clinical data for people who are at unknown risk are less available compared to a high-risk population. Additionally, other than considering the existing factors for prediction models for high-risk individuals, other risk factors (i.e., physical activity, diabetes, smoking, body mass index (BMI), alcohol consumption) should be considered in prediction models for different populations. Our ANN model performs well with the medical records that are available online, and it uses general population data as opposed to a smaller population dataset. This model has the potential to be accessible on portable devices, such as tablets and mobile phones. The clinicians will benefit from this feature because they can enter the patient’s self-reported data and calculate the risk immediately.
The inputs for this model were selected based on the availability in both NHIS and PLCO datasets. Some sets of variables only exist in one of the datasets which may cause a limitation that is called a statistical file-matching problem [Citation53]. In order to overcome the file-matching problem and construct a micro-analytical model such as ANN, the input variables should be available in all the datasets [Citation53]. This variable selection limited us to including stronger factors such as hepatitis B with a higher correlation with liver cancer. To overcome this limitation, we used large datasets that contain a greater variety of input variables. Note that for a risk prediction model that is data-based, it is suggested to record strong predictor factors more regularly.
Conclusion
This study investigated a novel approach to predicting liver cancer risk for individuals. We developed an ANN model based on personal health data with an AUC of 0.81. This model is easy to apply to readily available personal health data and it is noninvasive and cost-effective. Our results indicate that the developed ANN based on general population health data can be used to quantify the liver cancer risk with differing characteristics and lifestyles.
Disclosure statement
No potential conflict of interest was reported by the author(s).
Data availability statement
The data that support the findings of this study are available on request from the corresponding author, [WM].
References
- Jemal A, Bray F, Center MM, et al. Global cancer statistics. CA Cancer J Clin. 2011;61(2):69–90.
- Singh GK, Siahpush M, Altekruse SF. Time trends in liver cancer mortality, incidence, and risk factors by unemployment level and race/ethnicity, United States, 1969–2011. J Community Health. 2013;38(5):926–940.
- Momin B, Richardson L. An analysis of content in comprehensive cancer control plans that address chronic hepatitis B and C virus infections as major risk factors for liver cancer. J Community Health. 2012;37(4):912–916.
- Mimi CY, Yuan J-M. Environmental factors and risk for hepatocellular carcinoma. Gastroenterology. 2004;127(5 Suppl 1):S72–S78.
- Blaes A, Prizment A, Koene RJ, et al. Cardio-oncology related to heart failure: common risk factors between cancer and cardiovascular disease. Heart Fail Clin. 2017;13(2):367–380.
- Singh S, Fujii LL, Murad MH, et al. Liver stiffness is associated with risk of decompensation, liver cancer, and death in patients with chronic liver diseases: a systematic review and meta-analysis. Clin Gastroenterol Hepatol. 2013;11(12):1573.e2–1584.e2.
- Azzalini L, Ferrer E, Ramalho LN, et al. Cigarette smoking exacerbates nonalcoholic fatty liver disease in obese rats. Hepatology. 2010;51(5):1567–1576.
- Carter BD, Abnet CC, Feskanich D, et al. Smoking and mortality—beyond established causes. N Engl J Med. 2015;372(7):631–640.
- Calle EE, Rodriguez C, Walker-Thurmond K, et al. Overweight, obesity, and mortality from cancer in a prospectively studied cohort of US adults. N Engl J Med. 2003;348(17):1625–1638.
- Bangalore S, Kumar S, Kjeldsen SE, et al. Antihypertensive drugs and risk of cancer: network meta-analyses and trial sequential analyses of 324 168 participants from randomised trials. Lancet Oncol. 2011;12(1):65–82.
- González CA, Jakszyn P, Pera G, et al. Meat intake and risk of stomach and esophageal adenocarcinoma within the European prospective investigation into cancer and nutrition (EPIC). J Natl Cancer Inst. 2006;98(5):345–354.
- Kao J-H, Chen D-S. Recent research progress in hepatocellular carcinoma. J Formos Med Assoc. 2002;101(4):239–248.
- Yu MC, Yuan J-M, Govindarajan S, et al. Epidemiology of hepatocellular carcinoma. Can J Gastroenterol. 2000;14(8):703–709.
- Koh WP, Robien K, Wang R, et al. Smoking as an independent risk factor for hepatocellular carcinoma: the Singapore Chinese health study. Br J Cancer. 2011;105(9):1430–1435.
- Koh W-P, Yuan J-M, Sun C-L, et al. Middle-aged and older Chinese men and women in Singapore who smoke have less healthy diets and lifestyles than nonsmokers. J Nutr. 2005;135(10):2473–2477.
- El-Zayadi A-R. Heavy smoking and liver. World J Gastroenterol. 2006;12(38):6098–6101.
- Zhang X-F, Wei T, Liu X-M, et al. Impact of cigarette smoking on outcome of hepatocellular carcinoma after surgery in patients with hepatitis B. PLOS One. 2014;9(1):e85077.
- Hammond EC. Smoking in relation to the death rates of one million men and women. Natl Cancer Inst Monogr. 1966;19:127–204.
- Hirayama T. A large-scale cohort study on risk factors for primary liver cancer, with special reference to the role of cigarette smoking. Cancer Chemother Pharmacol. 1989;23(S1):S114–S117.
- Lee Y-CA, Cohet C, Yang Y-C, et al. Meta-analysis of epidemiologic studies on cigarette smoking and liver cancer. Int J Epidemiol. 2009;38(6):1497–1511.
- Chen Y-Y, Lin Y-H, Kung C-C, et al. Design and implementation of cloud analytics-assisted smart power meters considering advanced artificial intelligence as edge analytics in demand-side management for smart homes. Sensors. 2019;19(9):2047.
- Jiang F, Jiang Y, Zhi H, et al. Artificial intelligence in healthcare: past, present and future. Stroke Vasc Neurol. 2017;2(4):230–243.
- Smith JW, Everhart JE, Dickson WC, et al. Using the ADAP learning algorithm to forecast the onset of diabetes mellitus. Proc Annu Symp Comput Appl Med Care. 1988:261–265.
- Salim N. Medical diagnosis using neural network. Faculty of Information Technology, University of Utara Malaysia; 2004.
- Patil SM, Mudholkar RR. An osteoarthritis classifier using back propagation neural network. Int J Adv Eng Technol. 2012;4(2):292.
- Shahid N, Rappon T, Berta W. Applications of artificial neural networks in health care organizational decision-making: a scoping review. PLOS One. 2019;14(2):e0212356.
- Waring J, Lindvall C, Umeton R. Automated machine learning: review of the state-of-the-art and opportunities for healthcare. Artif Intell Med. 2020;104:101822.
- Wolf E, Rich NE, Marrero JA, et al. Use of hepatocellular carcinoma surveillance in patients with cirrhosis: a systematic review and meta‐analysis. Hepatology. 2021;73(2):713–725.
- Fujiwara N, Friedman SL, Goossens N, et al. Risk factors and prevention of hepatocellular carcinoma in the era of precision medicine. J Hepatol. 2018;68(3):526–549.
- Blewett LA, Rivera Drew JA, Griffin R, et al. IPUMS health surveys: national health interview survey, version 6.2. Minneapolis (MN): University of Minnesota. 2016. p. d070.
- Kramer BS, Gohagan J, Prorok PC, et al. A national cancer institute sponsored screening trial for prostatic, lung, colorectal, and ovarian cancers. Cancer. 1993;71(2 Suppl):589–593.
- London WT, McGlynn KA. Liver cancer. Cancer Epidemiol Prev. 2006;3:763–786.
- Yu L, Zhou R, Chen R, et al. Missing data preprocessing in credit classification: one-hot encoding or imputation? Emerg Mark Finance Trade. 2022;58(2):472–482.
- Matsunaga Y. Accelerating SAT-based boolean matching for heterogeneous FPGAs using one-hot encoding and CEGAR technique. IEICE Trans Fundam Electron Commun Comput Sci. 2016; 99-A(7):1374–1380.
- Huffman DA. The synthesis of sequential switching circuits. J Franklin Inst. 1954;257(3):161–190.
- Muhammad W, Hart GR, Nartowt B, et al. Pancreatic cancer prediction through an artificial neural network. Front Artif Intell. 2019;2:2.
- Hart GR, Roffman DA, Decker R, et al. A multi-parameterized artificial neural network for lung cancer risk prediction. PLoS One. 2018;13(10):e0205264.
- Roffman DA, Hart GR, Leapman MS, et al. Development and validation of a multiparameterized artificial neural network for prostate cancer risk prediction and stratification. J Clin Oncol Clin Cancer Inform. 2018;2:1–10.
- Hart GR, Yan V, Huang GS, et al. Population-based screening for endometrial cancer: human vs. machine intelligence. Front Artif Intell. 2020;3:539879.
- Nartowt BJ, Hart GR, Roffman DA, et al. Scoring colorectal cancer risk with an artificial neural network based on self-reportable personal health data. PLOS One. 2019;14(8):e0221421.
- Nartowt BJ, Hart GR, Muhammad W, et al. Robust machine learning for colorectal cancer risk prediction and stratification. Front Big Data. 2020;3(6):6.
- Hart GR, Nartowt B, Muhammad W, et al. Stratifying ovarian cancer risk using personal health data. Front Big Data. 2019;2:24.
- Campbell PT, Newton CC, Freedman ND, et al. Body mass index, waist circumference, diabetes, and risk of liver cancer for US adults. Cancer Res. 2016;76(20):6076–6083.
- Siegel RL, Miller KD, Fuchs HE, et al. Cancer statistics, 2022. CA Cancer J Clin. 2022;72(1):7–33.
- Harris PS, Hansen RM, Gray ME, et al. Hepatocellular carcinoma surveillance: an evidence-based approach. World J Gastroenterol. 2019;25(13):1550–1559.
- Lin OS, Keeffe EB, Sanders GD, et al. Cost-effectiveness of screening for hepatocellular carcinoma in patients with cirrhosis due to chronic hepatitis C. Aliment Pharmacol Ther. 2004;19(11):1159–1172.
- Arguedas MR, Chen VK, Eloubeidi MA, et al. Screening for hepatocellular carcinoma in patients with hepatitis C cirrhosis: a cost-utility analysis. Am J Gastroenterol. 2003;98(3):679–690.
- Yuen M-F, Tanaka Y, Fong DY-T, et al. Independent risk factors and predictive score for the development of hepatocellular carcinoma in chronic hepatitis B. J Hepatol. 2009;50(1):80–88.
- Wong VW-S, Chan SL, Mo F, et al. Clinical scoring system to predict hepatocellular carcinoma in chronic hepatitis B carriers. J Clin Oncol. 2010;28(10):1660–1665.
- Wong GL-H, Chan HL-Y, Wong CK-Y, et al. Liver stiffness-based optimization of hepatocellular carcinoma risk score in patients with chronic hepatitis B. J Hepatol. 2014;60(2):339–345.
- Ma X, Yang Y, Tu H, et al. Risk prediction models for hepatocellular carcinoma in different populations. Chin J Cancer Res. 2016;28(2):150–160.
- Lai Q, Spoletini G, Mennini G, et al. Prognostic role of artificial intelligence among patients with hepatocellular cancer: a systematic review. World J Gastroenterol. 2020;26(42):6679–6688.
- Rubin DB. Statistical matching using file concatenation with adjusted weights and multiple imputations. J Bus Econ Stat. 1986;4(1):87–94.