
 ?Mathematical formulae have been encoded as MathML and are displayed in this HTML version using MathJax in order to improve their display. Uncheck the box to turn MathJax off. This feature requires Javascript. Click on a formula to zoom.
Abstract
Purpose
Because proton head and neck (HN) treatments are sensitive to anatomical changes, plan adaptation (re-plan) during the treatment course is needed for a significant portion of patients. We aim to predict re-plan at plan review stage for HN proton therapy with a neural network (NN) model trained with patients’ dosimetric and clinical features. The model can serve as a valuable tool for planners to assess the probability of needing to revise the current plan.
Methods and Materials
Mean beam dose heterogeneity index (BHI), defined as the ratio of the maximum beam dose to the prescription dose, plan robustness features (clinical target volume (CTV), V100 changes, and V100 > 95% passing rates in 21 robust evaluation scenarios), as well as clinical features (e.g., age, tumor site, and surgery/chemotherapy status) were gathered from 171 patients treated at our proton center in 2020, with a median age of 64 and stages from I-IVc across 13 HN sites. Statistical analyses of dosimetric parameters and clinical features were conducted between re-plan and no-replan groups. A NN was trained and tested using these features. Receiver operating characteristic (ROC) analysis was conducted to evaluate the performance of the prediction model. A sensitivity analysis was done to determine feature importance.
Results
Mean BHI in the re-plan group was significantly higher than the no-replan group (p < .01). Tumor site (p < .01), chemotherapy status (p < .01), and surgery status (p < .01) were significantly correlated to re-plan. The model had sensitivities/specificities of 75.0%/77.4%, respectively, and an area under the ROC curve of .855.
Conclusion
There are several dosimetric and clinical features that correlate to re-plans, and NNs trained with these features can be used to predict HN re-plans, which can be used to reduce re-plan rate by improving plan quality.
Introduction
Proton therapy has become an increasingly popular choice for treating head and neck (HN) cancer because of its dosimetric advantage over photon therapy [Citation1–4]. However, proton plans are sensitive to anatomy changes, which include target shrinkage, weight loss/gain, cavity filling changes, etc. [Citation5–8]. In cases where anatomy changes have a substantial impact on the dose distribution, leading to hotspots and losses of coverage, the original plan is no longer suitable for treatment, and adaptive radiotherapy (ART) is necessary. ART is frequently needed for proton treatment [Citation9–14]. Studies have shown that ART has increased the sparing of organs at risk (OARs) and tumor coverage in photon and proton HN therapy [Citation15–20]. At our institution, 30–35% of HN cases are re-planned at least once during their course of treatment. ART workflow at our institution typically takes 5 business days during which the patient must be treated with the original plan. In addition, significant staff and resources are involved in the re-plan process. For these reasons, reducing the number of re-plans is beneficial to both patients and staff.
In this retrospective study, we analyze the correlation between re-plans and initial plan dosimetry parameters/patients’ clinical features. Neural networks (NN) were used for re-plan prediction because they are great at finding relationships between data that are non-linear, complex, or even unknown, and are therefore a good choice for learning the complex relationship between clinical/dosimetric data and plan adaptation. Machine learning methods have been applied to many different areas of medical physics such as radiotherapy dosimetric prediction and weight loss prediction [Citation21–26]. The training data consists of clinical features and dosimetric parameters from the plans of patients treated at our institution. The model predicts whether new patients will need a re-plan. These results can be used by dosimetrists and physicists to evaluate the plan prior to treatment and improve the plan quality, when necessary, potentially reducing re-plan rates.
Method and materials
Patient selection
The data used to train the prediction model were gathered from 171 HN patients treated at our institution in 2020 with institutional review board (IRB) approval (IRB00114349). Patient data is shown in . Patients had a median age of 65 and spanned stages from I-IVc across 13 different HN sites. The most common sites were the oropharynx (n = 53), nasal cavity/sinuses (n =26 cases), and lip and oral cavity (n = 25). 31% of patients were re-planned at least once during their course of treatment.
Table 1. Patient data.
Plan adaptation criteria
All HN patients were scheduled for bi-weekly quality assurance CT (QACT) scans during their treatment course to monitor the anatomy changes and their dosimetric effects. Cone beam CTs (CBCTs) were obtained before every treatment fraction to check anatomic changes and ad hoc QACT were ordered when necessary. In our clinical practice, plan adaptation is recommended when any of the following criteria is met in the QACT evaluation: a) target shrinkage/growth or weight gain/loss, b) target D95 coverage is worse than the worst-case scenario from the treatment plan’s robust evaluation or D95 < 95% of the prescription, c) volume receiving 110% of prescription is greater than 1 cc, d) any high priority critical organ such as the brain stem, optic chiasm/nerve, or spinal cord doesn’t meet its clinical goal(s). Choosing whether to re-plan is a patient-specific process. Of the 82 re-planned patients, 41 were re-planned due to OAR overdose, 25 were re-planned due to coverage loss with an average D95 of 93.3%, 13 were re-planned due to hotspots with an average hotspot (D1cc) of 117.4% of the prescription dose, and 9 were re-planned due to weight loss. It should be noted that these numbers add up to more than 82 as patients can be re-planned for multiple of these reasons. The criteria above are helpful metrics but are not all that’s needed to start a re-plan. The final choice is made from a combination of these criteria, the physicist’s recommendation, and the MD’s clinical decision. To ensure that the re-plans came from anatomical changes, patients with re-plans due to unusual reasons (e.g., missing mask) have been removed from the dataset.
Clinical features
Thirteen clinical features were manually gathered from the patients using our clinical database. These features are whether the patient had a re-plan, stage, site, T/N/M values, p16 value, whether the patient had surgery, surgery margins, whether the treatment was definitive/palliative, whether the patient had concurrent chemotherapy, gender, age, and treatment fractions.
Treatment planning considerations
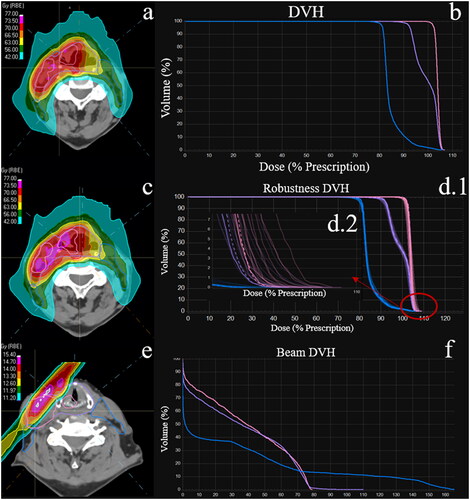
At our institution, a 5-beam arrangement (x shape beam directions with 1 additional AP field) is used to treat bilateral HN patients, which make up 61% of our data. The targets are split so that the left anterior oblique (LAO) beam and left posterior oblique (LPO) beam cover the left portion of the targets while the right anterior oblique (RAO) beam and right posterior oblique (RPO) beam cover the right portion. Both posterior beams (LPO and RPO) will avoid going through the shoulder. That part of the targets will be covered by the LAO, RAO, and AP beams. A typical 5-beam plan isodose and DVH are shown in and , respectively. A 3-beam arrangement (ipsilateral anterior and posterior beams plus the AP beam) is used to treat unilateral HN patients, which make up 39% of our data. Any portion of the target is typically covered by at least two beams, which contribute to the total dose.
Figure 1. (a) Isodose for a typical bilateral HN patient. (b) DVH for all 3 CTVs of the HN patient. (c) Isodose on a robustness evaluation scenario. (d.1) DVH of the CTVs for the nominal plan (dashed) and the robustness scenario (solid). (d.2) Tail of the CTV DVH. Mean max dose is calculated from the tail of the DVH. (e) Hotspot and dose heterogeneity from the 330° right posterior oblique (RPO) beam. (f) DVH for all 3 CTVs from the RPO beam. Notes: There is a > 5% max dose change in (d). this is shown in the isodose with the pink hotspots in (c). Figure (e)’s white hotspot represents a 110% beam dose heterogeneity.
Most patients are treated with up to 3 dose levels. The highest level is used for the treatment of the gross tumor site or surgical beds. The number of fractions and dose levels vary between patients, but typical ranges for these levels are 66–70 Gy, 57–61 Gy, and 53–55 Gy, respectively, treated for 33–35 fractions. All 3 levels are treated with the simultaneous integrated boost (SIB) technique. The coverage goal for each level is V100 ≥ 98% prescription. It should be noted that this coverage goal is tighter than what is checked when determining if plan adaptation is necessary. This is because while V100 > 98% is the required coverage in the nominal plan, most clinical trial supported clinical practices use D95 > 95% as a criterion for coverage in treatment evaluation. All plans were created in RayStation 9 A (RaySearch Lab. Stockholm, Sweden) treatment planning system (TPS).
A ± 3.5% range uncertainty combined with ±3 mm setup shifts on 3 coordinate directions (superior/inferior, anterior/posterior, left/right) was used in robust optimization (total 21 scenarios: 3 ranges (−3.5%, 0%, +3.5%) x 7 positions (6 setup shifts + nominal)). Robust optimization can address the setup uncertainties including imaging/registration residual error, machine mechanical accuracy limitations (gantry rotation, couch movement, etc.), spot position uncertainties, etc. For robust evaluation, we prefer CTV V100 > 95%, and many times accept D95 > 95% in all scenarios. For the serial organ dose constraints, they should be within the clinical goal in the range-only scenarios. A typical isodose distribution for a robustness scenario is shown in , in which the target receives >105% prescription dose.
Dosimetric features
Various dosimetric features were obtained from the TPS. These include the beam dose heterogeneity index (BHI) and several robustness features. Dosimetric features were chosen to represent plan quality and were gathered from the initial plan. A Python script running in RayStation was used to obtain the data.
BHI, shown in EquationEquation 1(1)
(1) was defined as the ratio of the max beam dose to the prescription dose. Graphically, BHI represents the tail in .
(1)
(1)
Where Dpre is the prescription dose and Dmax is the beam max dose. Dmax is represented by the dose at several small volumes (.03 cc, .1 cc, .2 cc, .5 cc). The BHI was calculated for every beam.
Plan robustness was evaluated with several features gathered from the highest dose level CTV. Several robustness features were obtained from the shoulder of the dose-volume histogram used for robust evaluation. Success rate was defined as the fraction of robustness scenarios where V100 was greater than 95%. The mean CTV V100 and its deviation from the nominal plan, V100 change, shown in EquationEquation 2(2)
(2) , were also gathered.
(2)
(2)
Where n is the number of robustness scenarios. Mean max dose change, shown in EquationEquation 3(3)
(3) , was defined as the max dose’s average deviation from the nominal plan over all the scenarios. Graphically, mean max dose is represented by the average difference in the values at the tails of the DVH shown in .
(3)
(3)
Statistical analysis
SPSS v27 (IBM SPSS, Chicago, IL) was used to perform statistical analysis on the data. Before the analysis, patients with re-plans due to non-clinical reasons were removed. Clinical features and dosimetric parameters from all the patients were analyzed to see which features were correlated to re-plans. A p value of .05 was deemed significant. To determine the significance, different statistical tests were used. Since numerical data were not normally distributed, nonparametric tests were used. The data were independently sampled, so a Mann-Whitney U test was used. Nonparametric tests were used for age, treatment fractions, mean BHI, success rate, mean V100, mean V100 change, and mean max dose change. For categorical data, a chi-square test was used to determine significance. Chi-square tests were used for stage, site, T/N values, p16 value, whether the patient had surgery, surgery margins, whether the patient had concurrent chemotherapy and treatment fractions.
Neural network design
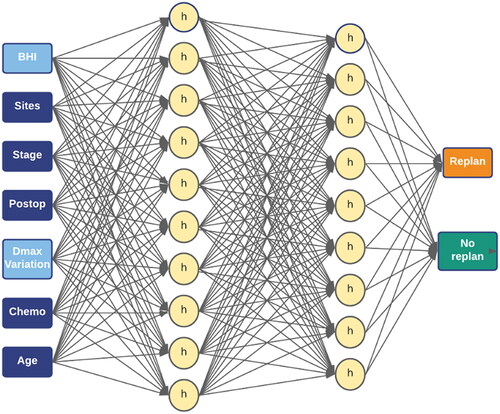
The neural network used for re-plan prediction was designed in SPSS using its multi-layer perceptron (MLP) function. The MLP model, shown in , consisted of an input layer, two hidden layers of 10 and 9 nodes, respectively, and an output layer. A hyperbolic activation function was used for the hidden layers and a softmax activation function was used for the output layer. The model was trained with various subsets of features to find an optimal combination of features. There are 7 inputs in the MLP model: 1) mean BHI, 2) tumor site, 3) tumor stage, 4) whether the patient had surgery, 5) mean max dose change, 6) whether the patient had chemotherapy, 7) age.
Figure 2. Multilayer perceptron neural network for re-plan prediction. BHI: beam heterogeneity index, postop: whether the patient had surgery, dmax variation: max dose change across robustness scenarios, chemo: whether the patient is undergoing chemotherapy, h: hidden unit.
Training data
The model was trained with the clinical and dosimetric features previously mentioned. The data was partitioned into 80% training and 20% testing. Before training, the outliers of the numerical data were filtered. These include a mean BHI < .8 or > 1.5 and a mean max dose change of > 40%. There were 11 outlier patients removed from analysis. The model was trained with 125 patients cases using gradient descent and tested on 35 patients. A detailed description of these patient populations can be found in the supplemental material.
Evaluation
Evaluation was performed in SPSS using prediction accuracy, sensitivity/specificity, and the receiver operating characteristic (ROC) curve. Additionally, sensitivity analysis was performed to determine feature importance.
Results
Numerical features
There was no significant difference between mean BHIs with the max dose taken at .03 cc, .1 cc, .2 cc, and .5 cc, so the mean BHI at .03 cc was used. shows the mean, standard deviation, and p-value for all numerical features. shows the distributions of several numerical features. Mean BHI (p = .005) and mean max dose change (p = .008) were the only significant numerical features.
Figure 3. (a) Distributions of mean beam heterogeneity index (BHI) and success rate. (b) Distributions of mean V100 and max dose change. (c) Normalized importance for all features used in the prediction model. (d) ROC curve for the prediction model. The area under the curve (AUC) is .855.
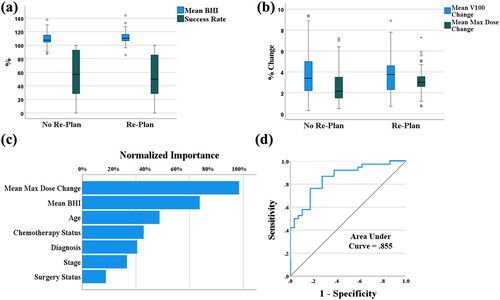
Table 2. Results for numerical features.
Categorical features
For the categorical features, the tumor site (p < .02), chemotherapy status (p < .001), surgery status (p < .001), and treatment fractions (p = 0.00) were all significant, as shown in . The rest of the clinical features were not significant.
Neural network performance
The overall prediction accuracy, sensitivity, and specificity of the training data were 75.7%, 75.0%, and 77.4%, respectively. The overall prediction accuracy, sensitivity, and specificity of the testing data were 71.0%, 76.2%, and 73.1%, respectively. The model performed similarly for both re-plans and non-replans and had an area under the curve (AUC) of .855. Mean BHI, age, and mean max dose change were consistently the most important features () shows the normalized importance of the model’s features and its ROC curve.
Discussion
Limitation of robust optimization
While robust optimization can address most of the setup uncertainties mentioned in the methods section, there are certain random factors that cannot be easily accounted for such as the reproducibility of C-spine curvature, daily variations in shoulder position, cavity filling, and tongue position. Although some of these issues can be mitigated with the newly available 4D robust optimization using multi-images, it may result in increased treatment margins. It is worth noting that despite these measures, anatomical changes remain a common reason for re-planning [Citation27,Citation28].
Clinical impact of statistical results
This study analyzed various dosimetric and clinical features between re-plan and non-replan groups to find parameters with statistical significance. Because we have removed all re-plans due to setup issues, a feature’s statistical significance shows whether it is a good predictor for re-plans due to anatomical changes. However, nonsignificant features can still be helpful to the neural network, which can learn complex relationships that statistical significance tests can’t see.
Tumor stages, T, and N stages are expected to be related to re-plans. The stage of the tumor is directly related to treatment strategy, and thus tumor shrinkage. We did not observe a correlation between these features and plan adaptation. Possible explanations for this are that the stage of the tumor is irrelevant unless the site is also considered or that due to the large number of stages and T/N values, our data were too subdivided to produce significant results.
The correlation of re-plan to the tumor sites is expected. Tumor site has a large impact on the treatment response, and therefore anatomy changes and plan adaptation. The number of data in specific sites is too small to determine which sites are more at risk for plan adaptation.
P16 is not relevant for non-oropharyngeal tumors, so it isn’t a good feature for our model, which applies to all HN sites. When removing the N/A group to investigate the correlation for oropharyngeal tumors, p16 is still not significant (p = .341). Though patients with p16+ tumors will generally have more favorable treatment outcomes [Citation29], they are generally more fit and less likely to lose weight. These counteracting effects may explain the lack of correlation.
Though surgery margins were significant (p = .002), they were not included in the model. Shown in , the significance comes from differences in the non-surgery (N/A group) and the types of margins. This is an indication of the significance of surgery, not the significance of margins. When removing the N/A group, margins are not significant (p = .307).
Whether a patient had surgery was significant (p = .001). Patients with surgery are less likely to have a re-plan, as most parts of the tumor body have been removed and the likelihood of tumor growth is minimal. However, if the surgery happened recently, the surgery bed and flaps (if there are any) tend to change. In these cases, the CT simulation should be postponed to allow recovery and stabilization at those areas. If that is not possible, the patient should be closely monitored with CBCTs and/or QACTs.
Chemotherapy status was significant (p = .001). Patients with chemotherapy have significantly higher re-plan rates than those without chemotherapy: 44.1% vs 13.2%. Chemotherapy will affect patient’s appetite and hence results in weight loss. This is supported by other studies which show that chemotherapy has a direct correlation with weight loss [Citation30,Citation31]
Gender and age had no correlation with re-plans. As shown in , patients without re-plans were, on average, approximately 3 years older than patients with re-plans. We believe re-plans are more common in younger patients due to the better response to treatment. Because age does factor in greatly in clinical practice and was weakly significant (p = .207), it was also included in the NN.
Treatment fractions were shown to be significant (p = 0.00). Because the average fractions of the re-plan group are higher than the non-replan group (32.6 vs. 30.1), this significance likely comes from the fact that the longer patients are treated, the more likely they are to be re-planned.
Originally, M, the time between surgery and simulation, and whether the patient had definitive/palliative treatment were considered as features. However, only 5 patients had metastases and only 5 underwent palliative treatment. The time between surgery and simulation was expected to correlate with re-plans as the patient’s weight is much more variable soon after surgery. However, because of the large variability of surgery dates (some over a year before simulation), there are too many outliers, making this feature not useful for the NN.
The significance of dosimetric features is shown in . The re-plan group is associated with a higher mean BHI than the no-replan group, 2.22 vs. 2.14 (p = 0.005). For HN plans, beam heterogeneity is needed to spare the critical organs (parotid, oral cavity, etc.). However, the plan robustness will be reduced with higher plan heterogeneity. The beam hot and cold spots will be shifted to different locations due to anatomic changes and setup uncertainties, which results in either hot spots or reduced coverage. When beams contribute much more dose than expected, anatomical changes impact the plan much more harshly than a less heterogenous plan. Because of this, mean BHI was expected to correlate with re-plans. As shown in , the more heterogenous a plan is, the more likely it is to be re-planned. Mean max dose change describes the shift of the hotspot in response to density changes and anatomy shifts. As expected from the less robust plans, patients with high mean max dose changes were more likely to be re-planned, as shown in .
Success rate, mean V100, and mean V100 change were not significant. An explanation for the lack of significance is that approved plans have high success rate, V100, and low V100 change, so these features do not differ much between patients. This is supported by the data .
With these data in mind, tumor site and whether the patient had surgery or chemotherapy are the best clinical predictors and mean BHI and mean max dose change are the best plan quality predictors.
Neither clinical features nor dosimetric parameters alone can accurately predict the re-plan probability. A specifically designed plan may be robust to potential anatomic changes for unfavorable patients (e.g., primary nasopharynx tumor with concurrent chemo) at the expense of larger penumbra, less OARs sparing, and using single field optimization technique and 4D optimization of potential anatomy changes. However, for low re-plan risk patients, it’s preferred to increase the modulation, reduce the uncertainty scenarios to improve the conformity and critical organs’ sparing. Because of these complicated relationships, a NN-based re-plan probability prediction is very useful.
Conclusion
This study aimed to develop a model that can predict the risk of plan adaptation for head and neck (HN) patients prior to treatment. We identified several statistically significant features, including tumor site, whether the patient had chemotherapy or surgery, treatment fractions, mean beam heterogeneity, and average hot spot changes during robust optimization. The NN model demonstrated promising predictive power, with an overall accuracy, sensitivity, and specificity of approximately 75.7%, 75.0%, and 77.4% on the training data, and 71.0%, 76.2%, and 73.1% on the testing data, respectively. The receiver operating characteristic (ROC) curve had an AUC of .855. However, before implementing the model clinically, additional validation is required to ensure its accuracy and reliability on new patients. It is essential to assess the model’s performance in different institutions, as the model’s dependence on planning techniques and treatment planning systems may vary. The predictive power of this prediction model holds great potential for informing physicists and dosimetrists about the need for re-optimization of treatment plans to reduce re-plan probability and identifying the features that contribute most significantly to the likelihood of plan adaptation.
This study presents a valuable step toward developing a predictive model for plan adaptation in HN patients. The model’s accuracy, combined with further validation and customization, could contribute to reducing re-plan rates and enhancing treatment planning efficiency, ultimately improving the overall quality of care for HN patients.
Supplemental Material
Download MS Word (36.8 KB)Acknowledgements
N/A.
Data sharing
Due to ethical/legal/commercial reasons, supporting data is not available.
Disclosure statement
No potential conflict of interest was reported by the author(s).
Data availability statement
Research data are not available at this time.
References
- Holliday EB, Frank SJ. Proton radiation therapy for head and neck cancer: a review of the clinical experience to date. Int J Radiat Oncol Biol Phys. 2014;89(2):292–302. doi: 10.1016/j.ijrobp.2014.02.029.
- Jakobi A, Stützer K, Bandurska-Luque A, et al. NTCP reduction for advanced head and neck cancer patients using proton therapy for complete or sequential boost treatment versus photon therapy. Acta Oncol. 2015;54(9):1658–1664. doi: 10.3109/0284186X.2015.1071920.
- Sio TT, Lin HK, Shi Q, et al. Intensity modulated proton therapy versus intensity modulated photon radiation therapy for oropharyngeal cancer: first comparative results of Patient-Reported outcomes. Int J Radiat Oncol Biol Phys. 2016;95(4):1107–1114. doi: 10.1016/j.ijrobp.2016.02.044.
- Cozzi L, Fogliata A, Lomax A, et al. A treatment planning comparison of 3D conformal therapy, intensity modulated photon therapy and proton therapy for treatment of advanced head and neck tumours. Radiother Oncol. 2001;61(3):287–297. doi: 10.1016/s0167-8140(01)00403-0.
- Barker JL, Garden AS, Ang KK, et al. Quantification of volumetric and geometric changes occurring during fractionated radiotherapy for head-and-neck cancer using an CT/linear accelerator system. Int J Radiat Oncol Biol Phys. 2004;59(4):960–970. doi: 10.1016/j.ijrobp.2003.12.024.
- Chencharick JD, Mossman KL. Nutritional consequences of the radiotherapy of head and neck cancer. Cancer. 1983;51(5):811–815. doi: 10.1002/1097-0142(19830301)51:5<811::AID-CNCR2820510511>3.0.CO;2-M.
- Hui Z, Zhang X, Starkschall G, et al. Effects of interfractional motion and anatomic changes on proton therapy dose distribution in lung cancer. Int J Radiat Oncol Biol Phys. 2008;72(5):1385–1395. doi: 10.1016/j.ijrobp.2008.03.007.
- Donaldson SS, Lenon RA. Alterations of nutritional status: impact of chemotherapy and radiation therapy. Cancer. 1979;43(S5):2036–2052. doi: 10.1002/1097-0142(197905)43:5+<2036::AID-CNCR2820430712>3.0.CO;2-7.
- Müller BS, Duma MN, Kampfer S, et al. Impact of interfractional changes in head and neck cancer patients on the delivered dose in intensity modulated radiotherapy with protons and photons. Phys Med. 2015;31(3):266–272. doi: 10.1016/j.ejmp.2015.02.007.
- Ahn PH, Lukens JN, Teo BK, et al. The use of proton therapy in the treatment of head and neck cancers. Cancer J. 2014;20(6):421–426. doi: 10.1097/PPO.0000000000000077.
- Szeto YZ, Witte MG, van Kranen SR, et al. Effects of anatomical changes on pencil beam scanning proton plans in locally advanced NSCLC patients. Radiother Oncol. 2016;120(2):286–292. doi: 10.1016/j.radonc.2016.04.002.
- Chang JY, Li H, Zhu XR, et al. Clinical implementation of intensity modulated proton therapy for thoracic malignancies. Int J Radiat Oncol Biol Phys. 2014;90(4):809–818. doi: 10.1016/j.ijrobp.2014.07.045.
- Hild S, Graeff C, Rucinski A, et al. Scanned ion beam therapy for prostate carcinoma: comparison of single plan treatment and daily plan-adapted treatment. Strahlenther Onkol. 2016;192(2):118–126. doi: 10.1007/s00066-015-0925-0.
- Mohamed N, Lee A, Lee NY. Proton beam radiation therapy treatment for head and neck cancer. Precision Radiation Oncology. 2022;6(1):59–68. doi: 10.1002/pro6.1135.
- Simone CB, Ly D, Dan TD, et al. Comparison of intensity-modulated radiotherapy, adaptive radiotherapy, proton radiotherapy, and adaptive proton radiotherapy for treatment of locally advanced head and neck cancer. Radiother Oncol. 2011;101(3):376–382. doi: 10.1016/j.radonc.2011.05.028.
- Castelli J, Simon A, Rigaud B, et al. Adaptive radiotherapy in head and neck cancer is required to avoid tumor underdose. Acta Oncol. 2018;57(9):1267–1270. doi: 10.1080/0284186X.2018.1468086.
- Bobić M, Lalonde A, Sharp GC, et al. Comparison of weekly and daily online adaptation for head and neck intensity-modulated proton therapy. Phys. Med. Biol. 2021;66(5):055023. doi: 10.1088/1361-6560/abe050.
- Hoffmann L, Alber M, Jensen MF, et al. Adaptation is mandatory for intensity modulated proton therapy of advanced lung cancer to ensure target coverage. Radiother Oncol. 2017;122(3):400–405. doi: 10.1016/j.radonc.2016.12.018.
- Hansen EK, Bucci MK, Quivey JM, et al. Repeat CT imaging and replanning during the course of IMRT for head-and-neck cancer. Int J Radiat Oncol Biol Phys. 2006;64(2):355–362. doi: 10.1016/j.ijrobp.2005.07.957.
- Wu Q, Chi Y, Chen PY, et al. Adaptive replanning strategies accounting for shrinkage in head and neck IMRT. Int J Radiat Oncol Biol Phys. 2009;75(3):924–932. doi: 10.1016/j.ijrobp.2009.04.047.
- Kajikawa T, Kadoya N, Ito J, et al. Automated prediction of dosimetric eligibility of patients with prostate cancer undergoing intensity-modulated radiation therapy using a convolutional neural network. Radiol Phys Technol. 2018;11(3):320–327. doi: 10.1007/s12194-018-0472-3.
- Isaksson M, Jalden J, Murphy MJ. On using an adaptive neural network to predict lung tumor motion during respiration for radiotherapy applications. Med Phys. 2005;32(12):3801–3809. doi: 10.1118/1.2134958.
- Song Y, Hu J, Liu Y, et al. Dose prediction using a deep neural network for accelerated planning of rectal cancer radiotherapy. Radiother Oncol. 2020;149:111–116. doi: 10.1016/j.radonc.2020.05.005.
- Surucu M, Shah KK, Mescioglu I, et al. Decision trees predicting tumor shrinkage for head and neck cancer: implications for adaptive radiotherapy. Technol Cancer Res Treat. 2016;15(1):139–145. doi: 10.1177/1533034615572638.
- Lee SH, Han P, Hales RK, et al. Multi-view radiomics and dosiomics analysis with machine learning for predicting acute-phase weight loss in lung cancer patients treated with radiotherapy. Phys Med Biol. 2020;65(19):195015. doi: 10.1088/1361-6560/ab8531.
- Nguyen D, Long T, Jia X, et al. A feasibility study for predicting optimal radiation therapy dose distributions of prostate cancer patients from patient anatomy using deep learning. Sci Rep. 2019;9:1076. doi: 10.1038/s41598-018-37741-x.
- Water S, Albertini F, Weber D, et al. Anatomical robust optimization to account for nasal cavity filling variation during intensity-modulated proton therapy: a comparison with conventional and adaptive planning strategies. Phys Med Biol. 2018;63(2):025020. doi: 10.1088/1361-6560/aa9c1c.
- Fredriksson A, Engwall E, Andersson B. Robust radiation therapy optimization using simulated treatment course for handling deformable registration. Phys Med Biol. 2021;66(4):045010. doi: 10.1088/1361-6560/abd591.
- Adrian G, Carlsson H, Kjellén E, et al. Primary tumor volume and prognosis for patients with p16-positive and p16-negative oropharyngeal squamous cell carcinoma treated with radiation therapy. Radiat Oncol. 2022;17(1):107. doi: 10.1186/s13014-022-02074-7.
- Cacicedo J, Casquero F, Martinez-Indart L, et al. A prospective analysis of factors that influence weight loss in patients undergoing radiotherapy. Chin J Cancer. 2014;33(4):204–210.
- Nazari V, Pashaki A, Hasanzadeh E. The reliable predictors of sever weight loss during the radiotherapy of head and neck cancer. Cancer Treat Res Commun. 2021;26:100281. doi: 10.1016/j.ctarc.2020.100281.