
Abstract
Background
Meningiomas are the most common primary neoplasm of the central nervous system. Previous research on the incidence of meningioma in Finland showed an increase in the age-standardized incidence rate over three decades (1968–1997). In this study, we analysed meningioma incidence in Finland during 1990–2017.
Materials and methods
Data on 9842 meningioma patients were obtained from the Finnish Cancer Registry, and population size by calendar year, sex, and age group from Statistics Finland. The European Standard Population was used to calculate age-standardized incidence rates. Poisson regression was used to evaluate differences by sex and age, and joinpoint regression to examine changes in trend.
Results
At the beginning of the study period, the age-standardized incidence of meningioma for men was 2.35/100,000 and for women 6.96/100,000. In the end, it was 4.09/100,000 and 10.19/100,000, respectively. The annual percent change (APC) for women was +4.6 (95% confidence interval, CI 3.10 to 6.20) from 1990 to 2001 and −1.0 (95% CI −1.70 to −0.30) from 2001 to 2017. For men, the APC was +3.1 (95% CI 0.80–5.40) during 1990–2002 and −0.9 (95% CI −2.10 to 0.30) in 2002–2017. The incidence of meningioma in women was 2.8 times higher than in men (rate ratio 2.81; 95% CI 2.68–2.94).
Conclusions
Meningioma incidence increased in both sexes from 1990, but the trend reversed in 2001–2002. Medical imaging or risk factors do not appear to explain the changes.
Keywords:
Introduction
Meningiomas are the most common primary neoplasm of the central nervous system (CNS). In the United States (2010–2014), meningiomas comprised 37% of all CNS tumors and 53% of non-malignant CNS tumors [Citation1]. Meningiomas originate from the arachnoidal cap cells of the meninges of the brain and spinal cord [Citation2–5]. The majority of meningiomas, ∼75%, are located cerebrally and around 5% spinally [Citation1,Citation6]. Meningiomas, like other brain tumors, are classified according to the 2021 WHO classification [Citation7]. They are generally benign: ∼80% are WHO Grade 1, while 15–20% are atypical (WHO Grade 2) and only 1–3% are malignant (WHO Grade 3) [Citation1,Citation2].
Few factors, such as age and female gender, are known to increase the incidence of meningioma [Citation8,Citation9]. Compared to men, women have at least a 2-fold risk for intracranial meningioma [Citation1,Citation3,Citation6,Citation8] and a 10-fold risk for spinal meningioma [Citation10]. Other established risk factors include high doses of ionizing radiation [Citation11,Citation12] and neurofibromatosis type 2 [Citation13].
Symptoms of meningioma depend on the location and size of the tumor. Symptoms can vary from headaches, seizures, hemiparesis, and visual loss to memory impairment, personality changes, and nausea [Citation14]. Meningiomas, in particular benign meningiomas, can often be asymptomatic. In a Japanese study, nearly 40% of all benign meningiomas were asymptomatic and that proportion increased to almost 50% in patients older than 70 years [Citation15].
Several previous studies have examined the incidence of meningiomas. A Dutch study with 2000 participants aged 45 years or older underwent magnetic resonance imaging of the brain to discover incidental cases and reported a prevalence of incidental meningioma of 1.1% for women and 0.7% for men [Citation16]. A Japanese study based on 10,033 autopsy cases reported the prevalence of incidental intracranial meningioma as 3.5% for women and 1.2% for men [Citation17]. In the United Kingdom, the incidence of meningioma for women was 7.2/100,000 and 3.1/100,000 for men with no clear increase in 1996–2008 [Citation6]. In Finland, Sweden, Norway, and Denmark, an increase in age-standardized (World Standard Population as a reference population) incidence rate (ASR) from 2.6 to 4.5 per 100,000 for women and from 1.4 to 1.9 per 100,000 for men in 1968–1997 [Citation8].
In this study, we examine the incidence of primary intracranial meningioma in Finland during the most recent period available, 1990–2017.
Materials and methods
Data sources
The population of Finland has increased from 4.6 million in 1970 to 5.5 million in 2017. Data on all meningioma cases diagnosed in 1990–2017 were obtained from the nationwide, population-based Finnish Cancer Registry (FCR) established in 1953. FCR receives notifications on every case or strong suspicion of cancer, including benign meningiomas, in Finland from healthcare organizations that have a statutory obligation to provide that information [Citation18]. The cancer registry has four major data sources: clinical notifications from clinicians, pathological notifications from pathology laboratories, the nationwide hospital discharge registry, and death certificates from Statistics Finland. The completeness of FCR for solid cancers has been estimated as 96% [Citation19]. The method of diagnostic confirmation and types of meningiomas are presented in . Data obtained from FCR included the date and basis of diagnosis, histological subtype and grade (1–3) of the tumor, patient age, and sex. We obtained Finnish population size by calendar year, sex, and age group from Statistics Finland [Citation20].
Table 1. Clinical characteristics of meningioma cases, Finland 1990–2017 (N = 9842).
Data analysis
Age-specific and age-standardized incidence rates (ASR) of meningioma were calculated by sex over the entire study period (1990–2017) and in 4-year periods. The ASR per 100,000 with a 95% confidence interval (CI) was calculated for each study year using the direct method, based on the European Standard Population and age-specific rates [Citation21]. Microsoft Excel for Microsoft 365 was used to calculate ASR overall and by sex.
We used Poisson regression with the number of cases as the outcome and population size as an offset term to examine differences by sex and 10-year age group. Poisson regression analyses were performed using IBM SPSS Statistics version 28. Joinpoint Regression Program 4.9.1.0 software was used to evaluate changes in incidence trends during the study period [Citation22,Citation23].
Results
During the study period, several changes took place in the diagnostic confirmation of meningiomas. While 17.5% of the cases were based on autopsy in 1990–1993, the proportion decreased to only 7.4% in 2014–2017. In contrast, histologically confirmed diagnoses increased from 71.1 to 84.1%. Data on cases verified by death certificate only were available since 2015. Among the cases, only 45 (0.65%, 24 in women and 21 among men) were classified as malignant.
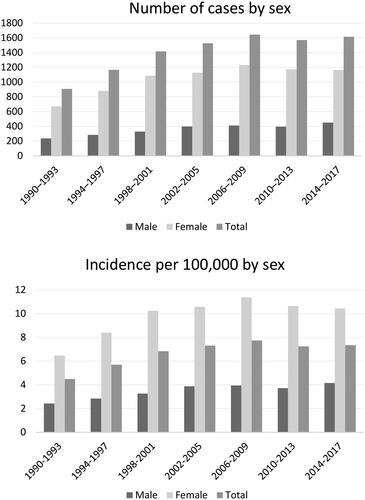
A total of 9842 primary intracranial meningiomas were identified in 1990–2017. The annual number of cases increased consistently over the study period, except for 2010–2013. Meningioma incidence increased from 1990 until 2000, followed by relatively stable rates until 2010, and finally a slight decline towards the end of the study period (). The average annual increase in incidence was nearly 2% (IRR = 1.017, 95% CI 1.014–1.019).
Figure 1. Number of cases and incidence of meningiomas in Finland by 4-year period during 1990–2017 by sex.
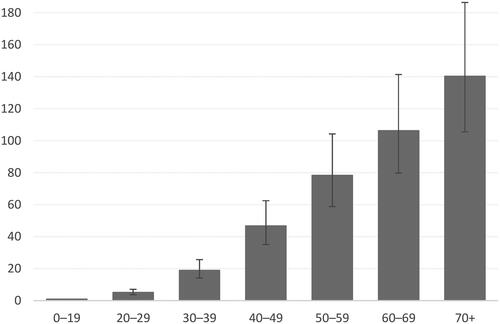
A very steep gradient with age was observed (), with the strongest relative increase up to age 49 years. The largest absolute differences emerged in the age group 50–59 compared to 40–49 and the age group 70+ compared to 60–69 years of age, both <30/100,000.
Figure 2. Incidence rate ratio of meningiomas by 10-year age group (with 95% confidence interval, ages 0–19 as the reference group), Finland 1990–2017.
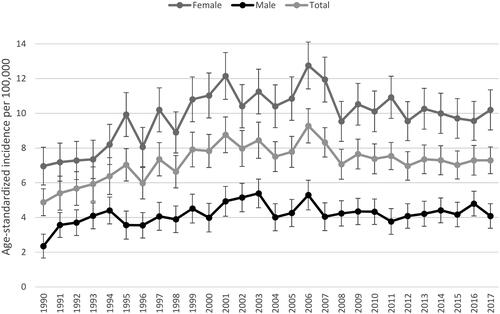
The overall ASR of meningioma was 7.26/100,000 (95% CI 7.12–7.41) during 1990–2017. The incidence of meningiomas was more pronounced for women than for men in all age groups, except the youngest (0–19 years; Appendix A). The overall ASR for women was 9.91 (95% CI 9.69–10.14) and for men 4.23 (95% CI 4.06–4.40). The ASR increased during the study period for women from 6.96 to 10.19 per 100,000, for men from 2.35 to 4.09, and for both sexes combined from 4.88 to 7.29 (). In the Poisson regression analysis, the incidence in women was nearly 3-fold higher than in men (IRR 2.81, 95% CI 2.68–2.94).
Figure 3. Annual age-standardized incidence rates per 100,000 by sex in Finland during 1990–2017 with 95% confidence intervals.
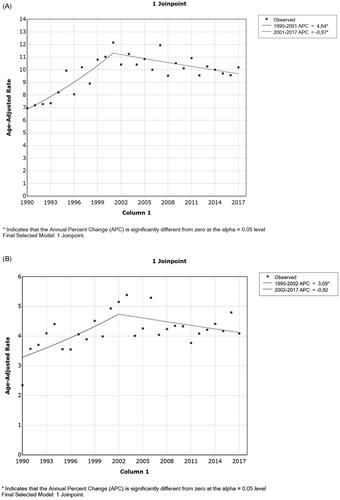
Joinpoint analyses revealed changes in trends for both sexes. The annual percent change (APC) for women was +4.6 (95% CI 3.10 to 6.20) in 1990–2001 and −1.0 (95% CI −1.70 to −0.30) in 2001–2017 (). Men had very similar changes in trend. From 1990 to 2002, the APC was +3.1 (95% CI 0.80 to 5.40) and during 2002–2017, it was −0.9 (95% CI −2.10 to 0.30) ().
Figure 4. Joinpoint analyses of meningioma incidence rates in women (A) and men (B), Finland 1990–2017.
Discussion
In this population-based study, we examined the incidence of primary intracranial meningioma in Finland during 1990–2017. The age-standardized incidence rate was 7.26/100,000 (95% CI 7.12–7.41) overall, 9.91/100,000 (95% CI 9.69–10.14) in women, 4.23/100,000 (95% CI 4.06–4.40) in men. Women had 2–3 times higher incidence compared to men, and this ratio remained unchanged throughout the study period. The incidence of meningioma increased in both sexes from 1990 until 2000, but the trend reversed in 2001–2002.
Our findings align with similar studies conducted in the US and Italy [Citation1,Citation24–27]. In Catania, Italy, the ASR was 7.6/100,000 (95% CI 7.6–8.4) [Citation27]. A study in the U.S. reported had the highest incidence among Black individuals (9.52/100,000) (95% CI 9.32–9.71), followed by White individuals (7.82/100,000) (95% CI 7.76–7.88) [Citation25]. It is appropriate to compare the Finnish incidence rates to those of White individuals as the Finnish population is predominantly White.
Some European studies have reported lower incidence rates than ours. A German study found an ASR of 5.8/100,000 in women and 2.5/100,000 in men in Saarland during 2000–2015 [Citation28]. Similar results were reported in a British study from 1996 to 2008 [Citation6].
When comparing incidence rates between studies, various factors must be considered, including age groups, diagnostic criteria, age standardization, tumor location, and classification. Differences in healthcare availability and quality, population age structure, and the number of autopsies can also impact the results making comparisons across studies challenging.
The more than 2-fold higher incidence in women compared to men is consistent with other studies [Citation1,Citation3,Citation6,Citation8,Citation24,Citation25]. However, the ratio between men and women depends on tumor grade, with little sex difference observed in malignant meningiomas [Citation3,Citation24]. A French study reported a 3-fold difference between women and men in benign meningiomas, but only a 1.4:1 ratio in malignant meningiomas [Citation3]. A study conducted in the Nordic countries, including Finland, from 1968 to 1997 found varying women-to-men ratios across different age groups. Both sexes showed an increasing incidence throughout the study period. On average, the ASR increased in women by 5.6% (95% CI 5.0–6.3) per three-year period and in men by 3.9% (95% CI 3.0–4.9) per three-year period [Citation8].
We observed a clear change in the incidence trend of meningioma in both sexes, a joinpoint occurring in 2001 for women and 2002 for men. Before the turn of the century, the incidence trend was increasing for both sexes (as reported earlier) but reversed thereafter. Possible explanations for this flattening and reversal of the rising trend include changes in the number of autopsies, diagnostic techniques, reporting practices, tumor classification, or a genuine decrease in risk. Further studies are needed to explore these explanations.
The age-standardized incidence rates account for changes in population size and age structure; therefore demographic factors cannot explain the observed variation in rates. In Finland, the frequency of radiological examinations of the head has increased relatively steeply in the past few decades. The Radiation and Nuclear Safety Authority has reported increases of 5–10% in 5 years for head CT, and the Care Register for Health Care maintained by the National Institute for Health and Welfare has reported even steeper increases for head MRI, although there has been a decrease since 2018 [Citation30,Citation31]. However, neither of these data sources provides long-term data, nor do they report the numbers of examinations by age or sex, making detailed examination impossible. It appears that there is no continuous linear increase in the number of meningiomas with the frequency of radiological imaging of the head. Therefore it cannot fully explain the pattern of changes over time. There may be a saturation with no additional increase after a certain level, or a declining completeness of registry notifications could account for the lack of a straightforward relation.
Alternatively, a reduction in population exposure to etiologic agents could affect the incidence. However, the evidence suggesting a reduced meningioma risk associated with allergies [Citation32] or an increased risk with dental radiography with increased risks [Citation33] is not consistent [Citation34,Citation35]. Furthermore, to explain the observed changes in meningioma incidence, changes in risk factors affecting large segments of the population would be required. In addition, we found an initial increase in incidence followed by a downward turn in the trend. Therefore, a single change cannot account for the temporal pattern. Hence, potential explanations for the changes over time currently remain speculative. We consider it very likely that medical imaging contributes substantially, but it alone cannot explain the changes.
Similar changes in the incidence trend have been observed in the United States. In the U.S., an increasing trend in the incidence of benign meningioma was reported for women during 2005–2009 (APC +4.69 [95% CI 3.72–5.67]), followed by a reversal and a decreasing trend in 2009–2015 (APC −0.85 [95% CI −1.30 to −0.41]). For men, the APC was +4.7 (95% CI 2.80–6.64) in 2005–2009 and −0.16 (95% CI −1.01–0.70) during 2009–2015. No significant changes were reported in the incidence of malignant meningioma during the study period [Citation24]. Two other studies in the U.S. also reported similar results during the same period [Citation25,Citation26]. In Sweden, meningioma incidence increased in women between 1980 and 2012 but decreased in men [Citation29].
The strengths of our study include its long study period and comprehensive data from the population-based FCR with high completeness of coverage. The FCR has covered benign CNS tumors since the 1970s, unlike several other cancer registers [Citation19,Citation36]. The completeness of coverage for benign CNS tumors has been lower, however, than for solid cancers (79 vs. 95%) [Citation19]. A regional survey indicated even lower coverage (62–29%) [Citation37]. Similar issues have been encountered with meningiomas in other high-quality cancer registries [Citation38], likely reflecting the fact that automatic notifications generally target malignant diagnoses, and not all meningiomas are operated on and may be verified only radiologically. Nevertheless, the incidence rates of meningioma in Finland tend to be higher than in other Nordic countries [Citation39].
The limitations of the study include a lack of clinical details, small frequencies within tumor subgroups, and one out of five cases lacking histological confirmation (though modern imaging can identify inoperable meningiomas with high certainty). In this study, we focused primarily on clinically diagnosed, symptomatic meningiomas. However, our material comprised 1033 (10.5%) meningiomas diagnosed at autopsy. Those cases have most likely been asymptomatic or with minor symptoms, and therefore do not reflect the risk of developing symptomatic meningioma. The small number of malignant cases did not allow a separate analysis of their incidence. Future studies should consider factors, such as histological subtype, location, and size of meningiomas.
Conclusion
Our study evaluated the incidence of meningioma and observed an increasing incidence until 2000. Thereafter, the incidence remained stable and even declined slightly. Further research is needed to evaluate additional changes in the incidence of meningioma, assess whether the observed trends continue, and explore the underlying reasons.
Disclosure statement
No potential conflict of interest was reported by the author(s).
Data availability statement
The data (meningioma cases and incidence) are available from registry authorities, as according to Finnish regulations, researchers are not allowed to forward confidential non-anonymous health data to any third parties.
Additional information
Funding
References
- Ostrom QT, Gittleman H, Liao P, et al. CBTRUS statistical report: primary brain and other central nervous system tumors diagnosed in the United States in 2010–2014. Neuro Oncol. 2017;19(suppl_5):v1–v88. doi: 10.1093/neuonc/nox158.
- Riemenschneider MJ, Perry A, Reifenberger G. Histological classification and molecular genetics of meningiomas. Lancet Neurol. 2006;5(12):1045–1054. doi: 10.1016/S1474-4422(06)70625-1.
- Champeaux C, Weller J, Katsahian S. Epidemiology of meningiomas. A nationwide study of surgically treated tumours on French medico-administrative data. Cancer Epidemiol. 2019;58:63–70. doi: 10.1016/j.canep.2018.11.004.
- Claus EB, Bondy ML, Schildkraut JM, et al. Epidemiology of intracranial meningioma. Neurosurgery. 2005;57(6):1088–1095. doi: 10.1227/01.neu.0000188281.91351.b9.
- Wiemels J, Wrensch M, Claus EB. Epidemiology and etiology of meningioma. J Neurooncol. 2010;99(3):307–314. doi: 10.1007/s11060-010-0386-3.
- Cea-Soriano L, Wallander M-A, García Rodríguez LA. Epidemiology of meningioma in the United Kingdom. Neuroepidemiology. 2012;39(1):27–34. doi: 10.1159/000338081.
- Louis DN, Perry A, Wesseling P, et al. The 2021 WHO classification of tumors of the central nervous system: a summary. Neuro Oncol. 2021;23(8):1231–1251. doi: 10.1093/neuonc/noab106.
- Klaeboe L, Lonn S, Scheie D, et al. Incidence of intracranial meningiomas in Denmark, Finland, Norway and Sweden, 1968–1997. Int J Cancer. 2005;117(6):996–1001. doi: 10.1002/ijc.21255.
- Krampla W, Newrkla S, Pfisterer W, et al. Frequency and risk factors for meningioma in clinically healthy 75-year-old patients: results of the transdanube ageing study (VITA). Cancer. 2004;100(6):1208–1212. doi: 10.1002/cncr.20088.
- Commins DL, Atkinson RD, Burnett ME. Review of meningioma histopathology. Neurosurg Focus. 2007;23(4):E3–E3. doi: 10.3171/FOC-07/10/E3.
- Brenner AV, Sugiyama H, Preston DL, et al. Radiation risk of Central nervous system tumors in the life span study of atomic bomb survivors, 1958–2009. Eur J Epidemiol. 2020;35(6):591–600. doi: 10.1007/s10654-019-00599-y.
- Ron E, Modan B, Boice JD, et al. Tumors of the brain and nervous system after radiotherapy in childhood. N Engl J Med. 1988;319(16):1033–1039. doi: 10.1056/NEJM198810203191601.
- Smith MJ, Higgs JE, Bowers NL, et al. Cranial meningiomas in 411 neurofibromatosis type 2 (NF2) patients with proven gene mutations: clear positional effect of mutations, but absence of female severity effect on age at onset. J Med Genet. 2011;48(4):261–265. doi: 10.1136/jmg.2010.085241.
- Chan RC, Thompson GB. Morbidity, mortality, and quality of life following surgery for intracranial meningiomas: a retrospective study in 257 cases. J Neurosurg. 1984;60(1):52–60. doi: 10.3171/jns.1984.60.1.0052.
- Kuratsu J-I, Kochi M, Ushio Y. Incidence and clinical features of asymptomatic meningiomas. J Neurosurg. 2000;92(5):766–770. doi: 10.3171/jns.2000.92.5.0766.
- Vernooij MW, Ikram MA, Tanghe HL, et al. Incidental findings on brain MRI in the general population. N Engl J Med. 2007;357(18):1821–1828. doi: 10.1056/NEJMoa070972.
- Nakasu S, Hirano A, Shimura T, et al. Incidental meningiomas in autopsy study. Surg Neurol. 1987;27(4):319–322. doi: 10.1016/0090-3019(87)90005-x.
- FCR. [cited 2019 Jul 31]. Available from: https://cancerregistry.fi/data-collection/cancer-information-notification/
- Leinonen MK, Miettinen J, Heikkinen S, et al. Quality measures of the population-based Finnish Cancer Registry indicate sound data quality for solid malignant tumours. Eur J Cancer. 2017;77:31–39. doi: 10.1016/j.ejca.2017.02.017.
- Statistics Finland. 2019 [cited 2019 Jul 1]. Available from: http://pxnet2.stat.fi/PXWeb/pxweb/fi/StatFin/StatFin__vrm__vaerak/statfin_vaerak_pxt_11rb.px#_ga=2.175923874.1846213454.1562845248-49208598.1561978749
- European Standard Population by Sex. 2019 [cited 2019 Jul 22]. Available from: https://www.opendata.nhs.scot/dataset/standard-populations/resource/29ce4cda-a831-40f4-af24-636196e05c1a
- Kim H-J, Fay MP, Feuer EJ, et al. Permutation tests for joinpoint regression with applications to cancer rates. Statist. Med. 2000;19(3):335–351. doi: 10.1002/(SICI)1097-0258(20000215)19:3 < 335::AID-SIM336 > 3.0.CO;2-Z.
- Joinpoint Regression Program. Version 4.9.1.0. Statistical Methodology and Applications Branch, Surveillance Research Program, National Cancer Institute; 2022.
- Achey RL, Gittleman H, Schroer J, et al. Nonmalignant and malignant meningioma incidence and survival in the elderly, 2005–2015, using the Central brain tumor registry of the United States. Neuro Oncol. 2019;21(3):380–391. doi: 10.1093/neuonc/noy162.
- Lin D, Lin J, Deng X, et al. Trends in intracranial meningioma incidence in the United States, 2004–2015. Cancer Med. 2019;8(14):6458–6467. doi: 10.1002/cam4.2516.
- Bhala S, Stewart DR, Kennerley V, et al. Incidence of benign meningiomas in the United States: current and future trends. JNCI Cancer Spectr. 2021;5(3):pkab035. doi: 10.1093/jncics/pkab035.
- Chebil C, Boumediene F, Cicero CE, et al. Incidence, survival and geoepidemiological analysis of meningiomas and glioblastomas in the province of Catania during the 2003–2016 period. Environ Res. 2021;200:111286. doi: 10.1016/j.envres.2021.111286.
- Holleczek B, Zampella D, Urbschat S, et al. Incidence, mortality and outcome of meningiomas: a population-based study from Germany. Cancer Epidemiol. 2019;62:101562. doi: 10.1016/j.canep.2019.07.001.
- Nilsson J, Järås J, Henriksson R, et al. No evidence for increased brain tumour incidence in the Swedish National Cancer Register between years 1980–2012. Anticancer Res. 2019;39(2):791–796. doi: 10.21873/anticanres.13176.
- Ruonala V. Number of radiological examinations and procedures in Finland in 2021 (in Finnish with English summary) supervision report in health care. STUK-B 295. Vantaa; 2022.
- Finnish Institute for Health and Welfare. Care Register for Health Care-THL; 2023 [cited 2023 Jun 1]. Available from: https://sampo.thl.fi/pivot/prod/fi/thil/perus01/fact_thil_perus01
- Wang P-F, Ji W-J, Zhang X-H, et al. Allergy reduces the risk of meningioma: a meta-analysis. Sci Rep. 2017;7(1):40333. doi: 10.1038/srep40333.
- Memon A, Rogers I, Paudyal P, et al. Dental X-rays and the risk of thyroid cancer and meningioma: a systematic review and meta-analysis of current epidemiological evidence. Thyroid. 2019;29(11):1572–1593. doi: 10.1089/thy.2019.0105.
- Auvinen A, Cardis E, Blettner M, et al. Diagnostic radiological examinations and risk of intracranial tumours in adults—findings from the interphone study. Int J Epidemiol. 2022;51(2):537–546. doi: 10.1093/ije/dyab140.
- Schlehofer B, Blettner M, Moissonnier M, et al. Association of allergic diseases and epilepsy with risk of glioma, meningioma and acoustic neuroma: results from the INTERPHONE international case–control study. Eur J Epidemiol. 2022;37(5):503–512. doi: 10.1007/s10654-022-00843-y.
- Teppo L, Pukkala E, Lehtonen M. Data quality and quality control of a population-based cancer registry: experience in Finland. Acta Oncol. 1994;33(4):365–369. doi: 10.3109/02841869409098430.
- Larjavaara S, Haapasalo H, Sankila R, et al. Is the incidence of meningiomas underestimated? A regional survey. Br J Cancer. 2008;99(1):182–184. doi: 10.1038/sj.bjc.6604438.
- Christensen HC, Kosteljanetz M, Johansen C. Incidences of gliomas and meningiomas in Denmark, 1943 to 1997. Neurosurgery. 2003;52(6):1327–1334. doi: 10.1227/01.neu.0000064802.46759.53.
- Larønningen S, Ferlay J, Beydogan H, et al. NORDCAN: cancer incidence, mortality, prevalence and survival in the Nordic countries, Version 9.2. Association of the Nordic Cancer Registries. Cancer Registry of Norway; 2022 [cited 2023 May 31]. Available from: https://nordcan.iarc.fr/