
Abstract
Background
The Toronto Paediatric Cancer Stage Guidelines are a compendium of staging systems developed to facilitate collection of consistent and comparable data on stage at diagnosis for childhood cancers by cancer registries.
Material and Methods
This retrospective, observational cohort study investigated changes in stage-specific incidence and survival for children diagnosed between 2000-2008 compared to 2009-2017 using the population-based Australian Childhood Cancer Registry. Information on mortality for each patient was available to 31st December 2020. Shifts in incidence by stage were evaluated using chi-square tests, and differences in stage-specific five-year observed survival for all causes of death over time were assessed using flexible parametric models.
Results
Stage was assigned according to the Toronto Guidelines for 96% (n = 7944) of the total study cohort (n = 8292). Changes in the distribution of incidence by stage between the two diagnosis periods were observed for retinoblastoma, with stage 0 increasing from 26% to 37% of cases (p = 0.02), and hepatoblastoma, with metastatic disease increasing from 22% to 39% of cases (p = 0.04). There were large gains in stage-specific survival over time for stage IV rhabdomyosarcoma (five-year adjusted mortality hazard ratio for 2009–2017 compared to 2000–2008 of 0.38, 95% CI 0.19–0.77; p = 0.01), stage M3 for medulloblastoma (HR = 0.41, 95% CI 0.21–0.79; p = 0.01) and metastatic neuroblastoma excluding stage MS (HR = 0.61, 95% CI 0.44-0.84; p < 0.01).
Conclusion
These results indicate that improvements in childhood cancer survival in Australia are most likely due to refined management rather than changes in stage at diagnosis, particularly for metastatic solid tumours. Wide international uptake of the Toronto Guidelines will allow comprehensive evaluation of differences in survival between countries.
Background
The stage of cancer describes the extent of the disease at diagnosis and is a strong indicator of prognosis [Citation1,Citation2]. Population-level data on stage at diagnosis based on internationally uniform staging systems are essential for epidemiologic surveillance, interpretation of geographic and temporal differences in incidence and survival [Citation3], and monitoring of cancer control strategies.
Cancers in adults are typically defined in terms of the anatomic site of the primary tumour using the International Classification of Diseases [Citation4] and are mostly staged using the Tumour-Node-Metastasis (TNM) system [Citation2,Citation5]. Childhood cancers are different in that they are classified according to the type of tissue in which the cancer originates [Citation6]. Many childhood cancers form in haematopoietic, lymphoid or embryonal tissue and consequently, the TNM system is not suitable for staging. Furthermore, different staging systems have been in use for the same type of childhood cancer. Recognising the need for a uniform approach, the “Toronto Paediatric Cancer Stage Guidelines” (or Toronto Guidelines) were published by an international panel of experts [Citation1,Citation7], in order to standardise the collection of stage at diagnosis for childhood cancer by population registries. They contain consensus recommendations on staging systems for each of 15 different types of childhood cancer [Citation7].
Survival for many childhood cancers has continued to increase over recent years [Citation8–10]. It is unclear, however, whether this progress has been due in part to children being diagnosed at a lower stage, and/or because of improved stage-specific survival. In the current study, our aims were to use a national databank to assess changes in the distribution of incident cases by stage at diagnosis as well as to examine variation in stage-specific survival from the year 2000 onwards. The issue of how stage-specific incidence and survival varies over time for childhood cancer at the population level has not been assessed in the scientific literature to date.
Material and methods
Australian Childhood Cancer Registry
A retrospective, observational cohort study was conducted (see Supplementary Table 1 for further details). All de-identified data used in the study were sourced from the Australian Childhood Cancer Registry (ACCR). Ethics approval for the operation of the ACCR is held through the Children’s Health Queensland Hospital and Health Service Human Research Ethics Committee (HREC04/QRCH/18).
The study cohort comprised children (ages 0–14) who were residents of Australia and diagnosed between 2000–2017 with a type of cancer included in the Toronto Guidelines. The type of cancer is coded within the ACCR according to the International Classification of Childhood Cancers, 3rd edition (ICCC-3) [Citation6]. As specified in the ICCC-3 [Citation6], intracranial and intraspinal tumours of benign or uncertain behaviour are included in addition to all malignant neoplasms.
Data held in the ACCR are obtained from a variety of sources. Every state and territory cancer registry in Australia provides information on diagnosis, survival and demographic characteristics to the ACCR on an annual basis for incident cases of childhood cancer registered within their jurisdiction. Population coverage of the ACCR is therefore considered complete given that cancer (excluding keratinocyte skin cancers) is a notifiable disease throughout Australia. The vital status of each patient is updated via regular linkage with the National Death Index held by the Australian Institute of Health and Welfare [Citation11], covering all deaths that occur within Australia.
Clinical information including treatment details and stage at diagnosis are also collected within the ACCR by two experienced clinical coders, who examine each patient’s medical records at the nine specialist, paediatric oncology treating hospitals in Australia. In particular, the component data items required for staging were obtained from diagnostic imaging, cytology, histology and haematology reports, admission notes, doctors’ correspondence, physical examination notes and any other relevant records, depending on the type of cancer. Extracted information was recorded in a customised application containing algorithms to automatically assign stage [Citation12], and then added to the ACCR. Possible reasons for the stage not being assigned, based on previous feasibility testing, are documented elsewhere [Citation12].
Toronto Paediatric Cancer Stage Guidelines
lists the childhood cancers included in the current Toronto Guidelines, along with the selected staging system [Citation7] (see also Supplementary Table 2 for a summary of the definitions for each staging category by type of cancer). The Toronto Guidelines involve a two-tiered approach in which the more detailed Tier 2 stage categories may be collapsed into broader Tier 1 categories, thus maintaining comparability even when some data items are not available [Citation1]. Results are reported according to Tier 2 here, with the exception of hepatoblastoma and testicular germ cell tumours, for which the Tier 1 definitions were used because there were too few cases to produce meaningful estimates under Tier 2. A manual outlining the process for assigning stages from first principles according to the Toronto Guidelines, using component data items from medical records, is available online [Citation20].
Data analysis
Patients were categorized into two groups based on year of diagnosis − 2000–2008 and 2009–2017. Differences in the distribution of incident count over time for key variables of interest (sex, age group at diagnosis and type of childhood cancer) were assessed using either chi-squared tests or Fisher’s exact test (if 20% of the expected cell counts were n < 5).
Five-year observed survival by stage at diagnosis and time period was estimated using the semi-complete cohort method [Citation21], as some patients diagnosed in recent years did not have the full five years of follow-up available. Estimates were calculated when there were at least 20 children diagnosed within a particular stage category during each of the two time periods. Patients diagnosed on the basis of autopsy or death certificate only were excluded from the survival analysis. Follow-up commenced from the date of diagnosis and concluded or was censored at either date of death (any cause), the end date for which mortality was available (31 December 2020) or five years after diagnosis, whichever occurred first, allowing a minimum of three years of potential follow-up for each patient.
Differences in survival by time period were assessed by fitting a flexible parametric model [Citation22], adjusted for age group at diagnosis and sex. A separate model was fitted for each combination of type of cancer and stage. All, or nearly all, children with Hodgkin lymphoma, retinoblastoma, testicular germ cell tumours or ovarian germ cell tumours survived for at least 5 years after diagnosis across both time periods, and so comparisons over time were not warranted or feasible for these cancers. Output from the models was expressed in terms of the mortality hazard ratio (HR) within five years of diagnosis, using the earlier period (2000–2008) as the baseline. In addition, the absolute difference in survival from 2000–2008 to 2009–2017 was calculated from the models, with positive values reflecting an improvement in survival over time.
All analyses were conducted using Stata/SE version 17.0 for Windows (StataCorp LLC, College Station, TX). Confidence intervals for the survival estimates for each time period and corresponding HRs and differences in survival over time were calculated at the 95% level.
Results
Study cohort
The study cohort comprised a total of 8242 children aged under 15 years at diagnosis with one of the cancers included in the Toronto Guidelines, including 3619 (44%) who were diagnosed with cancer between 2000–2008 and 4623 (56%) diagnosed with cancer between 2009–2017 – see . Almost all diagnoses in this cohort were based on cytological or histological examination of the tumour (n = 7899 of 8242, 96%).
Table 2. Study cohort by selected characteristics and period of diagnosis, Australia, 2000–2017.
Overall, a small majority were boys (n = 4571, 55%) and half of the cases were diagnosed within the 0–4 age group (n = 4125, 50%). Acute lymphoblastic leukaemia was the most common type of cancer, accounting for just over one-third of cases (n = 2851, 35%) followed by astrocytoma (n = 1175, 14%) and neuroblastoma (n = 703, 9%). There was no evidence of any differences in the distribution of cases by sex (p = 0.90), age group (p = 0.62) or type of cancer (p = 0.73) when stratified by period of diagnosis.
Incident distribution of stage at diagnosis
Stage was assigned using the Toronto Guidelines for 96% of the overall study cohort (n = 7944 of 8242), ranging from 88% for those with non–rhabdomyosarcoma soft tissue sarcoma (n = 213 of 242) and 90% for rhabdomyosarcoma (n = 295 of 327) to over 99% for astrocytoma (n = 1172 of 1175) and hepatoblastoma (n = 143 of 144). The total percentage of patients that had stage assigned remained similar by diagnosis period (96% in 2000–2008 (n = 3472 of 3619) and 97% in 2009–2017 (n = 4472 of 4623), p = 0.06).
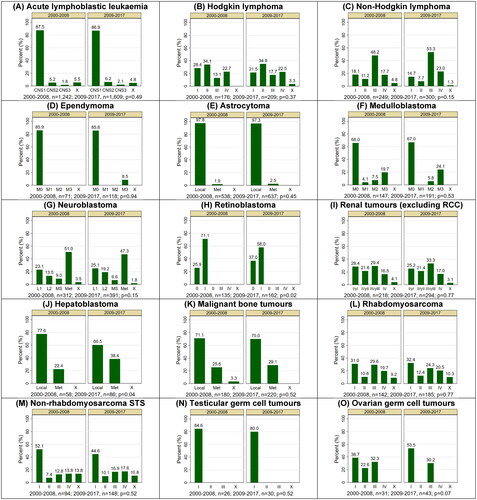
The majority of children (n = 6612 of 7944, 83%) for whom the stage was assigned were diagnosed with localised or regional cancers (noting that the definition of “regional” is cancer–specific and does not apply to all malignancies, but generally indicates spread to nearby lymph nodes and/or organs – refer to and Supplementary Table 2 for further details). Almost all children with retinoblastoma (n = 292 of 293, 99%) or astrocytoma (n = 1146 of 1172, 98%) had localised/regional disease at diagnosis. In contrast, 58% of cases of neuroblastoma (n = 398 of 685) were metastatic at diagnosis (including stage “MS”).
The broad distribution of stages across all cancers was equivalent in both periods, with 84% of children for whom stage was assigned in 2000–2008 reported as having localised/regional disease (n = 2913 of 3472), compared to 83% in 2009–2017 (n = 3699 of 4472; p = 0.16). Further analysis by type of cancer and Tier 2 stage () revealed a significant shift in stage at diagnosis over time for children with retinoblastoma, with the proportion of patients diagnosed at stage 0 increasing from 26% (n = 35 of 135) between 2000–2008 to 37% (n = 60 of 162) between 2009–2017 and a corresponding decrease from 71% (n = 96) to 58% (n = 94) for stage I (p = 0.02). Among children with hepatoblastoma, there was an increase over time in the percentage diagnosed with metastatic disease, from 22% (n = 13 of 58) between 2000–2008 to 38% (n = 33 of 86) between 2009–2017 (p = 0.04).
Figure 1. Incident distribution of stage at diagnosis by type of childhood cancer and period of diagnosis, Australia, 2000–2017a,b,c,d. CNS: central nervous system; Local: localised; Met: metastatic; RCC: renal cell carcinoma; STS: soft tissue sarcoma. Staging categories: Ependymoma and medulloblastoma (M0 - no visible metastases on imaging and no tumour cells in the CSF; M1 - tumour cells in the cerebrospinal fluid; M2 - visible metastases in brain; M3 - visible metastases in spine; M4 - metastasis outside of CNS); Neuroblastoma (L1 - localised; L2 - locoregional; MS - metastases confined to skin, liver, and/or bone marrow for children younger than 18 months old at diagnosis); Renal tumours (y – denotes patients treated on the SIOP protocol); X – stage not assigned. (a). Type of cancer classified according to the International Classification of Childhood Cancers, version 3 (ICCC-3). (b). Cases were staged using the Toronto Paediatric Cancer Stage Guidelines. (c). P-values are for comparison of the stage distribution between the two diagnosis periods and were calculated after excluding cases with unknown stages at diagnosis. (d). Bars relating to cell counts of 5 or fewer patients are shown as missing to protect confidentiality.
Stage-specific survival
Only 8 children in the total study cohort of 8242 (0.1%) were excluded from the survival analysis due to being diagnosed with cancer via autopsy or death certificate only. A total of 1268 deaths (15%) were recorded within five years of diagnosis, although this percentage varied significantly by diagnostic period, n = 714 of 3615 (20%) for 2000–2008 compared to n = 554 of 4619 (12%) for 2009–2017 (p < 0.001). All of the remaining patients diagnosed between 2000–2008 (n = 2901 of 2901, 100%) were followed–up for the full five years compared to 78% (n = 3157 of 4065) among those diagnosed between 2009–2017.
Significant improvements in five-year stage-specific survival for children diagnosed during the more recent period was recorded for several types of cancer ( and ). The greatest increases were observed for advanced solid cancers that had low rates of survival in the earlier period, namely stage IV rhabdomyosarcoma (HR = 0.38, 95% CI 0.19–0.77; p = 0.01), metastases to the spine (stage M3) for medulloblastoma (HR = 0.41, 95% CI 0.21–0.79; p = 0.01) and metastatic neuroblastoma excluding stage MS (HR = 0.61, 95% CI 0.44–0.84; p < 0.01). Smaller, but still significant, improvements in five–year survival occurred for children with stage CNS1 acute lymphoblastic leukaemia (HR = 0.54, 95% CI 0.40–0.74; p < 0.01) and localised astrocytoma (HR = 0.60, 95% CI 0.45–0.81; p < 0.01). There was also evidence of an increase in survival among children with stage III/yIII renal tumours (89% to 99%; HR = 0.10, 95% CI 0.01–0.87; p = 0.04).
Figure 2. Differences in adjusted survival curves from 2000–2008 to 2009–2017 for selected combinations of childhood cancer type and stage at diagnosis, Australia.a,b,c ALL: acute lymphoblastic leukaemia; CNS: central nervous system. Staging categories: Acute lymphoblastic leukaemia (CNS1 - No clinical signs of central nervous system involvement and no blasts in the cerebrospinal fluid); Medulloblastoma (M3 - visible metastases in spine); Neuroblastoma (excludes stage MS - metastases confined to skin, liver, and/or bone marrow for children younger than 18 months old at diagnosis); Renal tumours (y – denotes patients treated on the SIOP protocol). (a) Survival was followed to 31 December 2020. Shaded areas denote the 95% confidence interval for the difference in survival. Positive values indicate survival has improved between the two diagnostic time periods. (b) Type of cancer classified according to the International Classification of Childhood Cancers, version 3 (ICCC-3). (c). The stage was defined by the Toronto Paediatric Cancer Stage Guidelines. d. Excludes renal cell carcinomas.
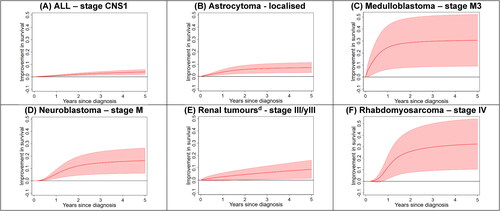
Table 3. Five-year observed survival by stage at diagnosis, type of childhood cancer and period of diagnosis, Australia, 2000-2017a.
The risk of mortality within five years of diagnosis was estimated to be half or less for patients diagnosed between 2009–2017 compared to 2000–2008 for stage I/II non–Hodgkin lymphoma, stage L1 neuroblastoma, stage I/yI renal tumours, localised hepatoblastoma, stage I rhabdomyosarcoma and stage I non–rhabdomyosarcoma soft tissue sarcoma, but none of these differences reached statistical significance. Conversely, survival was estimated to be somewhat lower in the latter period for stage MS neuroblastoma (96% compared to 81%), although the difference was not statistically significant (p = 0.10).
Discussion
This study constitutes the first report of changes over time in stage-specific incidence and survival for various childhood cancers at a population level. We found that the stage distribution had remained stable for most types of childhood cancer in Australia over the last two decades, apart from retinoblastoma and hepatoblastoma. Another key finding was that significant improvements in stage-specific survival at five years from diagnosis were observed among children diagnosed more recently. A better outcome was particularly evident for patients with advanced solid cancers (medulloblastoma, neuroblastoma and rhabdomyosarcoma) that had previously been associated with a poor prognosis.
Nearly all Australian children with retinoblastoma in our study were diagnosed at an early stage irrespective of their period of diagnosis. The increased percentage of children with retinoblastoma being diagnosed as stage 0 (where the tumour is confined to the globe and enucleation is not performed) [Citation18] rather than stage 1 (enucleation with negative margins) [Citation18] between 2009–2017 compared to 2000–2008 is likely to be explained by a change in practice towards eye–conserving treatment. Developments in chemotherapy agents and delivery, in conjunction with focal therapy, have resulted in more retinoblastoma patients avoiding the need for enucleation [Citation23,Citation24]. Other middle to high-income countries have recorded a similar trend towards lower enucleation rates for retinoblastoma over recent years [Citation25–27]. Data from the United States (2000–2014) [Citation25] and the United Kingdom (2006–2014) [Citation26] show that 29% and 40% of retinoblastoma patients were not enucleated, respectively, broadly consistent with the Australian result of 26% between 2000–2008 and 37% between 2009–2017. This contrasts sharply with the situation in low-income regions of the world, such as sub–Saharan Africa and parts of Asia, where it is far more common for children with retinoblastoma to present with either regional or metastatic disease [Citation28,Citation29].
Conversely, an apparent increase in metastatic disease at diagnosis was observed among hepatoblastoma patients. This result may be explained by advances in the resolution of contrast-enhanced computed tomography, which allow better detection of pulmonary metastases [Citation30]. Similar changes in the distribution of stage might have been expected for other solid tumours if progress in imaging was the main reason for the increase in the percentage of children diagnosed with metastatic hepatoblastoma, although this was not the case. It may be that the effect of refinements in computed tomography on stage is more obvious in hepatoblastoma than for other solid tumours, given the dominance of pulmonary metastases among hepatoblastoma patients with stage IV disease at diagnosis [Citation31].
Increases in survival for metastatic childhood solid tumours are likely to be multifactorial and require further scrutiny. There was close agreement between our estimate of 46% five–year survival for metastatic neuroblastoma patients (excluding stage “MS”) diagnosed between 2000–2008 and the results for Stage IV patients aged 18 months or older and diagnosed between 2005–2010 in Germany (45% – clinical trial NB2004) [Citation32]. Patients with stage M neuroblastoma in the United States diagnosed between 2007–2017 had five–year overall survival of 59% [Citation33], also consistent with the result of 62% in Australia between 2009–2017. Gradual improvements in overall survival for patients with high-risk neuroblastoma have been seen following intensification of therapy and the introduction of anti–GD2 immunotherapy [Citation34,Citation35]. Advances in supportive care, particularly for patients with metastatic neuroblastoma undergoing tandem stem–cell transplant, are also a likely contributor [Citation36].
Punyko et al. [Citation37] reported five-year survival of 31% among patients from the United States with metastatic rhabdomyosarcoma who were aged 0–19 years old and diagnosed between 1973-2000, in line with our estimate of 29% from the earlier time period. Two clinical trial studies have shown only modest improvement in overall survival for childhood rhabdomyosarcoma patients with metastatic disease in recent years. The first involved the addition of maintenance chemotherapy consisting of vinorelbine and cyclophosphamide, first published by the European Paediatric Soft Tissue Sarcoma Study Group RMS 2005 trial [Citation38]. The second study, from the Children’s Oncology Group (COG ARST0431) [Citation39], showed that multi-agent, dose-compressed chemotherapy produced an increase in event-free survival but only for patients with no more than one risk factor. A better understanding of how the improvement in overall survival observed here for stage IV rhabdomyosarcoma relates to these clinical trial findings would ideally require more in-depth investigation of underlying risk factors such as age, histology, site of the original tumour, sites of metastases, and total metastatic sites [Citation40], although the small number of cases available makes any stratification of the survival estimates problematic. Our results may instead reflect the ability of current treatments to temporarily control tumour spread and keep patients alive for longer, rather than demonstrating an improvement in cure rate, as no new regimens have been introduced between the two study periods and intensification of therapy has not significantly impacted the stubbornly low long-term event-free survival rates for most patients presenting with metastatic rhabdomyosarcoma.
A study of medulloblastoma patients in Canada aged 0-17 at diagnosis between 1990–2009 showed a five-year survival rate of 60% for stage M3 [Citation41], double the estimate of 31% between 2000–2008 in Australia. Clinical trials conducted over the past three decades by the Children’s Oncology Group (POG 9031 [Citation42] and COG ACNS0332 [Citation43]) and St Jude Children’s Research Hospital (SJMB-96 [Citation44] and SJMB-03 [Citation45]), corresponding to the most common treatment approaches for medulloblastoma in Australia, have consistently reported five-year overall survival between 69% to 75% for patients with high-risk medulloblastoma (which includes a large proportion of patients with metastatic disease). These results are again somewhat higher than the estimate of 61% for medulloblastoma stage M3 between 2009–2017 in Australia, although not quite comparing like with like. It seems possible that the large change in survival we observed for patients with stage M3 medulloblastoma over the study interval was, at least in part, due to a correction to an unusually low estimate in the earlier period (based on only 29 children) rather than a real increase.
The five-year observed survival estimate of 99% for stage III/yIII renal tumours among children diagnosed between 2009–2017 is unusually high. The assignment of stage and mortality status of each patient within that group was rechecked and confirmed to be correct. In the absence of any plausible explanation, this result may represent a statistical anomaly.
A main strength of the current study was the population-level coverage of all cases of childhood cancer diagnosed throughout Australia over almost two decades. All information used to assign stage was collected by the same two experienced clinical coders who adhered to the published protocol [Citation20], allowing a high level of consistency. There are also several limitations to consider. The groupings by year of diagnosis were governed by the fact that 18 years of cases were available, so the time period was divided evenly in half, rather than the periods being determined by any clinical factors, such as a change in treatment protocols. Future studies which tailor the diagnostic time periods to match changes in clinical practice by type of cancer and stage may be more informative. Stratification by type of cancer, stage and diagnostic period resulted in relatively small cell sizes which limit the precision of the corresponding survival estimates and reduce the statistical power to determine differences. The large number of comparisons made between time periods for both incidence and survival by type of cancer and stage at diagnosis raises the possibility of some spurious findings being deemed statistically significant at the 95% level of confidence. In addition, it is possible that some of the variation in stage-specific survival between the two diagnostic periods may be due to changes in the distribution of other prognostic factors not considered in the analysis (such as genetic risk factors). Deaths that occur outside Australia are not captured in the National Death Index, and therefore any patients who die overseas within five years of diagnosis are incorrectly assumed to be alive. However, the small proportion of such cases is likely to be similar in each time period, and as such, is expected to have minimal effect on assessing changes in survival over time.
In conclusion, our results show that the distribution of stage at diagnosis has changed very little over time for children with cancer in Australia, with the exception of retinoblastoma and hepatoblastoma. Improvements in overall survival for many types of childhood cancer over the last two decades [Citation8] are therefore unlikely to be explained by a shift from more advanced to less advanced disease at diagnosis; rather, the observed increases are at a stage-specific level and reflect the implementation of more effective therapies developed through large clinical trials. It should be noted, however, that some of these novel therapies prolong survival rather than curing patients. Therefore, it may be beneficial to consider longer-term stage-specific survival (at least 10 years from diagnosis) in future studies as the data become available. Although we have primarily focussed on Tier 2 of the Toronto Guidelines in this study, which characteristically offer greater granularity when interpreting the results, it is expected that Tier 1 staging would also allow for effective measurement of shifts in stage-specific incidence and survival in settings where collection of Tier 2 data is not practical. The rarity of childhood cancer also underlines the importance of pooling data across countries when conducting studies of childhood cancer epidemiology. As more registries around the world incorporate the collection of stage for childhood cancer using the Toronto Guidelines [Citation46], researchers will be able to make better-informed international comparisons of stage-specific survival, which in turn may help to highlight where the greatest gains in survival have been, and may be, achieved.
| Abbreviations | ||
| ACCR | = | Australian Childhood Cancer Registry |
| CI | = | confidence interval |
| CNS | = | central nervous system |
| HR | = | hazard ratio |
| ICCC-3 | = | International Classification of Childhood Cancers, 3rd edition |
| RCC | = | renal cell carcinoma |
| TNM | = | tumour-node-metastasis staging system |
Supplemental Material
Download MS Word (19.6 KB)Supplemental Material
Download MS Word (19.3 KB)Acknowledgments
The Australian Childhood Cancer Registry operates with the assistance of all Australian State and Territory Cancer Registries, the Australian Institute of Health and Welfare and the Medical Records Department at each of the major paediatric oncology treating hospitals throughout Australia. The authors wish to acknowledge the work performed by the staff of the ACCR, including Leisa O’Neill, Chloe Henshaw, Leanne Keeley and Anne Currell.
Disclosure statement
No potential conflict of interest was reported by the author(s).
Data availability statement
Unit record data that support the findings of this study are not publicly available through the Australian Childhood Cancer Registry due to privacy and ethical restrictions but may be requested directly from the data custodians at the state and territory cancer registries and treating hospitals (subject to all necessary ethics approvals). Please contact [email protected] for further details.
Additional information
Funding
References
- Gupta S, Aitken JF, Bartels U, et al. Paediatric cancer stage in population-based cancer registries: the Toronto consensus principles and guidelines. Lancet Oncol. 2016;17(4):e163-172–e172. doi: 10.1016/S1470-2045(15)00539-2.
- Piñeros M, Parkin DM, Ward K, et al. Essential TNM: a registry tool to reduce gaps in cancer staging information. Lancet Oncol. 2019;20(2):e103–e111. doi: 10.1016/S1470-2045(18)30897-0.
- Walters S, Maringe C, Butler J, et al. Comparability of stage data in cancer registries in six countries: lessons from the international cancer benchmarking partnership. Int J Cancer. 2013;132(3):676–685. doi: 10.1002/ijc.27651.
- Fritz A, Percy C, Jack A, et al. editors. International classification of diseases for oncology (ICD-O). Third edition. Geneva, Switzerland: WHO; 2000.
- Brierley J, Gospodarowicz M, Wittekind C, editors. The TNM classification of malignant tumours., 8th edition. Hoboken, NJ: John Wiley and Sons Inc; 2017.
- Steliarova-Foucher E, Stiller C, Lacour B, et al. International classification of childhood cancer, third edition. Cancer. 2005;103(7):1457–1467. doi: 10.1002/cncr.20910.
- Gupta S, Aitken J, Bartels U, et al. Development of paediatric non-stage prognosticator guidelines for population-based cancer registries and updates to the 2014 Toronto paediatric cancer stage guidelines. Lancet Oncol. 2020;21(9):e444–e451. doi: 10.1016/S1470-2045(20)30320-X.
- Youlden DR, Baade PD, Moore AS, et al. Childhood cancer survival and avoided deaths in Australia, 1983–2016. Paediatr Perinat Epidemiol. 2023;37(1):81–91. doi: 10.1111/ppe.12895.
- Schindler M, Belle FN, Grotzer MA, et al. Childhood cancer survival in Switzerland (1976-2013): time-trends and predictors. Int J Cancer. 2017;140(1):62–74. doi: 10.1002/ijc.30434.
- Siegel DA, Richardson LC, Henley SJ, et al. Pediatric cancer mortality and survival in the United States, 2001–2016. Cancer. 2020;126(19):4379–4389. doi: 10.1002/cncr.33080.
- Australian Institute of Health and Welfare. National Death Index (NDI) Canberra: AIHW; 2022. Available from: https://www.aihw.gov.au/about-our-data/our-data-collections/national-death-index. Accessed 30 November 2022.
- Aitken JF, Youlden DR, Moore AS, et al. Assessing the feasibility and validity of the toronto childhood cancer stage guidelines: a population-based registry study. Lancet Child Adolesc Health. 2018;2(3):173–179. doi: 10.1016/S2352-4642(18)30023-3.
- Winick N, Devidas M, Chen S, et al. Impact of initial CSF findings on outcome among patients with national cancer institute standard- and high-risk B-cell acute lymphoblastic leukemia: a report from the children’s oncology group. J Clin Oncol. 2017;35(22):2527–2534. doi: 10.1200/JCO.2016.71.4774.
- Carbone PP, Kaplan HS, Musshoff K, et al. Report of the committee on hodgkin’s disease staging classification. Cancer Res. 1971;31(11):1860–1861.
- Murphy SB. Classification, staging and end results of treatment of childhood non-Hodgkin’s lymphomas: dissimilarities from lymphomas in adults. Semin Oncol. 1980;7(3):332–339.
- Harisiadis L, Chang CH. Medulloblastoma in children: a correlation between staging and results of treatment. Int J Radiat Oncol Biol Phys. 1977;2(9-10):833–841. doi: 10.1016/0360-3016(77)90181-x.
- Monclair T, Brodeur GM, Ambros PF, et al. The international neuroblastoma risk group (INRG) staging system: an INRG task force report. J Clin Oncol. 2009;27(2):298–303. doi: 10.1200/JCO.2008.16.6876.
- Chantada G, Doz F, Antoneli CBG, et al. A proposal for an international retinoblastoma staging system. Pediatr Blood Cancer. 2006;47(6):801–805. doi: 10.1002/pbc.20606.
- Prat J, FIGO Committee on Gynecologic Oncology. Staging classification for cancer of the ovary, fallopian tube, and peritoneum. Int J Gynaecol Obstet. 2014;124(1):1–5. doi: 10.1016/j.ijgo.2013.10.001.
- Iinternational Association of Cancer Registries. 2022. Paediatric Cancer Stage Guidelines. [cited 2022 Nov 28] Available from: http://www.iacr.com.fr/index.php?option=com_content&view=article&id=153&Itemid=657.
- Swaminathan R, Brenner H. Statistical methods for cancer survival analysis. In: sankaranarayanan R, Swaminathan RL, E, editors. Cancer survival in africa, asia, the caribbean and Central America (IARC scientific publication no. 162. Lyon: IARC; 2011. p. 7–13.
- Lambert PC, Royston P. Further development of flexible parametric models for survival analysis. Stata. 2009;9(2):265–290. doi: 10.1177/1536867X0900900206.
- Mendoza PR, Grossniklaus HE. Therapeutic options for retinoblastoma. Cancer Control. 2016;23(2):99–109. doi: 10.1177/107327481602300203.
- Brennan RC, Qaddoumi I, Mao S, et al. Ocular salvage and vision preservation using a Topotecan-Based regimen for advanced intraocular retinoblastoma. J Clin Oncol. 2017;35(1):72–77. doi: 10.1200/JCO.2016.69.2996.
- Rajeshuni N, Whittemore AS, Ludwig CA, et al. Racial, ethnic, and socioeconomic disparities in retinoblastoma enucleation: a population-based study, SEER 18 2000-2014. Am J Ophthalmol. 2019;207:215–223. doi: 10.1016/j.ajo.2019.04.015.
- Posner M, Jaulim A, Vasalaki M, et al. Lag time for retinoblastoma in the UK revisited: a retrospective analysis. BMJ Open. 2017;7(7):e015625. doi: 10.1136/bmjopen-2016-015625.
- Luo Y, Zhou C, He F, et al. Contemporary update of retinoblastoma in China: three-Decade changes in epidemiology, clinical features, treatments, and outcomes. Am J Ophthalmol. 2022;236:193–203. doi: 10.1016/j.ajo.2021.09.026.
- Parkin DM, Youlden DR, Chitsike I, et al. Stage at diagnosis and survival by stage for the leading childhood cancers in three populations of sub-Saharan Africa. Int J Cancer. 2021;148(11):2685–2691. doi: 10.1002/ijc.33468.
- Fabian ID, Abdallah E, Abdullahi SU, et al. Global retinoblastoma presentation and analysis by national income level. JAMA Oncol. 2020;6(5):685–695. doi: 10.1001/jamaoncol.2019.6716.
- McCarville MB, Roebuck DJ. Diagnosis and staging of hepatoblastoma: imaging aspects. Pediatr Blood Cancer. 2012;59(5):793–799. doi: 10.1002/pbc.24221.
- Angelico R, Grimaldi C, Gazia C, et al. How do synchronous lung metastases influence the surgical management of children with hepatoblastoma? An update and systematic review of the literature. Cancers (Basel). 2019;11(11):1693. doi: 10.3390/cancers11111693.
- Berthold F, Spix C, Kaatsch P, et al. Incidence, survival, and treatment of localized and metastatic neuroblastoma in Germany 1979–2015. Paediatr Drugs. 2017;19(6):577–593. doi: 10.1007/s40272-017-0251-3.
- Irwin MS, Naranjo A, Zhang FF, et al. Revised neuroblastoma risk classification system: a report from the children’s oncology group. J Clin Oncol. 2021;39(29):3229–3241. doi: 10.1200/JCO.21.00278.
- Yu AL, Gilman AL, Ozkaynak MF, et al. Anti-GD2 antibody with GM-CSF, interleukin-2, and isotretinoin for neuroblastoma. N Engl J Med. 2010;363(14):1324–1334. doi: 10.1056/NEJMoa0911123.
- Park JR, Kreissman SG, London WB, et al. Effect of tandem autologous stem cell transplant vs single transplant on Event-Free survival in patients with High-Risk neuroblastoma: a randomized clinical trial. JAMA. 2019;322(8):746–755. doi: 10.1001/jama.2019.11642.
- Fish JD, Grupp SA. Stem cell transplantation for neuroblastoma. Bone Marrow Transplant. 2008;41(2):159–165. doi: 10.1038/sj.bmt.1705929.
- Punyko JA, Mertens AC, Baker KS, et al. Long-term survival probabilities for childhood rhabdomyosarcoma. A population-based evaluation. Cancer. 2005;103(7):1475–1483. doi: 10.1002/cncr.20929.
- Bisogno G, De Salvo GL, Bergeron C, et al. Vinorelbine and continuous low-dose cyclophosphamide as maintenance chemotherapy in patients with high-risk rhabdomyosarcoma (RMS 2005): a multicentre, open-label, randomised, phase 3 trial. Lancet Oncol. 2019;20(11):1566–1575. doi: 10.1016/S1470-2045(19)30617-5.
- Weigel BJ, Lyden E, Anderson JR, et al. Intensive multiagent therapy, including Dose-Compressed cycles of ifosfamide/etoposide and vincristine/doxorubicin/ cyclophosphamide, irinotecan, and radiation, in patients with High-Risk rhabdomyosarcoma: a report from the children’s oncology group. J Clin Oncol. 2016;34(2):117–122. doi: 10.1200/JCO.2015.63.4048.
- Oberlin O, Rey A, Lyden E, et al. Prognostic factors in metastatic rhabdomyosarcomas: results of a pooled analysis from United States and European cooperative groups. J Clin Oncol. 2008;26(14):2384–2389. doi: 10.1200/JCO.2007.14.7207.
- Johnston DL, Keene D, Kostova M, et al. Survival of children with medulloblastoma in Canada diagnosed between 1990 and 2009 inclusive. J Neurooncol. 2015;124(2):247–253. doi: 10.1007/s11060-015-1831-0.
- Tarbell NJ, Friedman H, Polkinghorn WR, et al. High-risk medulloblastoma: a pediatric oncology group randomized trial of chemotherapy before or after radiation therapy (POG 9031). J Clin Oncol. 2013;31(23):2936–2941. doi: 10.1200/JCO.2012.43.9984.
- Leary SES, Packer RJ, Li Y, et al. Efficacy of carboplatin and isotretinoin in children with high-risk medulloblastoma: a randomized clinical trial from the children’s oncology group. JAMA Oncol. 2021;7(9):1313–1321. doi: 10.1001/jamaoncol.2021.2224.
- Gajjar A, Chintagumpala M, Ashley D, et al. Risk-adapted craniospinal radiotherapy followed by high-dose chemotherapy and stem-cell rescue in children with newly diagnosed medulloblastoma (St jude medulloblastoma-96): long-term results from a prospective, multicentre trial. Lancet Oncol. 2006;7(10):813–820. doi: 10.1016/S1470-2045(06)70867-1.
- Gajjar A, Robinson GW, Smith KS, et al. Outcomes by clinical and molecular features in children with medulloblastoma treated with Risk-Adapted therapy: results of an international phase III trial (SJMB03). J Clin Oncol. 2021;39(7):822–835. doi: 10.1200/JCO.20.01372.
- Botta L, Gatta G, Didonè F, et al. International benchmarking of childhood cancer survival by stage at diagnosis: the BENCHISTA project protocol. PLoS One. 2022;17(11):e0276997. doi: 10.1371/journal.pone.0276997.