
Abstract
Background
The performance of deep learning segmentation (DLS) models for automatic organ extraction from CT images in the thorax and breast regions was investigated. Furthermore, the readiness and feasibility of integrating DLS into clinical practice were addressed by measuring the potential time savings and dosimetric impact.
Material and Methods
Thirty patients referred to radiotherapy for breast cancer were prospectively included. A total of 23 clinically relevant left- and right-sided organs were contoured manually on CT images according to ESTRO guidelines. Next, auto-segmentation was executed, and the geometric agreement between the auto-segmented and manually contoured organs was qualitatively assessed applying a scale in the range [0-not acceptable, 3-no corrections]. A quantitative validation was carried out by calculating Dice coefficients (DSC) and the 95% percentile of Hausdorff distances (HD95). The dosimetric impact of optimizing the treatment plans on the uncorrected DLS contours, was investigated from a dose coverage analysis using DVH values of the manually delineated contours as references.
Results
The qualitative analysis showed that 93% of the DLS generated OAR contours did not need corrections, except for the heart where 67% of the contours needed corrections. The majority of DLS generated CTVs needed corrections, whereas a minority were deemed not acceptable. Still, using the DLS-model for CTV and heart delineation is on average 14 minutes faster. An average DSC=0.91 and H95=9.8 mm were found for the left and right breasts, respectively. Likewise, and average DSC in the range [0.66, 0.76]mm and HD95 in the range [7.04, 12.05]mm were found for the lymph nodes.
Conclusion
The validation showed that the DLS generated OAR contours can be used clinically. Corrections were required to most of the DLS generated CTVs, and therefore warrants more attention before possibly implementing the DLS models clinically.
Background
A crucial step in a modern radiotherapy planning workflow is the identification and manual delineation of a number of different anatomical organs and regions, which are required for the dose optimization step of the planning process where the primary goal is to conform the high dose distribution to the target volumes and spare healthy tissues. Highly accurate delineations are essential and are therefore often associated with meticulous and resource demanding procedures. Despite these efforts, manual delineation suffers from substantial inter-observer variations (IOV) [Citation1–3] that can negatively impact plan quality, consistency and even treatment outcomes. In breast cancer radiotherapy (RT), national and international guidelines for target delineation have been developed [Citation4–6]. Although breast cancer (BC) RT has low rates of acute and late toxicities, studies have demonstrated that radiation doses to the contralateral breast, esophagus, thyroid gland, heart, and lungs can negatively affect patients’ quality-of-life and increase morbidity [Citation7–9]. Manual delineation for BC radiotherapy represent a substantial workload for any typical radiotherapy department. Access to auto-segmentation techniques could reduce the clinicians’ workload, as well as reducing considerable inter- and intra-observer variability in delineation [Citation10].
In order to accelerate and promote improved organ delineation accuracy, several vendors have recently implemented and released deep-learning based auto-segmentation algorithms for use in radiotherapy planning [Citation11–14]. A typical deep-learning organ segmentation model (DLS) is trained using annotated data. However, high quality, well-curated annotated data sets are scarce and hard to obtain. The adherence to general data protection regulations (GDPR) imposes data access and analysis limitations. For practical reasons the models are therefore trained, validated and tested on a fairly limited sample of patients collected within one, or a few, clinical practices. Moreover, the interpretations of delineation guidelines can be subject to local preferences and institutional standards when creating annotated data sets. These aspects can make the trained models prone to data set bias that may jeopardize generalizability and applicability when put into use at different institutions and patient populations. In addition, the inherent complexity of the underlying algorithms challenge the interpretability, explainability and data dependency of the models. This complexity may disguise any conceivable model adaptions required when the model is deployed in a clinical environment different from where it was trained.
The objective of this study was to test the performance of the two automatic organ segmentation models, RSL Breast CT and RSL Thorax-Abdomen CT, for CT images acquired in the thorax and breast regions and made available in the treatment planning system RayStation 11B, SP2 (RaySearch AB, Stockholm, Sweden). In the present work, the geometric agreement between the auto-segmented organs and an institutional “gold standard” consisting of contours delineated by experienced oncologists and radiotherapy technicians was assesed. Furthermore, the readiness and feasibility of integrating the models into clinical practice were addressed by measuring the potential time savings and dosimetric impact on treatment plans.
Material and methods
Patient data
The datasets used for model testing was collected prospectively and included CT images from 30 patients with either left or right sided breast cancer that were treated with radiation therapy at Oslo University Hospital during the time period March to May 2022. All the included patients provided written consent and were given information about the purpose of the study. The study was approved by the Institutional Review Board (IRB, reference number 22/06091).
CT simulation and delineation of reference data
The CT images were acquired without contrast agent on a Siemens Somatom CT-scanner (Siemens Healthcare GmbH, Erlangen, Germany) or a Philips Big Bore CT-scanner (Philips Medical Systems, Cleveland, OH), with a slice thickness of 2 mm. A Deep Inspirational Breath Hold protocol was followed for patients with left-sided BC or when the internal mammary chain was included in the clinical target volume (CTV). All patients were immobilized in a WingSTEP (Elekta, Stockholm, Sweden) with both arms above the head, with the exception of one patient who was immobilized with one arm in a downward position.
For each patient the CT images were imported into RayStation where CTV and organs at risk (OAR) were manually contoured. One oncologist manually contoured target volumes, together with heart, LAD and thyroid gland. This task was shared between two experienced oncologists. For the purpose of this study, breast tissue, all levels of axillary lymph nodes (levels 1–4 and the interpectoral region) as well as the internal mammary chain were delineated according to ESTRO guidelines [Citation4,Citation5], on both left and right side, in all patients regardless of patient specific disease and/or tumour characteristics. Specifically, the following CTVs were contoured for each patient and on each laterality: breast (CTV_breast_L/R) and lymph nodes (CTV_LN_AX1-4_L/R, CTV_LN_AX_Pectoral_L/R, CTV_LN_IMN_L/R). The heart was delineated according to guidelines from Feng [Citation15]. One experienced radiation therapist contoured the remaining organs at risk: right and left lung, spinal cord, sternum, oesophagus and trachea. In total, a number of 690 organs were delineated.
The Raystation models
The tested DLS models in Raystation make use of a 3D U-NET (CNN) deep learning network for image voxel classification and organ segmentation. Initially, one DLS model was trained and validated by RaySearch based on manually delineated organs at risk and target volumes from the CT images of 200 patients with left sided locoregional BC treated with radiotherapy at Ålesund Hospital and St Olavs Hospital in Norway [Citation14]. The organs were delineated according to ESTRO guidelines [Citation4,Citation5] as described in detail by Almberg et al. [Citation14]. Later on, this DLS model was extended by RaySearch to include segmentation of corresponding right sided organs and subsequently restructured to form one separate breast model for segmentation of target volumes relevant to BC (i.e. RSL Breast CT), and one model for segmentation of organs at risk in the thorax-abdomen region (i.e. RSL Thorax-Abdomen CT).
It is in the nature of consensus guidelines that they to some extent compromise based on the input from a number of clinicians in different hospitals, i.e. the guidelines may not be unambigious in all situations and there is the inherent possibility of different institutions interpreting them differently. Prior to the contouring of CTVs and OARs in this project, the ESTRO consensus guidelines were therefore closely scrutinized in a plenary session where participating clinicians, physicists, radiation therapist and model developers took part. The aim was to discuss possible ambiguities in the guidelines, how these had been addressed in the training of the model to uncover potential systematic differences between local practices and expected model performance, as well as to ensure an internal delineation consensus from the guidelines.
Testing of the model
The testing of the model consisted of a qualitative scoring of anatomical accuracy, a geometric evaluation, a dosimetric evaluation and a measure of the time difference when compared to manual contouring.
Qualitative scoring
For each volume generated by the DLS models, a group of two oncologists, two physicists and one radiation therapist evaluated all the model-generated volumes in plenary based on how well they followed consensus guidelines. Each volume was given a score from 0 to 3. The scores were defined as follows: (0) Volume is not acceptable. Complete redraw is necessary. (1) Major corrections to the volume is needed. Minor time gain is expected. (2) Only minor corrections to the volume is needed. Major time gain expected. (3) Volume is accepted without corrections. To analyze where the model underperformed, a checklist with a set of phrases () was generated to specify in more detail where and why the DLS generated contours deviated from the consensus guidelines. This was developed throughout the evaluation of the first patients and more phrases were added for recurring deviations from guidelines as they occurred. Also, free text could be used to describe non frequent deviations. The study group were informed that the volumes being evaluated were generated by a DLS model.
Table 1. To pinpoint areas where the DLS models underperformed, a checklist with a set of phrases was used to describe deviations from guidelines.
Geometric similarity
Geometric similarity was evaluated by calculating the Dice Similarity Coefficient (DCE) and the Hausdorff Distance (HD) [Citation16–18] between the manually contoured volumes and the uncorrected model-generated volumes. The DSC evaluates the intersection of the manually contoured volume and the uncorrected model-generated volume, over the sum of their total volume, with a value of 1 signifying perfect overlap. The HD is generated by calculating the closest distance from each point of the manually delineated contour to the uncorrected model-generated contour. The largest of these distances is defined as the HD and if the contours align perfectly the HD is 0 mm. By evaluating the 95th percentile of the HD (HD95), large outliers are eliminated.
Dosimetric evaluation
On a subset of 10 randomly chosen patients, treatment plans were manually generated to evaluate the dosimetric impact of using the uncorrected DLS generated CTVs. All treatment plans were made using a hybrid volumetric modulated arc therapy (VMAT) technique. This technique utilizes open tangential fields contributing to about 85% of the dose to the breast and about 50% of the dose to the lymph nodes, whereas VMAT is used to deliver the remaining dose. The open fields were conformed to the uncorrected DLS generated CTVs. Likewise, the VMAT optimization objectives were based on achieving a uniform distribution of the prescribed dose (40.05 Gy) to the DLS generated CTVs. Treatment plans were made in a highly standardized way, by using templates with standard field arrangements, a defined distance from CTVs to field edges, a standard set of objectives and a fixed number of optimization iterations before the final treatment plan was ready. To minimize the potential risk of bias, additional objectives to minimize OAR doses further was not applied. Dose Volume Histogram statistics of minimum dose (D98) to the manually delineated CTVs were then evaluated. We also evaluated the minimum dose to a Planning Target Volume (PTV) generated by adding a margin of 5 mm to the CTVs. Adequate dose coverage was defined as a D98 value greater than 95% (38.05 Gy) and 90% (36.05 Gy) of the prescribed dose for the CTVs and PTVs, respectively. In addition, doses to relevant organs at risk were evaluated both for manual and uncorrected DLS generated volumes.
Potential time gain
For each patient, the time to contour each separate organ manually was recorded using a stop watch. At least 6 months later, for a subset consisting of eight randomly chosen patients the time for the oncologists to review and manually correct the DLS generated CTVs on both lateralities and heart contours to comply with clinical practice and ESTRO guidelines, was also recorded.
Results
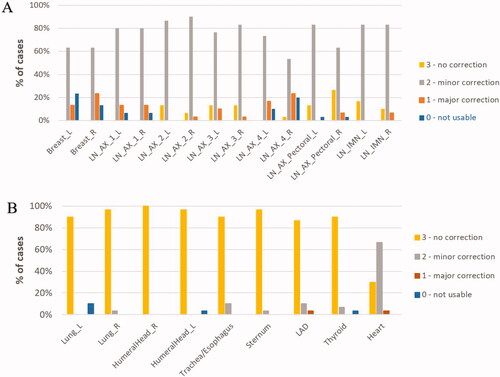
shows the distribution of scores from the qualitative evaluation of the geometric accuracy of the DLS generated CTVs and OARs. Each volume was given a score from 0 to 3, ranging from 0 meaning that a complete redraw was necessary, 1 and 2 described the need for major and minor corrections respectively, and a score of 3 was given if no correction at all was needed. For the CTVs, 88% of the lymph node volumes required no or minor corrections. Furthermore, the majority of the lymph node volumes required minor corrections (78%), whereas no correction was needed for 9.7% of the lymph node volumes. The qualitative scoring of breast tissue was overall lower with 18% of the volumes requiring a complete redraw, 18% of the volumes required major corrections, and minor corrections were needed for 63% of the volumes. None of the model generated breast tissue volumes, irrespective of laterality, could be used without changes. For the OARs, 93% of the DLS generated volumes – excluding the heart – did not need any corrections. For the heart, a score of 3 was recorded for 30% of the cases, a score of 2 was recorded in 67% of the cases, and in 3% of the cases major corrections were required.
Figure 1. Evaluation scores for CTVs (A) and organs at risk (B), respectively. Each volume was reviewed and evaluated based on how well they followed consensus guidelines and given a score on a scale from 0 – 3, describing if the volume was not usable (score 0), usable with major corrections (score 1), usable with minor corrections (score 2) or if the structure could be used without corrections (score 3).
shows a summary of the time – averaged across all 30 patients – measured to manually delineate all the CTVs, i.e., seven on each side (breast, axillary lymph node levels 1–4, interpectoral region and internal mammary chain), as well as the heart, according to ESTRO guidelines. No significant differences was observed between left and right side, and the average time to delineate the breast and lymph nodes summed (level 1–4, interpectoral and internal mammary chain delineated individually) was 03:31 min and 23:27 min, respectively. Average time to delineate the heart was 02:24 min. also shows – for a subset of eight patients – the time measured to review and correct the DLS generated target volumes as well as the heart. Average time needed for correction of the breast and summed lymph nodes was 04:37 min and 09:19 min, respectively. Time to correct the heart generated from the DLS model was 01:08 min. Time gain from using the DLS model, including review and correction of the structures compared to manual delineation was 14:08 min for lymph nodes and 01:16 min for the heart. For the breast tissue, time to auto segment and subsequently correct the DLS generated volumes was on average 01:06 min slower compared to manual delineation. Altogether, using DLS-models to segment CTVs and heart was on average 14 min and 18 s faster per patient (left or right sided BC) compared to manual delineation.
Table 2. The left column show the time recorded for manual delineations according to ESTRO guideline for breast volumes and all lymph node levels summed (level 1–4, interpectoralis and internal mammary chain delineated individually) as well as the heart averaged over all 30 patients.
Time to manually delineate the OARs excluding the heart is shown in . The time to correct these OARs was not recorded. Since as many as 93% of the OARs were given the score 3 and could be used without correction, the potential time gain per patient was estimated to be similar to the recorded time for manual delineation (17:49 min).
Table 3. The table shows the recorded time to manually delineate OARs by the radiation therapist, averaged across all 30 patient.
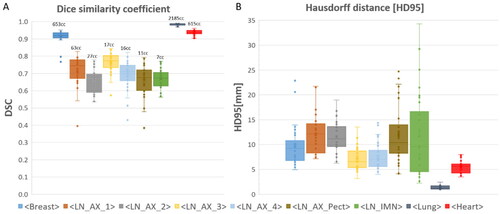
The similarity indices, DSC and HD95, between the DLS generated and manually delineated CTVs as well as for the lung and heart, are presented in respectively. Average values for DSC range from 66% to 98%. The DSC score is highest for breast tissue, lungs and heart (91%, 98% and 94%, respectively), whereas the DSC for the separate nodal levels vary from 66% to 76%. The corresponding average HD95 values range from 1.35 mm to 12.05 mm. The lowest values of HD95 for CTVs was found for axillary lymph node levels 3 and 4, with values of 7.0 and 7.7 mm respectively. The HD95 for the remaining axillary lymph node levels were all approximately 12 mm, whereas the HD95 for the breast tissue was 9.8 mm. The heart and lungs both have low HD95 values (5.6 mm and 1.4 mm respectively). Similarity indices were also calculated between the corrected DLS generated CTVs and the manually delineated CTVs (supplementary Figure 1). In most cases, the DSC and HD95 values were improved for the corrected DLS volumes compared to corresponding values of the uncorrected ones. Statistically significant improvements are indicated in supplementary Figure 1. By visual inspection the corrected DLS structures were predominantly corrected in the cranio-caudal direction, and thereby decreasing HD95 and increasing DSC in many of the structures.
Figure 2. Similarity indices comparing manual contours to uncorrected DLS- generated volumes. Dice Similarity Coefficient (A) and 95th percentile Hausdorff distance (B) are shown for all target volumes, together with lungs and heart. Median values are marked with a line, average values are marked with a cross, 1st and 3rd quartile are marked in the boxplot, and outliers are shown as dots. Average volumes for each contour are denoted above the boxplot.
The phrase statistics from the DLS generated CTVs that received a score of 2 are presented below (). Examples that demonstrated the use of the phrases are shown in and . The phrase describing the segmentation of the most cranial organ part as incomplete/speckled (P1) is used for 97% of the breast tissues and for 78% of the lymph nodes. Similarly, the phrase describing the segmentation of the most caudal organ part as incomplete/speckled (P4), was used for 23.7% of the breast tissues and for 29.1% of the lymph nodes. Furthermore, for 69.3% of the lymph nodes the segmented individual axillary lymph node level started too late relative to visible vasculature (P6), reflecting a more grave deviation from the guidelines. This was pronounced in all the individual lymph node levels ranging from 41% to 89% for individual levels. Additionally, some of the phrases were specific to individual CTVs. The phrase describing that the jugular vein was not included in axillary lymph node level 4 (P8) occurred frequently (in 38.5% of the level 4 lymph nodes). Similarly, a majority of axillary lymph nodes level 1 does not conform to the guidelines with regards to accounting for the caput humeri PRV (P5). This was observed for 94% of the level 1 lymph nodes. For breast tissue specifically, the DLS segmentation extended into the musculature or the ribs or the chest wall for 26% of the cases (P11).
Figure 3. Examples of deviations from guidelines by using the DLS model to generate breast (left) and axillary lymph node level 4 (middle and right). Uncorrected model generated volumes are shown in red, reference volumes (manual delineations) are shown in dark green and corrected DLS volumes are shown in bright green. The example shows a DLS generated breast that is incomplete/speckled cranially (P1) and a DLS generated axillary lymph node level 4 that is incompletely outlined cranially and caudally (P1/P4).
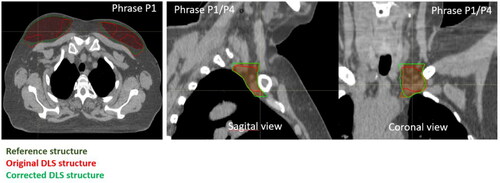
Figure 4. Examples of typical deviations from consensus guidelines. The upper left example shows a DLS generated level 1 axillary lymph node contour (white) that does not take into account caput humeri PRV (the volumes overlap) (P5). The upper right example shown a DLS generated level 4 axillary lymph node contour (pink) and the corresponding manually outlined contour (brown). The DLS generated contour starts too late relative to visible vasculature (P6). The lower left example shows a DLS generated level 4 axillar lymph node (yellow) where the jugular vein is not included (P8). The lower right example illustrates a DLS generated breast tissue (blue) that is contoured into musculature and/or rib and/or chest wall (P11).
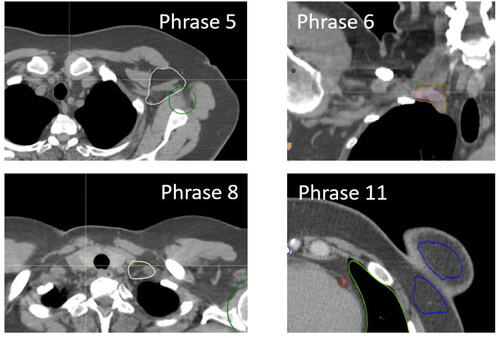
Table 4. The most frequently used phrases for the DLS generated CTVs that received a score of 2.
demonstrates the dose coverage to the manually delineated CTVs following a dose optimization using the uncorrected DLS generated CTVs. In most cases (83%) the dose coverage of the CTVs was adequate. However, an under dosage (D98 < 95%) of axillary levels 4, 3, 2 and interpectoral nodes, was observed in 10%, 40%, 30% and 10% of the cases, respectively, and in 30% breast tissue cases. In summary, adequate CTV coverage (D98 > 95%) was achieved for 70% and 85% of the breast and lymph nodes, respectively. shows that a suboptimal dose coverage (D98 < 90%) for the PTVs was observed in 41% of the cases. In addition, the calculated dose metrices for manually delineated OARs and uncorrected DLS OARs were similar () with paired p-values not reaching signifivant levels for all volumes except from for the maximum dose to the spinal canal (p < 0.05). However, the observed difference in maximum dose to the spinal canal is not expected to be clinically relevant (7.4 vs 7.2 Gy).
Figure 5. Dose coverage to the manually delineated CTVs (A) or PTVs (B) following a treatment plan generation and dose optimization using the uncorrected DLS generated CTVs for 10 patients. Adequate dose coverage was defined as a D98 value greater than 95% (38.05 Gy) and 90% (36.05 Gy) of the prescribed dose for the CTVs and PTVs, respectively (marked with a line).

Table 5. Dosimetric parameters for uncorrected DLS model structures and manual delineations. Statistically significant differences are marked by an asterisk (p < 0.05, using a paired difference t-test). All treatment plans were optimized to achieve a homogeneous dose to the uncorrected DLS CTVs of 40.05 Gy.
Discussion
The focus of this study was to evaluate the anatomical correctness of DLS models for automatic identification of CTVs and OARs in BC patients. A multidisciplinary group evaluated all CTVs and OARs in plenary, remarked how the DLS generated organs deviated from guidelines, and determined a qualitative accuracy score for each organ. We found that the auto-segmented OARs received excellent scores; a majority of the organs did not need any correction. The results from the dosimetric evaluation support these findings, as using the OARs generated by the DLS models did not result in clinically relevant dose differences compared to using manually delineated OARs. On the other hand, most CTVs needed minor or major corrections before they were considered clinically acceptable. This is in line with other publications that qualitatively validated DLS models for auto segmentations [Citation14,Citation19]. The need to manually review and correct the CTVs using the present DLS models seem to be evident. In this study, we evaluated the qualitative organ scores by consensus. This way, the whole study group gained knowledge of the model performance, which is probably advantagous if the model is to be implemented in the clinic. By doing the evaluation in plenary, a joint decision for each structure was reached and this mitigated possible differences or biases by different oncologists, and ensured that each structure was evaluated thouroughly and in a standardized way. However, by evaluating in plenary, one may run the risk of the participants in the study group being insufficiently adversarial and possibly too much in accordance with each other.
Our findings suggest that significant time gains can be achieved by using the DLS for auto-segmentation of the OARs and CTVs, even though the majority of auto-segmented CTVs need revisions.
We aimed to describe in detail how the DLS generated CTVs deviated from guidelines, both to provide feedback for model development and to gain insight in the strengths and weaknesses of the models. We focused our analysis mainly on the segmented CTVs that received a score of 2, indicating minor corrections were needed. In our study, the DLS generated CTVs often deviated from the guidelines in the most cranial part of the volume. This was especially pronounced for the lymph nodes, where the model often started the segmentation too late with respects to the vasculature. In addition, the inherent 3D nature of the DLS segmentation algorithms often gave an incomplete or fragmented rendering of the cranial parts adversely influencing the evaluation scores, as was also reported in the work of Almberg et al. [Citation14].
The DSC is sensitive to volume effects as errors are penalized more in small volumes compared to large [Citation17]. The volumes of the CTVs representing the nodal levels are generally small (see ), probably explaining in part the relatively low DSC in nodal CTVs compared to breast tissue. For the IMN particularly, in a prominent fraction of the cases the segmented volume extended too distantly in the caudal direction, characterized by relatively high HD95 value. Substantial inter patient variations in the length of the IMN pose a challenge in realizing a robust and reliable IMN segmentation model, as was also observed in other studies [Citation14,Citation19]. It is worth noticing that the DSC and HD95 values overall were similar between right and left side organs, with the exception of the HD95 values for the IMN where the left side was significantly lower than the right side (p = 0.009).
The observed deviations appeared in many cases to be systematic with failures to adhere to the guidelines either in the cranial or caudal part of the segmented organ, resulting in large HD95 values cranially or caudally. This may indicate a need to retrain the models to correct this particular artifact. Alternatively, a dedicated post processing step that corrects segmented organs according to predefined anatomical instructions, can be an acceptable solution that also may allow for an adoption of the models to variations in institutional organ delineation specifications. This could increase the number of auto-segmented volumes that are acceptable without correction and improve DLS model accuracy and efficiency.
The observed inaccuracy in the DLS generated CTVs was shown to result in an underdosage of especially the PTVs of the manually delineated axillary lymph nodes. In the study by Almberg et al. underdosage of lymph node CTVs occurred in 11% of the treatment plans [Citation14], compared to 17% of the treatment plans in this study. Institutional differences in plan optimization settings (e.g., margins) may explain the deviation. Care was taken to minimize potential bias, as the treatment plans in this study were generated manually, by using highly standardized templates for the whole planning process.
Using an interactive DL model has been proposed as a means to minimize time to correct the model generated structures. For instance, the physician provides user input by delineating in a few image slices. This has been shown to improve DCS and HD95 substantially [Citation20–23], however further model development is needed before clinical implementation.
Some Atlas-based methods have reported relatively good results with DCS for breast tissue ranging from of 0.78 to 0.89 [Citation24,Citation25]. However, recent studies using DLS based methods have shown promising results, surpassing atlas-based methods [Citation26–28]. Our results are in line with other published studies: DSC for breast tissue was reported in several studies to be between 0.9−0.95, with corresponding HD95 values of 4.3−9.8 mm [Citation14,Citation19,Citation29–32]. The similarity indices DCS and HD95 for lymph node structures were in the range 0.62–0.79 and 3.5–20.1 mm [Citation19], 0.64–0.8 and 5.8−10.9 mm [Citation30] and 0.70–0.81 and 3.3−12.2 mm [Citation14]. HD95 and DSC are common metrics for evaluating geometric similarities. These are good measures of the geometric quantification of structure similarities [Citation17,Citation33], but have not been shown to correlate significantly to important clinical factors like time saved, clinical acceptability or dosimetric consistency in other studies [Citation16,Citation33]. Therefore, a combination of quantitative and qualitative tests are recommended, together with evaluation of time gain and dosimetric impact [Citation34,Citation35]. It was outside the scope of this article to analyse the correlation between the different evaluation metrices, however this would be highly interesting to do in follow up studies.
In this study, one oncologists contoured the CTVs and this task was shared between the two oncologists in the study group. Thus, we did not compare the results of the DLS model to IOV in our department, since each contour was delineated by one expert oncologist. However, as previously stated, prior to the manual contouring a guideline review session was arranged to establish a common understanding of the ESTRO consensus guidelines among the two oncologists. This is likely to reduce the effect of IOV. Still, even in the presence of common guidelines, conciderable contour variations between physicians have been documented. In BC patients, the axillar nodal levels in particular show significant variations [Citation36,Citation37]. In another study, the accuracy of DLS structures generated by models trained using manual delineations derived from either a single radiation oncologist or a few, was found to be comparable to expert IOV [Citation14,Citation38]. This supports that model testing using contours delineated by one expert oncologist as a reference is still valuable, even though using multiple expert physicians contours as “ground truth” for DLS model testing is preferential.
The quality of auto-segmentation depends on the model and the data sets used as inputs, and a risk associated with using DLS models arise when the data used to train the model does not reflect the ground truth [Citation39]. Typically, the data sets used for training the model are closely related to the validation data sets, since they usually stem from the same institution with similar protocols, guidelines and patient groups. This could affect the applicability of the model in other institutions and emphasizes the importance of external testing of DLS models. Here, we validated a commercially available DLS model on data independent from the training data set, and found comparable results to that of the original validation and testing of the model [Citation14], however with somewhat lower qualitative scoring of breast tissue.
From a physician’s perspective, the clinical implementation of automatic contouring presents itself as a somewhat of a double-edged sword. The technology appears to be right at the cusp of delivering contouring of a quality sufficient to provide major time gain, representing a benefit in a clinical setting where time is a scarce resource. In addition, it is important to improve the IOV in BC radiotherapy treatment to improve outcome, both to prevent BC locoregional relapse and to lower the risk of treatment related morbidities. However, the ability to evaluate and correct delineations, requires regular delineation practice. An over-reliance on automation runs the risk of diminishing that skill set, and potentially losing the underlying knowledge on an institutional level [Citation40,Citation41]. The DLS model, although quite good in most cases, can fail completely when confronted with sufficient anatomical variation and there will likely always be cases where manual contouring is needed, either because of the aforementioned or because there is a clinical need to deviate from the guidelines. In this study this was observed for one patient with non standard arm position, one patient with an enlarged thyroid and one patient with breast implants, and in all cases the DLS generated contours failed to correctly represent the target volumes and/or OARs. In summary, the introduction of automatic organ segmentation in clinical practice shows promise, but should be accompanied by a protocol concerning when and how it is implemented.
Supplemental Material
Download MS Word (82.1 KB)Acknowledgements
We would like to thank Fredrik Lövman, Jonas Söderberg, and Elin Samuelsson at RaySearch Laboratories AB for helpful discussions and guidance to the use and understanding of the DLS models. Jonas Söderberg and Elin Samuelsson also contributed with calculating the Dice and Hausdorff metrics.
Disclosure statement
The study was performed as part of a collaboration and data transfer agreement with RaySearch Laboratories AB.
Data availability statement
The participants of this study did not give written consent for their data to be shared publicly, so due to the sensitive nature of the research supporting data is not available.
References
- Cardenas CE, Blinde SE, Mohamed ASR, et al. Comprehensive quantitative evaluation of variability in magnetic resonance-guided delineation of oropharyngeal gross tumor volumes and high-risk clinical target volumes: an R-IDEAL stage 0 prospective study. Int J Radiat Oncol Biol Phys. 2022;113(2):426–436. doi:10.1016/j.ijrobp.2022.01.050.
- Das IJ, Compton JJ, Bajaj A, et al. Intra- and inter-physician variability in target volume delineation in radiation therapy. J Radiat Res. 2021;62(6):1083–1089. doi:10.1093/jrr/rrab080.
- Njeh CF. Tumor delineation: the weakest link in the search for accuracy in radiotherapy. J Med Phys. 2008;33(4):136–140. doi:10.4103/0971-6203.44472.
- Offersen BV, Boersma LJ, Kirkove C, et al. ESTRO consensus guideline on target volume delineation for elective radiation therapy of early stage breast cancer, version 1.1. Radiother Oncol. 2016;118(1):205–208. doi:10.1016/j.radonc.2015.12.027.
- Offersen BV, Boersma LJ, Kirkove C, et al. ESTRO consensus guideline on target volume delineation for elective radiation therapy of early stage breast cancer. Radiother Oncol. 2015;114(1):3–10. doi:10.1016/j.radonc.2014.11.030.
- [Internet]. Nasjonalt handlingsprogram med retningslinjer for diagnostikk, behandling og oppfølging av pasienter med brystkreft. [Norwegian guidelines for diagnostics, treatment and follow-up of patients with breast cancer]. [cited 2023 Apr 28]. Available from: https://nbcg.no/retningslinjer/
- Kerr AJ, Dodwell D, McGale P, et al. Adjuvant and neoadjuvant breast cancer treatments: a systematic review of their effects on mortality. Cancer Treat Rev. 2022;105:102375. doi:10.1016/j.ctrv.2022.102375.
- Falstie-Jensen AM, Kjaersgaard A, Lorenzen EL, et al. Hypothyroidism and the risk of breast cancer recurrence and all-cause mortality - a Danish population-based study. Breast Cancer Res. 2019;21(1):44. doi:10.1186/s13058-019-1122-3.
- Taylor C, Correa C, Duane FK, et al. Estimating the risks of breast cancer radiotherapy: evidence from modern radiation doses to the lungs and heart and From previous randomized trials. J Clin Oncol. 2017;35(15):1641–1649. doi:10.1200/JCO.2016.72.0722.
- Li XA, Tai A, Arthur DW, et al. Variability of target and normal structure delineation for breast cancer radiotherapy: an RTOG Multi-Institutional and Multiobserver Study. Int J Radiat Oncol Biol Phys. 2009;73(3):944–951. doi:10.1016/j.ijrobp.2008.10.034.
- Samarasinghe G, Jameson M, Vinod S, et al. Deep learning for segmentation in radiation therapy planning: a review. J Med Imaging Radiat Oncol. 2021;65(5):578–595. doi:10.1111/1754-9485.13286.
- Radici L, Ferrario S, Borca VC, et al. Implementation of a commercial deep learning-based auto segmentation software in radiotherapy: evaluation of effectiveness and impact on workflow. Life (Basel). 2022;12(12):2088. doi:10.3390/life12122088.
- Pera O, Martinez A, Mohler C, et al. Clinical validation of Siemens’ Syngo via automatic contouring system. Adv Radiat Oncol. 2023;8(3):101177. doi:10.1016/j.adro.2023.101177.
- Almberg SS, Lervag C, Frengen J, et al. Training, validation, and clinical implementation of a deep-learning segmentation model for radiotherapy of loco-regional breast cancer. Radiother Oncol. 2022;173:62–68. doi:10.1016/j.radonc.2022.05.018.
- Feng M, Moran JM, Koelling T, et al. Development and validation of a heart atlas to study cardiac exposure to radiation following treatment for breast cancer. Int J Radiat Oncol Biol Phys. 2011;79(1):10–18. doi:10.1016/j.ijrobp.2009.10.058.
- Sherer MV, Lin D, Elguindi S, et al. Metrics to evaluate the performance of auto-segmentation for radiation treatment planning: a critical review. Radiother Oncol. 2021;160:185–191. doi:10.1016/j.radonc.2021.05.003.
- Taha AA, Hanbury A. Metrics for evaluating 3D medical image segmentation: analysis, selection, and tool. BMC Med Imaging. 2015;15(1):29. doi:10.1186/s12880-015-0068-x.
- Christiaens M, Collette S, Overgaard J, et al. Quality assurance of radiotherapy in the ongoing EORTC 1219-DAHANCA-29 trial for HPV/p16 negative squamous cell carcinoma of the head and neck: results of the benchmark case procedure. Radiother Oncol. 2017;123(3):424–430. doi:10.1016/j.radonc.2017.04.019.
- Buelens P, Willems S, Vandewinckele L, et al. Clinical evaluation of a deep learning model for segmentation of target volumes in breast cancer radiotherapy. Radiother Oncol. 2022;171:84–90. doi:10.1016/j.radonc.2022.04.015.
- Wei Z, Ren J, Korreman SS, et al. Towards interactive deep-learning for tumour segmentation in head and neck cancer radiotherapy. Phys Imaging Radiat Oncol. 2023;25:100408. doi:10.1016/j.phro.2022.12.005.
- Rodriguez Outeiral R, Bos P, Al-Mamgani A, et al. Oropharyngeal primary tumor segmentation for radiotherapy planning on magnetic resonance imaging using deep learning. Phys Imaging Radiat Oncol. 2021;19:39–44. doi:10.1016/j.phro.2021.06.005.
- Boers TGW, Hu Y, Gibson E, et al. Interactive 3D U-net for the segmentation of the pancreas in computed tomography scans. Phys Med Biol. 2020;65(6):065002. doi:10.1088/1361-6560/ab6f99.
- Rasmussen ME, Nijkamp JA, Eriksen JG, et al. A simple single-cycle interactive strategy to improve deep learning-based segmentation of organs-at-risk in head-and-neck cancer. Phys Imaging Radiat Oncol. 2023;26:100426. doi:10.1016/j.phro.2023.100426.
- Ciardo D, Gerardi MA, Vigorito S, et al. Atlas-based segmentation in breast cancer radiotherapy: evaluation of specific and generic-purpose atlases. Breast. 2017;32:44–52. doi:10.1016/j.breast.2016.12.010.
- Velker VM, Rodrigues GB, Dinniwell R, et al. Creation of RTOG compliant patient CT-atlases for automated atlas based contouring of local regional breast and high-risk prostate cancers. Radiat Oncol. 2013;8(1):188. doi:10.1186/1748-717X-8-188.
- Ibragimov B, Xing L. Segmentation of organs-at-risks in head and neck CT images using convolutional neural networks. Med Phys. 2017;44(2):547–557. doi:10.1002/mp.12045.
- Men K, Dai J, Li Y. Automatic segmentation of the clinical target volume and organs at risk in the planning CT for rectal cancer using deep dilated convolutional neural networks. Med Phys. 2017;44(12):6377–6389. doi:10.1002/mp.12602.
- Choi MS, Choi BS, Chung SY, et al. Clinical evaluation of atlas- and deep learning-based automatic segmentation of multiple organs and clinical target volumes for breast cancer. Radiother Oncol. 2020;153:139–145. doi:10.1016/j.radonc.2020.09.045.
- Men K, Zhang T, Chen X, et al. Fully automatic and robust segmentation of the clinical target volume for radiotherapy of breast cancer using big data and deep learning. Phys Med. 2018;50:13–19. doi:10.1016/j.ejmp.2018.05.006.
- Chung SY, Chang JS, Choi MS, et al. Clinical feasibility of deep learning-based auto-segmentation of target volumes and organs-at-risk in breast cancer patients after breast-conserving surgery. Radiat Oncol. 2021;16(1):44. doi:10.1186/s13014-021-01771-z.
- Byun HK, Chang JS, Choi MS, et al. Evaluation of deep learning-based autosegmentation in breast cancer radiotherapy. Radiat Oncol. 2021;16(1):203. doi:10.1186/s13014-021-01923-1.
- Liu Z, Liu F, Chen W, et al. Automatic segmentation of clinical target volume and organs-at-risk for breast conservative radiotherapy using a convolutional neural network. Cancer Manag Res. 2021;13:8209–8217. doi:10.2147/CMAR.S330249.
- Vaassen F, Hazelaar C, Vaniqui A, et al. Evaluation of measures for assessing time-saving of automatic organ-at-risk segmentation in radiotherapy. Phys Imaging Radiat Oncol. 2020;13:1–6. doi:10.1016/j.phro.2019.12.001.
- Vandewinckele L, Claessens M, Dinkla A, et al. Overview of artificial intelligence-based applications in radiotherapy: recommendations for implementation and quality assurance. Radiother Oncol. 2020;153:55–66. doi:10.1016/j.radonc.2020.09.008.
- van der Veen J, Willems S, Deschuymer S, et al. Benefits of deep learning for delineation of organs at risk in head and neck cancer. Radiother Oncol. 2019;138:68–74. doi:10.1016/j.radonc.2019.05.010.
- Ciardo D, Argenone A, Boboc GI, et al. Variability in axillary lymph node delineation for breast cancer radiotherapy in presence of guidelines on a multi-institutional platform. Acta Oncol. 2017;56(8):1081–1088. doi:10.1080/0284186X.2017.1325004.
- Ling DC, Moppins BL, Champ CE, et al. Quality of regional nodal irradiation plans in breast cancer patients across a large network-can we translate results from randomized trials Into the clinic? Pract Radiat Oncol. 2021;11(1):e30–e35. doi:10.1016/j.prro.2020.06.007.
- Wong J, Fong A, McVicar N, et al. Comparing deep learning-based auto-segmentation of organs at risk and clinical target volumes to expert inter-observer variability in radiotherapy planning. Radiother Oncol. 2020;144:152–158. doi:10.1016/j.radonc.2019.10.019.
- Barragan-Montero A, Bibal A, Dastarac MH, et al. Towards a safe and efficient clinical implementation of machine learning in radiation oncology by exploring model interpretability, explainability and data-model dependency. Phys Med Biol. 2022;67(11):11TR01. doi:10.1088/1361-6560/ac678a.
- Batumalai V, Jameson MG, King O, et al. Cautiously optimistic: a survey of radiation oncology professionals’ perceptions of automation in radiotherapy planning. Tech Innov Patient Support Radiat Oncol. 2020;16:58–64. doi:10.1016/j.tipsro.2020.10.003.
- Korreman S, Eriksen JG, Grau C. The changing role of radiation oncology professionals in a world of AI - just jobs lost - or a solution to the under-provision of radiotherapy? Clin Transl Radiat Oncol. 2021;26:104–107. doi:10.1016/j.ctro.2020.04.012.