
ABSTRACT
In the Netherlands, electronic service delivery has become an important issue in many municipalities. Using the Internet for service delivery is seen as an important element of e-government. Based on 2014–2016 panel data for all Dutch municipalities, we show that there is a large variety among the municipalities in the extent to which they offer their service delivery digitally. By exploring the factors that may explain the differences among the municipalities, some trends can be discerned. Most notably is the strong relationship of e-government adoption with demographic characteristics, such as population, population density and both older age and younger age groups. Remarkably, we did not find an influence of education and income. Finally, we did not observe a relation between municipal allocated costs and level of e-maturity, hereby leaving the question open if and how e-government can lead to cost reductions.
Introduction
E-government has been heralded as one of the reforms to promote efficiency and responsiveness in government service delivery (Dunleavy et al. Citation2005). The development of e-government, which initially arose in the 1990s and is manifestoing in the course of the 2000s, is primarily driven by the rationale of new public management (Cordella and Bonina Citation2005).
Two important implications can be discerned in the general discussion of e-government:
it has an impact on the efficiency of internal processes and
it transforms the relationship between government and society.
The definitions and usage of the term ‘e-government’ are not clear-cut (Yildiz Citation2007): it is a concept that is defined by its implications, rather than by technologies or activities deployed to reach them. As such, e-government is widely researched, for all sorts of different contexts. However, it should be noticed that descriptive and qualitative studies are over-represented (Rodriguez Bolivar, Alcaide Muñoz, and López Citation2016). Next to this, up to date only a few articles were found that address the issue of e-government adoption: the degree to which a government is inclined to adapt ICT infrastructure. The scarce writing on e-government adoption is especially surprising when looking at the Dutch context, as this provides a more or less ideal setting for quantitative research on this topic. Three major arguments can be given for researching e-government adoption in Dutch local government: (1) the central government to a large extent determines what tasks are to be executed by municipalities, but the latter are free to decide how they are organised; (2) Internet access in almost all municipalities is fast and reliable; and (3) not only are e-government adoption data made available periodically, but detailed municipal budgets are also well-documented online. For this article, we are interested in the factors that could explain the impact of e-government on municipal service delivery. As mentioned before, up to date hardly any research of e-government adoption has been undertaken by means of quantitative analysis of empirical data, and the relation of e-government adoption with other variables. This article tries to fill this gap, exploring the links between e-government adoption, demographic and socio-economic characteristics, and municipal costs.
The structure of this article is as follows. After a review of relevant literature, we start out with an assessment of the relationship between the adoption of e-government and a selection of demographic and socio-economic variables. Consequently, we will look if there is a relationship between the degree of e-government adoption and specific cost items: Does a thorough adoption of e-government lead to lower or higher costs?
Literature review
Ever since the early 2000s, the importance of Internet took a rapid growth and evolved into the centrepiece of governmental service delivery. There is a substantial body of literature addressing e-government and its emergence in public administration. Rodriguez Bolivar, Alcaide Muñoz, and López (Citation2016) discern features and functionalities of articles published in this field. In their meta-analysis, they show a continuous growth in the output of papers concerned with e-government development and adoption in the period between 2000 and 2012. Following Carter and Belanger (Citation2005), they discern three significant e-government approaches: (1) studies mainly considered with questions of accountability due to ICT developments; (2) studies that investigate increased (or decreased) transparency for citizens; and (3) studies that evaluate questions of efficiency gains (or losses) through government usage of ICT.
A guiding principle in the context of service delivery is that of dividing and modelling e-government evolution into sequential steps or ‘stages of growth’ models (Valdés et al. Citation2011). These stages are often defined in terms of ‘maturity’, as habitual in various other disciplines such as business economics. Layne and Lee (Citation2001) were the first to formulate four stages of ICT growth within government, primarily concerned with functionality and capability, gradually moving from absence of ICT towards ‘horizontal integration’, the idea that systems would be fully integrated across different functions, leading up to the public body as a ‘real one stop shop for citizens’ – related to the notion of a ‘joined-up government’ (Pollitt Citation2003; for an application to the Dutch setting, see Rooks, Matzat, and Sadowski Citation2017). The stages concept of governmental ICT usage has been adapted frequently, sometimes shifting the focus towards other aspects such as customer-centricity (Andersen and Henriksen Citation2006) and interoperability (Gottschalk Citation2009).
There is some literature that addresses the factors exerting influence on e-government. Manoharan (Citation2013), in his analysis of the progress of e-government adoption in counties in the United States, formulated that a constellation of factors (socio-economic, institutional and contextual) were determinants of a greater extent of e-government adoption for local government. Nasi, Frosini, and Cristofoli (Citation2011) moreover found that especially organisational factors and not so much environmental factors play a role in the adoption of e-government.
However, there is a discrepancy between the amount of qualitative and quantitative analysis that has been done on the subject of e-government adoption factors. In their meta-analysis, Rodriguez Bolivar, Alcaide Muñoz, and López (Citation2016) observed that a majority of the papers written on e-government were qualitative studies; especially case studies appear to be voluminous. They also found that many papers were descriptive and did not build on earlier theories. For that reason, they call for a more intensive deployment of quantitative research in the field.
Assessing e-government in the context of Dutch local government
After this overview of research on e-government, we take a closer look at the Dutch local context. The Netherlands has three layers of government (central, province and municipalities). Municipalities in the Netherlands form the most visible layer of government. They perform tasks such as social assistance, physical planning, garbage and recyclables collection, and the issuance of passports and driver licences. For this reason, it is evident that public service delivery towards citizens and businesses is largely concentrated around the municipalities. The Dutch central government has prescribed a large number of tasks that have to be performed by the local layer of government, but it is to a large extent at the municipalities’ discretion how they wish to perform these tasks. This allows for a great variety of public policy, which is adapted and tailored to the local context.
According to a survey, 95% of Dutch inhabitants have access to (high-speed) Internet (Statistics Netherlands, Citation2012). This puts the Netherlands among the countries with the highest Internet penetration in Europe. Additionally, the Netherlands recently has been ranked fourth in an EU assessment of e-government adoption by member states (European Commission Citation2017).
In the 2013–2017 coalition agreement of the Dutch central government, e-government is spearheaded as an important theme. In 2013, the responsible minister declared that citizens and business should be offered the opportunity to consume government services via Internet in 2017 at the latest (Ministry of Internal Affairs and Kingdom Relations Citation2013).Footnote1 As local governments are charged with the majority of direct service delivery, a large share of responsibility for the achievement of this objective lies with municipalities. The Ministry of Internal Affairs and Kingdom Relations commissioned a periodical assessment, executed by Deloitte, of the ‘e-maturity’ (digitale volwassenheid) of every Dutch municipality. For our analysis, we explored the data used for these reports (Deloitte Citation2015; Deloitte Citation2016; Deloitte Citation2017).
For the present article, we are interested in looking at the factors determining the extent of e-government adoption in the Dutch context. On the basis of this question, we formulate our hypotheses. In the reports used, the measure of e-government adoption is called ‘e-maturity’ and is specifically related to the extent to which a municipality offers a range of services through the Internet. In the report, e-maturity is measured for each separate municipality as the weighted average of the total products it offers online. Examples of products include the issuing of passports and applications for a parking licence. Each separate product is given a score for its degree of e-maturity. Four percentage-termed stages are formulated, determining the extent to which a municipal product is offered along a digital route (see ). In this article, we follow Deloitte’s definition.
Table 1. Stages of e-maturity of municipal products.
The study looks at 43 unique products. Nineteen products are specifically intended for citizens, 12 specifically for businesses; another 12 products overlap and concern both citizens and businesses. Finally, the municipalities receive an overall e-maturity rating and a separate rating for citizens and businesses. These aggregate ratings are an averaging of all products assessed.
Analysing the current state of e-maturity
We assessed the e-maturity levels for a period covering three successive years, covering the period from 2014 to 2016.Footnote2 The data set which includes e-maturity data for the municipal products covers all Dutch municipalities, of which there were approximately 400. Over time, the researchers made some small measurement adjustments to their assessment.Footnote3 As we are primarily interested in service delivery towards citizens, we restrict our use to the data about citizen-oriented products of municipalities. A total of 31 products were used for our analysis.
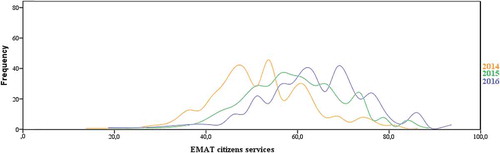
Plotted for the three separate years, we see an upward movement towards a greater average e-maturity of municipalities (see and ): with a mean of 51.5% in 2014 and 59.3% in 2015, moving further to a mean of 64.6% in 2016. The leap from 2015 to 2016 is in accordance with the initial ICT goals set by the minister for the municipal services. However, the variance between municipalities remains considerable, with municipalities scoring as high as 94.0% and as low as 19.6% in the same year, and the absence of significant differences in standard deviation per year suggests that this variance is of a lasting nature. In the next part, we will assess possible explanations and determinants for this large degree of variance.
Table 2. Descriptive statistics e-maturity services for citizens.
Figure 1. Density curves of e-maturity services for citizens in 2014, 2015 and 2016.
Determinants and hypotheses
We used the data sets on e-maturity as a basis for our analysis of the relationship between e-maturity and a selection of demographic and socio-economic factors. In the literature, the importance of the effects of exogenous variables on local governments is often underlined (see, e.g., Ferreira da Cruz and Cunha Marques, Citation2014). For our analysis, we mainly build on Manoharan’s (Citation2013) assessment of determinants for e-government adoption, in the context of American counties. We reviewed a selection of factors that are most interesting for e-maturity in the Dutch context. For every variable, an applicable hypothesis is constructed.
The first variable we assess is population. One is inclined to expect that the larger the municipality is, the more opportunities to invest and expertise there would be available. There is a long-standing tradition that assumes the existence of a connection between organisation size and its capacity to innovate (see, e.g., Rogers Citation1983): it forms an indicator of an array of underlying assumptions that stimulate innovation, such as total resources, technical expertise, information disclosure and organisational structure. Prior research points in the same direction (Ho Citation2002; Andrews and Boyne Citation2009; Ruano De La Fuente Citation2014; Guillamón et al. Citation2016): the larger the municipality, the greater the odds that it had more advanced forms of e-government.
Hypothesis 1:
A municipality with a larger population will have a higher e-maturity level than a municipality with a smaller population.
Prior research also suggested that land area and population density have links with e-maturity (Ruano De La Fuente Citation2014), both variables form an indicator for organisational size. Manoharan (Citation2013) writes that local governments that cover a large land area and are densely populated would be involved in such complex nature that they ‘would be already accounted for in the initial stages of e-government implementation’ (163). As most municipalities in the Netherlands are relatively small in area in comparison with Manoharan’s (Citation2013) context of counties in the United States, and because of possible multicollinearity issues,Footnote4 we only include population density in our study.
Hypothesis 2:
A municipality with a larger population density will have a higher e-maturity level than a municipality with a smaller population density.
In the literature, the demographic variable in relation to e-government adoption has been discussed frequently. Manoharan (Citation2013) employs the age variable in a limited fashion, only reflecting on the mean age of counties; therefore, we consulted other literature. The widely shared consensus here is that people with a more advanced age are less involved digitally, and thus lower the need for local e-government adoption (Ruano De La Fuente Citation2014; Colesca Citation2009; Gil-Garcia, Helbig, and Ferro Citation2006). Van Deursen and Van Dijk (Citation2009) also observed that age was a significant predictor for the level of operational ICT skills: a person of a more advanced age (specified as aged 55–80 years) would score significantly less on a test of operational ICT skills than a peer of a younger age (aged 18–29 years). For the latter, it should be noticed that the presence of ICT skills does not form an indicator in itself for more developed e-government, but it could nonetheless form an important precursor and incentive for a municipality to offer as much of its services digitally. In addition, we argue that it is primarily the working people that would potentially benefit from e-government adoption, as they might have less time to visit the municipal hall during office hours. Finally, the youngest age group – aged 20 years and younger – would be less inclined to make use of the products municipalities have on offer, e.g., because they are too young to consume their services.
Hypothesis 3a:
A more extensive presence of people from the youngest age group forms a negative stimulus for e-maturity.
Hypothesis 3b:
A more extensive presence of people from an older age group forms a negative stimulus for e-maturity.
Income per capita is another factor that is sometimes identified with innovative e-government on a national level (Siau and Long Citation2006). Manoharan (Citation2013) also remarks that income level sets a level of expectation for local government in developing their ICT facilities. He furthermore notes that the same can be discerned for education: in the time period of his analysis, counties with websites have a slightly higher percentage of high school graduates than counties without websites. Guillamón et al. (Citation2016) do not observe significance for education, but they do find income to be a significant factor in local government use of social media. For Van Deursen and Van Dijk (Citation2009), who make four different classifications for their measurement of digital skills – operational, formal, information and strategic skills – education level appears to be the only constant determining factor. Again, it should be remarked that there is no self-evident causality between the presence of digital skills and the actual usage of e-government services.
Hypothesis 4:
A municipality whose residents have a higher level of education will have more advanced e-maturity than a municipality whose residents have lower levels of education.
Hypothesis 5:
A municipality whose residents have a higher income level will have more advanced e-maturity than a municipality whose residents have lower levels of income.
Finally, we looked at the effect of municipal mergers on e-government adoption. In the Netherlands, mergers take place every year, which makes it possible to retrace its eventual influences on other factors.Footnote5 This provides an outlook for a closer view into the relation between e-government adoption and municipal mergers. In the literature on local government mergers, the act of municipal amalgamation is most often aimed at exploiting economies of scale (Blom-Hansen, Houlberg, and Serritzlew Citation2014; Allers and Geertsema Citation2016). Additionally, it could be argued that a merger enables the newly formed municipality to restructure its operations, offering a chance to revise business processes and providing a quality impulse for public service delivery (Homburg, Dijkshoorn, and Thaens Citation2014; Steiner and Kaiser Citation2017). E-government adoption and implementation could be a part of such a revision, in order to stimulate efficiency.
Hypothesis 6:
A municipality that has been subject to a merger in the foregoing 5 years will have more advanced e-maturity than a municipality not subject to a recent merger.
Up to date, the relation between e-maturity and service delivery costs in local government has not been researched before to the best of our knowledge. In our setting, we think that there are both arguments for and against cost reductions because of the implementation of e-government. On the one hand, the adoption of e-government can be presented under the denominator of cost reduction (see, e.g., Moon Citation2002): for example, when products are directly accessible through a portal, the municipality is not inclined to appeal to its human resources to arrange a physical appointment. On the other hand, we expect that the implementation of e-government requires a certain amount of cost investments. These elements could work in opposite directions, leading to the absence of an aggregate effect. Therefore, we formulate our last hypothesis as follows:
Hypothesis 7:
There is no relation between e-maturity and the costs of services.
Data collection and operationalisation
For our assessment of the relation between our socio-economic variables with e-maturity, we looked at the following variables (see ):
Population,
Population density,
Several age groups,
Percentage of working people with at least bachelor education,
Income per capita,
Subject to a recent merger.
Table 3. Descriptive statistics for e-maturity, demographic and socio-economic factors in the period 2014–2016.
As mentioned, we retrieved the e-maturity data from the Deloitte reports. E-maturity functions as our dependent variable. All demographic and socio-economic variables (variables 1–5) are accessible as open data through the portal of Statistics Netherlands. Population, age groups, education and income were included as continuous variables. Statistics Netherlands developed a measure to determine the urbanisation degree of a municipality. This measure is divided into five categories that make a division in address density per km2. We included the categories 1 ‘Very urban area’, 2 ‘Strongly urban area’ and 3 ‘Moderately urban area’ as dummy variables in our model as a means for population density, hereby taking the other two categories as the reference group.Footnote6 For the final part of our article, we analyse if there is a relation between e-maturity and three specific municipal cost items, or cost functions as they are called in the Netherlands, and the accompanying e-maturity for products assigned to that function. Data for these cost functions are publicly accessible for each municipality via the data portal of Statistics Netherlands (see Appendix B). For 2014 and 2015, we made use of the municipal financial reports. As these were not yet available for 2016, we used the budget figures for that year instead.
Finally, we also included a dummy variable for mergers. Data for this variable were retrieved from Metatopos (Klein Citation2017), a website that documents Dutch municipal and provincial amalgamations, mergers, name changes and border corrections since 1988. This variable assesses whether a municipality has been subject to a municipal merger in the previous 5 years (counted from the year of observation). With respect to municipal mergers, also referred to as municipal amalgamations, time delay should be accounted for before its possible effects can be retraced. ‘Income per capita’ is the only variable for which data were available for just 1 year (2014). The differences in amount of observations per variable are due to missing or obviously erroneous values. displays the descriptive statistics for all variables.
Dutch municipalities are considerably variable in size: their population numbers range from less than 1000 to more than 800,000 inhabitants. The effects of this substantial variation in size are also reflected in some variables (population, land area and income per capita). In line with Manoharan (Citation2013), these variables were converted to their natural log form in order to reduce their skewness level.
As a next step, we ran Spearman correlations of e-maturity with the natural logs of the demographic and socio-economic factors, to get a rough indication of the centres of gravity of our model, and forestall possible issues and conflicts.Footnote7 gives an overview of the variables. As data for the income variable were only available for 2014, correlations for this variable were ran only with the 2014 data for all other variables (N = 388).
Table 4. Correlations (Spearman) of e-maturity and socio-economic factors.
The correlations already provide some starting points for interpretation. Apart from income, all demographic and socio-economic variables have a relationship with e-maturity at the 0.01 level. Furthermore, apart from the fourth density category and the two age categories, all variables have a positive relationship. This significance already foreshadows a relationship between e-maturity and demographic variables that were developed in our hypotheses and confirmed by earlier literature. Finally, there were no indications for multicollinearity in case we move on to regression analysis.
In order to further evaluate the relationship between municipal e-maturity and the demographic as well as socio-economic factors, ordinary least squares regressions were used. represents the results of four different models, broken down for 2014, 2015, 2016 and the pooled data set of the 3 years combined. For the pooled regression, 2015 and 2016 dummies were added in order to enhance reliability of the outcomes.
shows that all models are statistically significant and that the models for the 3 years investigated reveal rather similar results. Furthermore, the 2015 and 2016 dummies in the pooled regression confirm the aforementioned upward trend in the mean of e-maturity. In line with earlier literature, population shows the highest and most consistent significance in 3 years and in the pooled estimation, and therefore supports Hypothesis 1 indicating that larger municipalities have a higher degree of e-maturity. Secondly, the results for the density variables show that municipalities with a larger population density on average have a higher e-maturity level, hereby supporting Hypothesis 2. Note, however, that there are some differences between the categories we distinguished. Interestingly, the third density category (1000–1500 addresses per km2) is also significant for all years and also for the pooled model, whereas the second category (1500–2500 addresses per km2) is only significant for the pooled model. Thus, medium-sized cities seem to perform better in their e-government adoption than cities in the slightly larger density category (1500–2500 addresses per km2). An explanation for this is difficult to find and not supported by earlier literature.
Table 5. Ordinary least squares regression analysis of demographic and socio-economic determinants of e-maturity.
The effect of age for both the younger and the older age groups is negatively significant for almost all years. These findings support Hypotheses 3b and – to a weaker extent – 3a. Education and income level show no significance and exert no or negligible influence on municipal e-maturity levels. Hypotheses 4 and 5 are therefore rejected. Finally, the effect of a municipal merger is significant for the 2015 and pooled models, but not for 2014 and 2016, so there are some but no strong indications for Hypothesis 6.
The relation between ICT and service delivery costs
In this paragraph, we analyse the relation between e-maturity and the costs of service delivery. We compiled three additional e-maturity scores by using the separate scores for products with a direct relation with specific municipal cost functions (see Appendix B). The three cost functions we assessed are the costs of general civil services (GCS), the costs for the collection of housing taxes (HT) and the costs for the collection of other municipal taxes (OMT). The choice for these three functions was made to explore the diversity of factors that might exert influence on the corresponding e-maturity levels. Finally, for every municipality, the cost items were converted to reflect the costs per inhabitant.
The costs of ‘housing taxes’ and ‘other municipal taxes’ variables had to be trimmed, in order to reduce outliers, thereby reducing the number of observations. shows the descriptive statistics of the resulting variables.
Table 6. Descriptive statistics (costs (€) per inhabitant) for 2014–16.
For all years, we ran correlations with the cost functions (per inhabitant) and e-maturity for the accompanying product, in order to look if e-maturity would be indicative for the costs.Footnote8 The initial report uses a non-continuous scale for every separate product; therefore, we had to create dummies for the separate scores.
Our analyses revealed that none of the correlations turned out to be significant. This finding is in full support of Hypothesis 7. Again, it should be mentioned that this does not mean that an effect is absent, but that for both directions an argument can be made for the relation between e-maturity and the municipal cost functions.
Conclusion and discussion
In this article, we sought different explanations for the variance in e-government adoption in Dutch municipalities. Population, population density, people of older age (65 years and older) and to a lesser extent, a greater presence of both merger and younger age (younger than 20 years) proved to be key predictors, confirming the findings in earlier literature on this subject. The significance of the variable is in support of the argument made more often that a merger enables the newly formed municipality to restructure its operations, offering a chance to revise business processes and providing a quality impulse for public service delivery. The youngest age group – aged 20 years and younger – would be less inclined to make use of the products municipalities offer, because they are too young to consume their services.
In contrast to findings from previous studies, income level and level of education did not significantly influence the level of e-maturity. This nuances the effect of these variables, as observed in earlier research on e-government adoption. This suggests that the level of e-government in the Dutch context is primarily driven by demographic and not so much by socio-economic characteristics.
Secondly, we looked if e-maturity was, to some extent, related to cost items. Our analyses do not give indications that such a relationship exists. This was in accordance to our prior expectation as opposing factors are at play. Nevertheless, more research is needed to confirm our findings regarding the relation between e-maturity and cost items. This would be possible by adapting a more longitudinal design.
A limitation of the present study is that we did not ask if the costs for the municipality would either rise or drop, as well as the costs for the end user: the citizen. This different approach to municipal costs could be quantified by looking at the price of municipal products, such as passports and municipal permits. It must be noted, however, that such an approach has three limitations. First, some tariffs (e.g., for driver licences and passports) are maximised by central government. Second, municipalities can only charge citizens and businesses tariffs up to full costs of specific services, and are not allowed to make a profit. However, they are not obliged to cover the full costs, so they may underprice their services (Groot and Budding Citation2004). Third, in daily practice, municipalities use information on tariffs from neighbouring and other peer municipalities to a large extent to determine their tariffs, hereby releasing the link between allocated costs and tariffs (Groot and Budding Citation2004).
Another limitation is our definition of e-government adoption as ‘e-maturity’. This is just one of few options of how the degree to which ICT is being used by municipalities could be operationalised. The literature gives clues for other indicators that measure e-government adoption or, less narrow, attention for ICT developments. In Spain, the Dossier of E-government Indicators (IRIA) gets published every 2 years by the High Council of Electronic Administration. According to the Dossier, a steady and positive trend can be discerned towards greater investment in material and human resources related to ICT (Ruano De La Fuente Citation2014). Statistics Netherlands does not quantify ICT costs separately, which also leads to more difficulties to isolate the possible effects. However, with the increasing importance of e-government and growing requirements for local government on the plane of ICT implementation, the collection of data such as these in the Netherlands would not come as a surprise. Furthermore, for the American context, Manoharan (Citation2013) as well as Carrizales (Citation2008) found that local governments with a separate IT department, or at least an appointed IT deputy, would pay significantly more attention to e-government than those with no IT department. Data for this for the Dutch context are not available, but the decisive importance they have in the American context indicates that it is worth considering this for the Dutch context for future research.
In future research, it would be worthwhile to extend the data we explore. Recent years should be added, as it is important to investigate whether the trend of increasing maturity persists or not. In line with Manoharan (Citation2013), we could also add institutional and contextual variables. Unfortunately, we do not have such data yet. In an empirical context, there are generally some data limitations and some institutional data will be hard to get for all Dutch municipalities. In line with Wassenaar, Groot, and Gradus (Citation2013), it is also possible interviewing municipal IT executives. By interviewing 17 municipal executives, these authors described institutional motivations for Dutch privatisation, such as stability of service provision, public choice and the efficiency motive.
Another option for future research would be to analyse the relation between e-government adoption and government performance: Would a higher e-maturity rate influence effectiveness? Is a higher e-maturity a predictor for a higher satisfaction among citizens regarding municipal service delivery? The data available for government performance are still scarce and not comprehensive, but when these data are offered more extensively in the future, this could provide a starting point for research. Moreover, it would be interesting to make a cross-country comparison with other countries regarding e-maturity in local government, in order to see if the same issues and findings would arise as in the present study.
Finally, it should be noted that the (limited) view of e-government adoption as e-maturity only represents one side of the coin, as it does not take into account possible risk factors and downsides to ICT adoption by local governments (see, e.g., Netherlands Scientific Council for Government Policy Citation2011). Therefore, a strict technocratic and context-free approach to the broader issue of ICT implementations is not recommended.
Disclosure statement
No potential conflict of interest was reported by the authors.
Additional information
Notes on contributors
Tjerk Budding
Tjerk Budding is program director of the postgraduate program for certified public controllers at the School of Business and Economics, Vrije Universiteit Amsterdam, the Netherlands. His research interests include e-government, management accounting and control, and financial accounting.
Bram Faber
Bram Faber is a PhD student at the Zijlstra Center for Public Control, Governance and Leadership, Vrije Universiteit Amsterdam, the Netherlands. His research interests include innovation in public accountability, and uses of ICT in public sector reporting and service delivery.
Raymond Gradus
Raymond Gradus is Professor of Public Economics and Administration at the School of Business and Economics, Vrije Universiteit Amsterdam, the Netherlands. His research interests include public administration, local government, environmental policy and social security.
Notes
1. Meanwhile this end date has become more lenient, and the Vereniging van Nederlandse Gemeenten (Association of Dutch Municipalities) managed to negotiate 2020 as the final year in which municipal services should be offered in a digital portal.
2. Deloitte started its measurement in 2014; therefore, the data for only 3 years are available for research at present. Between 2006 and 2013, a similar survey was conducted by Ernst and Young under the denominator of ‘Benchmark Digital Service Delivery’; however, the design of this benchmark is fundamentally different from Deloitte’s measurement, making it incompatible with the more recent data. Therefore, we limit ourselves to the 2014–2016 time period.
3. In order to avoid differences in e-maturity measurement between years, we used list-wise removal for products that were not included in measurement of one or more years, so as to prevent distortion between the observations in the 3 years under consideration (see Appendix A for full disclosure).
4. As our variable for population density is defined as the address density per km2, we expect land area and population density to be highly correlated.
5. In the Netherlands, there were 625 municipalities in 1996, but by 2006 this number has fallen to 458 (Bel et al. Citation2010) and by 2016 to 390 (Statistics Netherlands Citation2016).
6. This reference group consists of municipalities with less than 1000 addresses per km2. Note that Statistics Netherlands distinguishes two groups of ‘rural areas’: those with 500–1000 addresses per km2 and those with less than 500 per km2. However, as we are primarily interested in the differences between urban and rural areas, we combined both rural groups.
7. We ran additional Pearson correlations for the relationship between continuous variables to look for significant differences, but results were comparable. Data are available upon request.
8. Data for these correlations are available upon request.
References
- Allers, M. A., and J. B. Geertsema. 2016. “The Effects of Local Government Amalgamation on Public Spending, Taxation, and Service Levels: Evidence from 15 years of Municipal Consolidation.” Journal of Regional Science 56 (4): 659–682. doi:10.1111/jors.12268/suppinfo.
- Andersen, K. V., and H. Z. Henriksen. 2006. “e-Government Maturity Models: Extension of the Layne and Lee Model.” Government Information Quarterly 23 (2): 236–248. doi:10.1016/j.giq.2005.11.008.
- Andrews, R., and G. Boyne. 2009. “Size, Structure and Administrative Overheads: An Empirical Analysis of English Local Authorities.” Urban Studies 16 (4): 739–759. doi:10.1177/0042098009102127.
- Bel, G., X. Fageda, E. Dijkgraaf, and R. H. J. M. Gradus. 2010. “Similar Problems, Different Solutions: Comparing Refuse Collection in the Netherlands and Spain.” Public Administration 88 (2): 479–496. doi:10.1111/padm.2010.88.issue-2.
- Blom-Hansen, J., K. Houlberg, and S. Serritzlew. 2014. “Size Democracy, and the Economic Costs of Running the Political System.” American Journal of Political Science 56 (4): 790–803. doi:10.1111/ajps.12096.
- Carrizales, T. 2008. “Functions of E-Government: A Study of Municipal Practices.” State and Local Government Review 40 (1): 12–26. doi:10.1177/0160323X0804000102.
- Carter, L., and F. Belanger. 2005. “The Utilization of E-Government Services: Citizen Trust, Innovation and Acceptance.” Information Systems Journal 15: 5–25. doi:10.1111/j.1365-2575.2005.00183.x.
- Colesca, S.E. 2009. “Understanding trust in e-government.” Engineering Economics 63 (4): 7–15.
- Cordella, A., and C. M. Bonina. 2005. “A public value perspective for ICT enabled public sector reforms: A theoretical reflection.” Government information quarterly 29(4): 512-520. doi: 10.1016/j.giq.2012.03.004.
- Deloitte. 2015. “Meting Aanbod Digitale Dienstverlening 2014.” Final Report, commissioned by Ministry of the Interior and Kingdom Relations and the Ministry of Economic Affairs.
- Deloitte. 2016. “Meting Aanbod Digitale Dienstverlening 2015.” Final Report, commissioned by Ministry of the Interior and Kingdom Relations and the Ministry of Economic Affairs.
- Deloitte. 2017. “Meting Aanbod Digitale Dienstverlening 2016.” Final Report, commissioned by Ministry of the Interior and Kingdom Relations and the Ministry of Economic Affairs.
- Dunleavy, P., H. Margetts, S. Bastow, and J. Tinkler. 2005. “New Public Management Is Dead – Long Live Digital-Era Governance.” Journal of Public Administration Research and Theory 16: 467–494. doi:10.1093/jopart/mui057.
- European Commission. 2017. Digital Economy and Society Index 2017. Press release, Brussels, March 3.
- Ferreira Da Cruz, N., and R. C. Marques. 2014. “Revisiting the Determinants of Local Government Performance.” Omega 4 (1): 91–103. doi:10.1016/j.omega.2013.09.002.
- Gil-Garcia, J. R., N. C. Helbig, and E. Ferro. 2006. Is It Only about Internet Access? An Empirical Test of a Multi-Dimensional Digital Divide.“ In Electronic Government. EGOV 2006, eds. M. A. Wimmer, H. J. Scholl, Å. Grönlund, and K. V. Andersen, 4084. Berlin/Heidelberg: Springer. Lecture Notes in Computer Science.
- Gottschalk, P. 2009. “Maturity Levels for Interoperability in Digital Government.” Government Information Quarterly 26 (1): 75–81. doi:10.1016/j.giq.2008.03.003.
- Groot, T. L. C. M., and G. T. Budding. 2004. “The Influence of New Public Management Practices on Product Costing and Service Pricing Decisions in Dutch Municipalities.” Financial Accountability & Management 20 (4): 421–443. doi:10.1111/j.1468-0408.2004.00202.x.
- Guillamón, M.-D., A.-M. Ríos, B. Gesuele, and C. Metallo. 2016. “Factors Influencing Social Media Use in Local Governments: The Case of Italy and Spain.” Government Information Quarterly 33 (1): 460–471. doi:10.1016/j.giq.2016.06.005.
- Ho, A. T. 2002. “Reinventing Local Governments and the E-Government Initiative.” Public Administration Review 62 (4): 434–444. doi:10.1111/00333352.00197.
- Homburg, V., A. Dijkshoorn, and M. Thaens. 2014. “Diffusion of Personalised Services among Dutch Municipalities: Evolving Channels of Persuasion.” Local Government Studies 40 (3): 429–450. doi:10.1080/03003930.2013.795892.
- Klein, P. 2017. “Metatopos. Online.” Last Accessed 20 (December): 2017. http://www.metatopos.eu/gemhis.html.
- Layne, K., and J. Lee. 2001. “Developing Fully Functional E-Government: A Four Stage Model.” Government Information Quarterly 18 (2): 122–136. doi:10.1016/S0740-624X(01)00066-1.
- Manoharan, A. 2013. “A Study of the Determinants of County E-Government in the United States.” American Review of Public Administration 43 (2): 159–178. doi:10.1177/0275074012437876.
- Ministry of the Interior and Kingdom Relations (Ministerie van Buitenlandse Zaken en Koninkrijksrelaties). 2013. “Visiebrief Digitale Overheid 2017.” The Hague: Ministry of the Interior and Kingdom Relations, Reference 2013-0000306907.
- Moon, M. J. 2002. “The Evolution of E-Government among Municipalities: Rhetoric or Reality?” Public Administration Review 62 (4): 424–433. doi:10.1111/0033-3352.00196.
- Nasi, G., F. Frosini, and D. Cristofoli. 2011. “Online Service Provision: Are Municipalities Really Innovative? The Case of Larger Municipalities in Italy.” Public Administration 89 (3): 821–839. doi:10.1111/j.1467-9299.2010.01865.x.
- Netherlands Scientific Council for Government Policy (Wetenschappelijke Raad voor Regeringsbeleid). 2011. “iOverheid.” WRR-Rapport 86.
- Pollitt, C. 2003. “Joined-Up Government. A Survey.” Political Studies Review 1 (1): 34–49. doi:10.1111/1478-9299.00004.
- Rodriguez Bolivar, M. P., L. Alcaide Muñoz, and A. M. López. 2016. “Scientometric Study of the Progress and Development of e-Government Research during the Period 2000-2012.” Information Technology for Development 22 (1): 36–74. doi:10.1080/02681102.2014.927340.
- Rogers, E. M. 1983. Diffusion of Innovations. London: Collier Macmillan.
- Rooks, G., U. Matzat, and B. Sadowski. 2017. “An Empirical Test of Stage Models of E-Government Development: Evidence from Dutch Municipalities.” The Information Society 33 (4): 215–225. doi:10.1080/01972243.2017.1318194.
- Ruano De La Fuente, J. 2014. “E-Government Strategies in Spanish Local Governments.” Local Government Studies 40 (4): 600–620. doi:10.1080/03003930.2013.787414.
- Siau, K., and Y. Long. 2006. “Using Social Development Lenses to Understand E-Government Development.” Journal of Global Information Management 14 (1): 47–61. doi:10.4018/jgim.2006010103.
- Statistics Netherlands (Centraal Bureau voor de Statistiek). 2012. “ICT, Kennis En Economie.” Report. Den Haag/Heerlen.
- Statistics Netherlands (Centraal Bureau voor de Statistiek). 2016. “Aantal Gemeenten in 2016 Daalt Naar 390.” Accessed 20 April 2017. https://www.cbs.nl/nl-nl/nieuws/2016/01/aantal-gemeenten-in-2016-daalt-naar-390
- Steiner, R., and C. Kaiser. 2017. “Effects of Amalgamations: Evidence from Swiss Municipalities.” Public Management Review 19 (2): 232–252. doi:10.1080/14719037.2016.1153704.
- Valdés, G., M. Solar, H. Astudillo, M. Iribarren, G. Concha, and M. Visconti. 2011. “Conception, Development and Implementation of an e-Government Maturity Model in Public Agencies.” Government Information Quarterly 28 (2): 176–187. doi:10.1016/j.giq.2010.04.007.
- Van Deursen, A. J. A. M., and J. A. G. M. Van Dijk. 2009. “Improving Digital Skills for the Use of Online Public Information and Services.” Government Information Quarterly 26 (2): 333–340. doi:10.1016/j.giq.2008.11.002.
- Wassenaar, M., T. Groot, and R. H. J. M. Gradus. 2013. “Municipalities’ Contracting Out Decisions: An Empirical Study on Motives.” Local Government Studies 39 (3): 414–434. doi:10.1080/03003930.2013.778830.
- Yildiz, M. 2007. “E-Government Research: Reviewing the Literature, Limitations, and Ways Forward.” Government Information Quarterly 24 (3): 646–665. doi:10.1016/j.giq.2007.01.002.
Appendix A:
E-maturity scale
The Deloitte e-maturity survey measures the digital maturity level of the most used products for citizens and businesses in municipalities. For the scale for this e-maturity level, the following classification is used.
The following table presents a list of products compiled by Deloitte that most municipalities offer to citizens. For each product, the survey made an assessment of its maturity level.
Appendix B:
Costs
All municipal cost categories for the Netherlands are published as open data on the website of Statistics Netherlands. We picked out three of them. Accordingly, we linked some of the products that were assessed in the e-maturity survey to the costs to a specific kind of service delivery. The general civil services entry represents the aggregate e-maturity rating of a selection of municipal products; ‘housing taxes’ and ‘other municipal taxes’ represent the e-maturity of only one accompanying product. In the table below is the description of every cost function and the municipal citizen products that were used for comparison for each cost function.